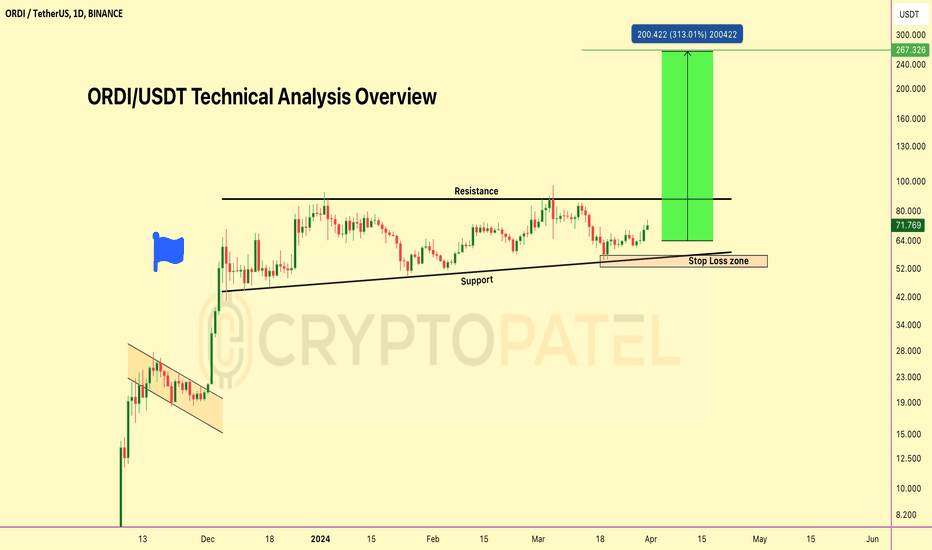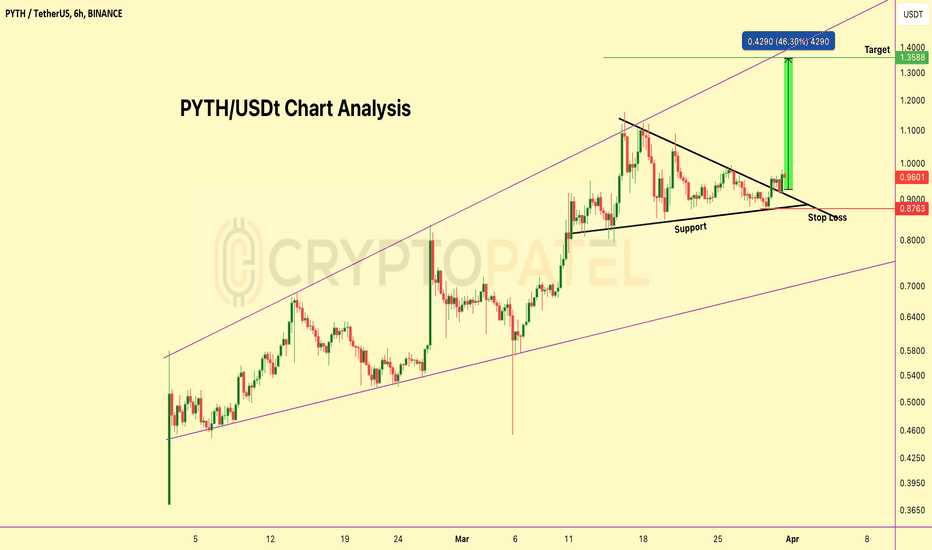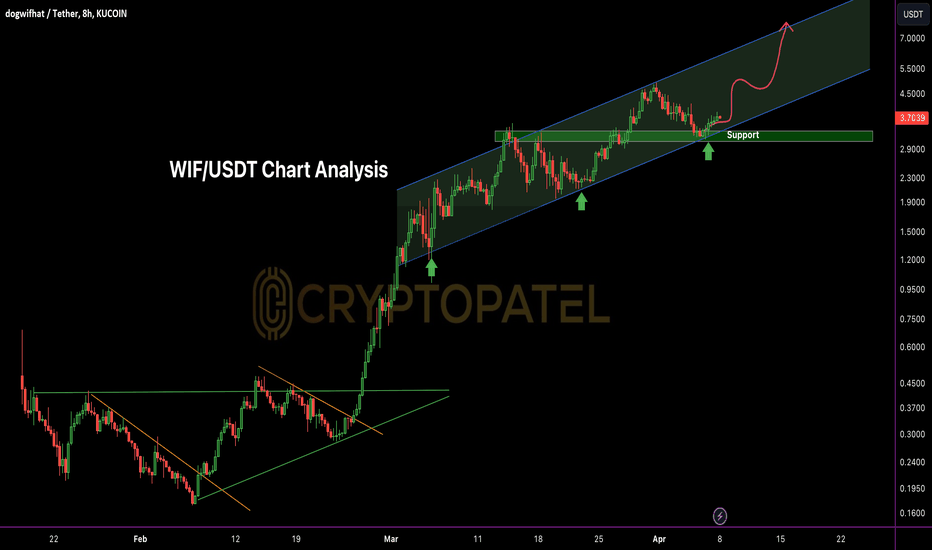
WIF/USDT Ready for Big Pump or Big Dump ?Trading CRYPTOCAP:WIF ? Here’s How to Win Big or Stay Safe
➡️ Easy Trading Tip: #WIF chart is clearly going up, making it a good choice for easy trades.
➡️ Strong Support: Rebounded from $3.20, showing strong support.
➡️ Next Goal: Staying in the channel could push us to $7 target.
➡️ Watch Out: If it drops below $3, consider exiting long positions.
➡️ Skyrocketed: From $0.17 in Feb to an ATH of $4.91 in March ( 28x in 2 months )
➡️ Risk vs Reward: High risk, but a tight stop loss could mean
Bullish Patterns
Very Bullish on Silver Any one who interest to invest in silver ... This is the best time to buy silver as we can see that silver has give a big time breakout above the 26 dollar so its a clear sign that the buyer has come to flow upward price of the silver . . .
As you also know that the silver and gold is a good asset class . so wants to beat inflation with minimum risk can go with the silver and gold as well gold is also asset class but today my idea is specific about only one that is silver. . .
remember th
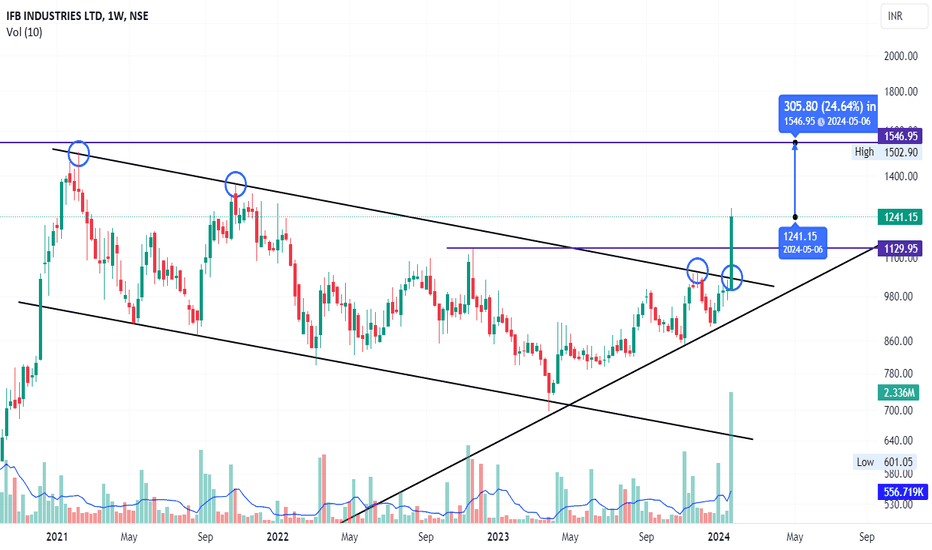
IFBIND / IFB INDUSTRIES LTD - 3 Years Downtrend Channel BreakoutIFBIND
1) Time Frame - Weekly.
2) The Stock has been consolidating in a downtrend channel since 2021 & Now It has given a 3 years Downtrend breakout with huge volume & strong bullish candle close in weekly.
3) The next target / resistance would be its previous life time high (1546.95 - 24.5% from the current price 1241.95).
4) Recommendation - Strong Buy
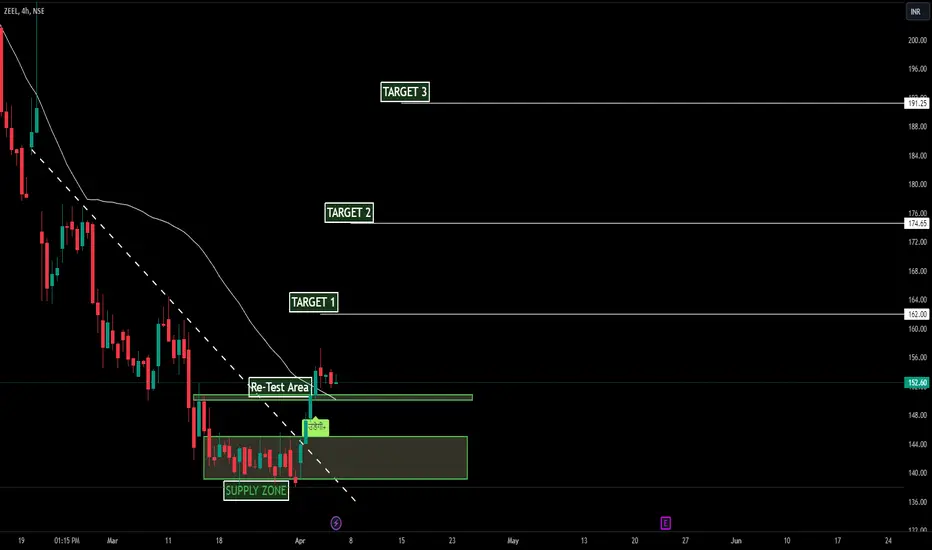
Swing Trading Gem:(ZEEL Set to Soar 10-15 % in a Month or Two*ZEEL is ready to offer returns ranging from 10-15% within a timeframe of one to two months*. Please note that terms and conditions apply.
Reasons to Consider Taking a Trade:
- A crucial Supply/Support zone has been pinpointed within the range of 140-145
- The trendline break.
- Price has surged above the 50 Moving Average, which is now acting as a support level.
Targets:
I think Target 1: Will be achieved in a week or two and then 174 Target 2 will be achieved in a month and if ZEEL Blast the
#ETHEREUM Chart Update #ETHEREUM Chart Update
CRYPTOCAP:ETH is currently testing its support level.
We're keeping an eye on it!
If it falls below this support, it might not look good for the market for a bit.
I think we might see a lot of ups and downs leading up to the halving.
Stay tuned!
#ETH #Altcoins
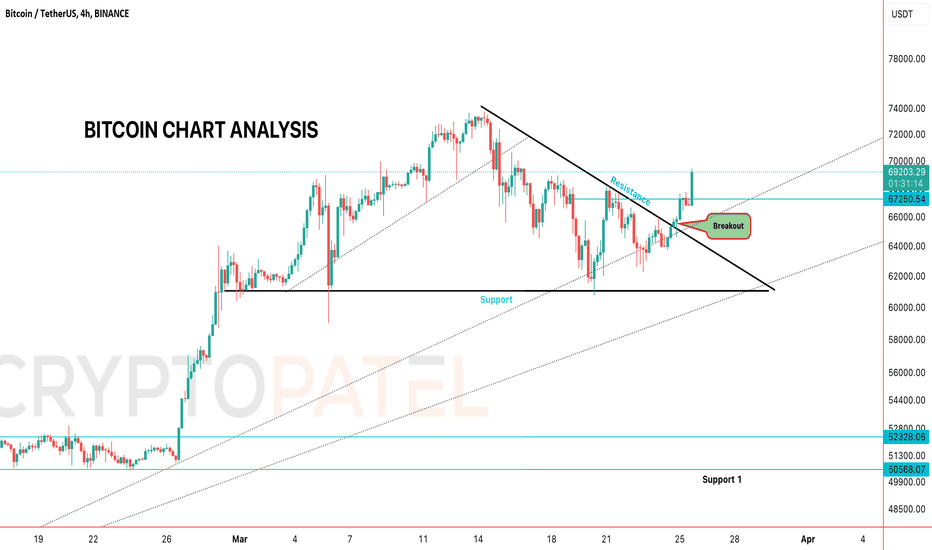
#Bitcoin Big Fight: Bulls vs. Bears ( Fresh Update )#Bitcoin Big Fight: Bulls vs. Bears ( Fresh Update )
Hey everyone! Right now, Bitcoin is at $66,233
Key Points:
Big Move Alert: If Bitcoin jumps over $70,500, we might just see it hit $100,000 super fast.
Bulls' Hope: Watch out for $62,500. If we stay above this, the bulls have a chance to keep the party going.
Bears' Target: If we fall under $62,500, we could be heading down to $50,000.
Important Levels:
Support (Bulls' Floor): $62,500
Resistance (Wall to Break): $71,000
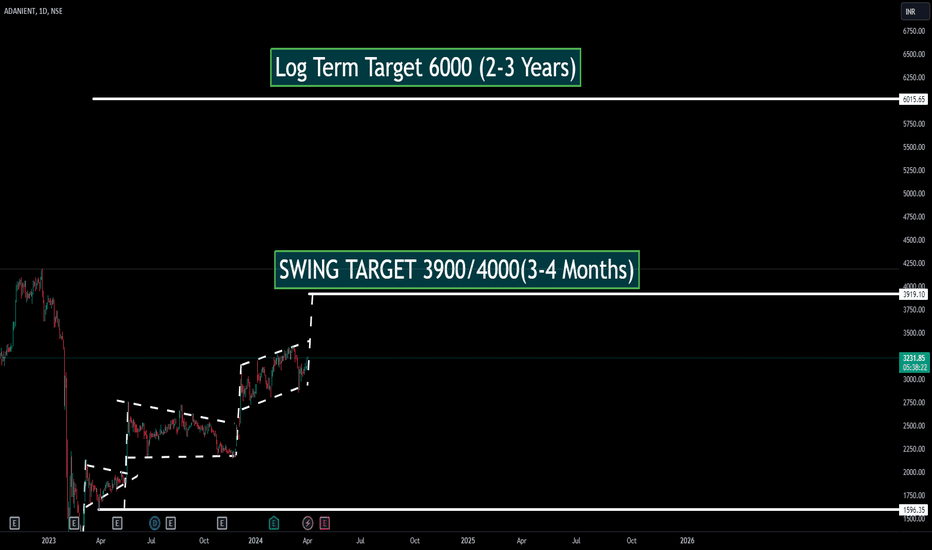
Investment Gem: (Adani Enterprise) Set to Soar 20-25%!ADANI ENTERPRISE:
Swing Targets: 3900/400
Long Term: 6000
Company Background and Work:
- Founded by Gautam Adani in 1988, Adani Enterprises Limited is a conglomerate within the Adani Group.
- Core sectors: Energy, infrastructure, logistics, agribusiness, real estate, financial services, and defense.
- Evolution into a leading player in India's business landscape.
- Core businesses: Trading, coal mining, renewable energy generation, agribusiness, and logistics.
- Trading: Started with agricultur
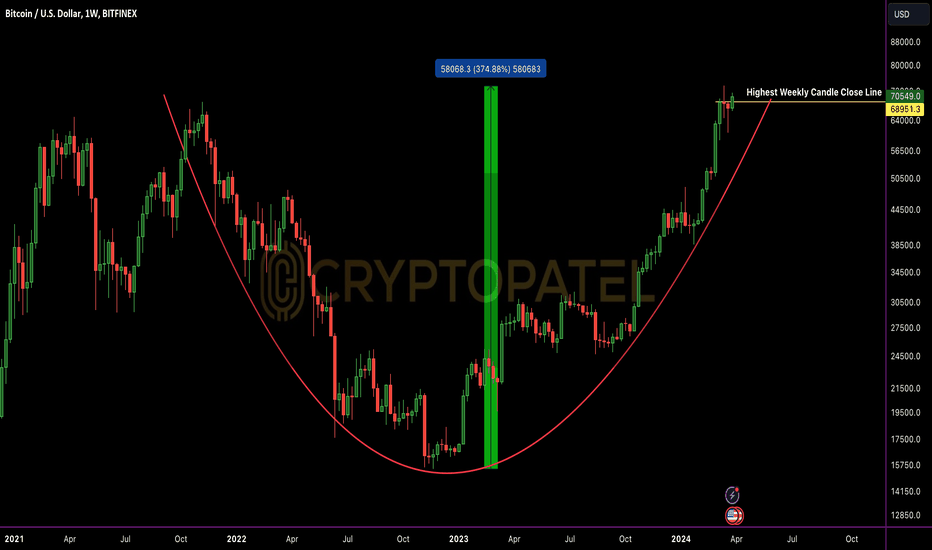
#BITCOIN WEEKLY CANDLE ALERT #BITCOIN WEEKLY CANDLE ALERT
In just 7 hours, #BTCUSDT is on the brink of making history.
Aiming for its highest weekly/monthly close EVER, and the first ever above previous cycle's peak!
Previous Highest Weekly Close : $68,951
Need to Close above $69,000
Will #BTC make Highest Weekly/Monthly Candle ?
CRYPTOCAP:BTC
BANK NIFTY MARCH MONTH EXPIRY ANALYSISBankNifty Important Levels for March Month Expiry:
=> Naked Buyer Strategy:
CALL Side:
Buy Above: 47040.
Put Stop Loss: 46950.
Targets: 47130, 47203, 47288, 47368 and 47423.
PUT Side:
Sell below: 46800.
Stop Loss: 46880.
Targets : 46720 ,46650, 46570 and 46474.
=> Hedging Strategy:
UP SIDE:
Sell 47300/47400 PUT (Premium price 500-570) & Hedge with 46400 PUT (Premium price 100).
DOWB SIDE:
Sell 46400/46300 CALL (Premium price 550-630) & Hedge with 46430 PUT (Premium price 130).
=> Se
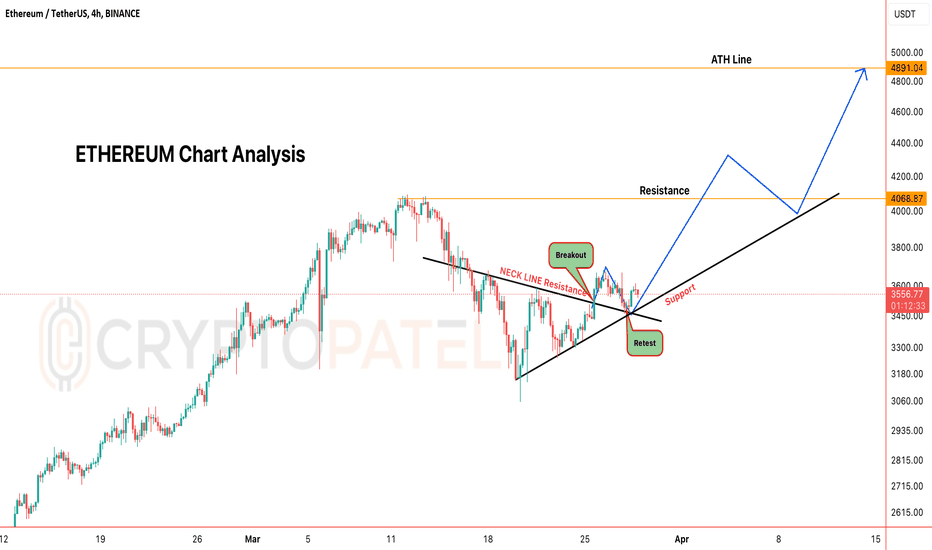
#ETHEREUM READY FOR NEW ALL TIME HIGH #ETHEREUM READY FOR NEW ALL TIME HIGH
1⃣ Breakout Triangle Resistance & did Perfect Retest
2⃣ Also Formed Inverse H&S Pattern NECKLINE Breakout & Retest Done
3⃣ CRYPTOCAP:ETH Must Hold $3450 Support for New ATH
4⃣ Next Targets Would be $4068/$5000
5⃣ Always Use Stop Loss as per your Risk Reward Ratio
Share/Comments if you agree with My Setup.
NFA
BANK NIFTY MARCH MONTH EXPIRY ANALYSISBankNifty Important Levels for March Month Expiry:
=> Naked Buyer Strategy:
CALL Side:
Buy Above: 47040.
Put Stop Loss: 46950.
Targets: 47130, 47203, 47288, 47368 and 47423.
PUT Side:
Sell below: 46800.
Stop Loss: 46880.
Targets : 46720 ,46650, 46570 and 46474.
=> Hedging Strategy:
UP SIDE:
Sell 47300/47400 PUT (Premium price 500-570) & Hedge with 46400 PUT (Premium price 100).
DOWB SIDE:
Sell 46400/46300 CALL (Premium price 550-630) & Hedge with 46430 PUT (Premium price 130).
=> Se
Syrma-A hidden bullish divergence hinting a reversal?Syrma is a very reputed Electronics manufacturing supplier which has shown good growth in past few years.
Technical analysis of chart shows bullish divergence near a strong support.
If the stock crosses 500, we can see quick move towards target mentioned. A supportive broader market can also help stock make new ATH.
Keep in watchlist.
#StopLoss : The Safety Net You Need#StopLoss : The Safety Net You Need
Ever danced with volatility?
Without a stop loss, it's like tightrope walking without a net.
Here's why it's a MUST:
✅ Protect Your Fund: Keep that hard-earned Money safe
✅ Sleep Tight: Close your eyes without the market nightmares
✅ Plan Your Exit: Know when to bow out gracefully.
Remember, it's not just about making money; it's about keeping it too.
Like/Share if you also Agree with my Post.
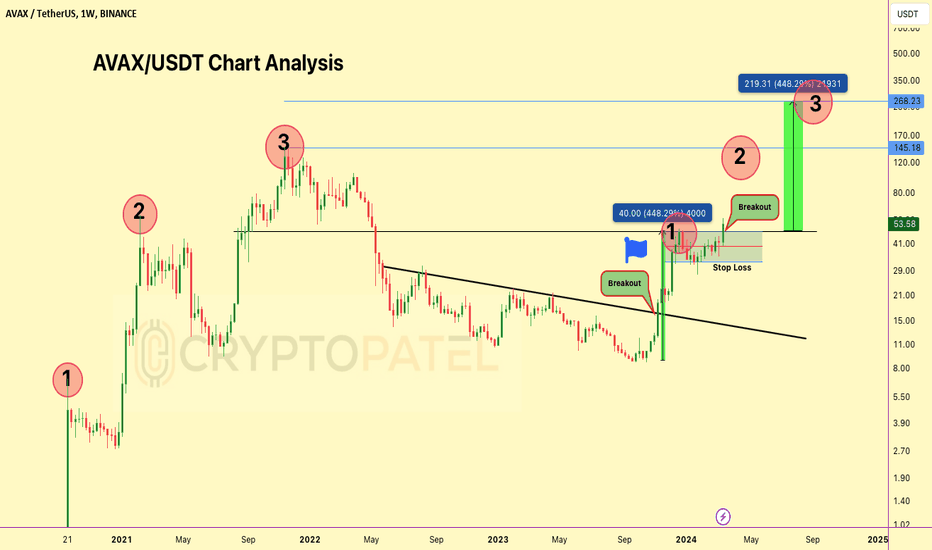
AVAX/USDT Is super Potential as per chart analysis CRYPTOCAP:AVAX Ready for $270 in Bull Run?
1⃣ #AVAX Forming Bull Flag in HTF
2⃣ Breaking out Flag resistance
3⃣ As per Bull Flag Pattern target will be $269
4⃣ For Bull Zone Weekly Candle must hold above $32
5⃣ If 1,2,3 Fractals works then AVAX/USDT will be Super Bullish
6⃣ #Avalanche is a layer-1 blockchain
#cryptomarket
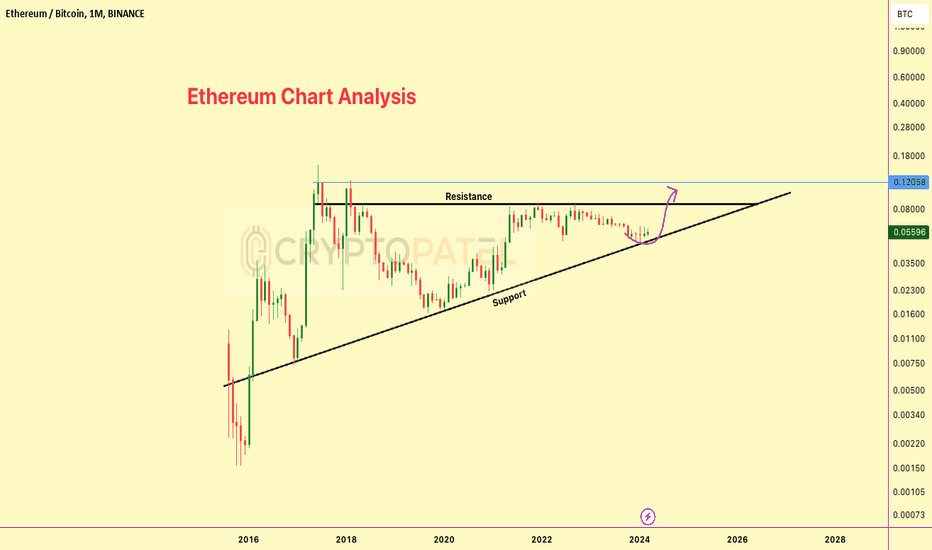
ETH/BTC Chart Overview in monthlyETH/BTC Ascending Triangle Chart Analysis
1️⃣ Forming Strong Ascending Tringle in Monthly Chart
2️⃣ Price holding Strong Support at 0.045 BTC Level
3️⃣ Not Expecting Much Move but Expect Max will hit 0.150 BTC
4️⃣ If hit ETH = 0.150 BTC then CRYPTOCAP:ETH
Price will be FWB:12K -$15k
5️⃣ Supper Bullish Spot Ethereum ETF News in Q2
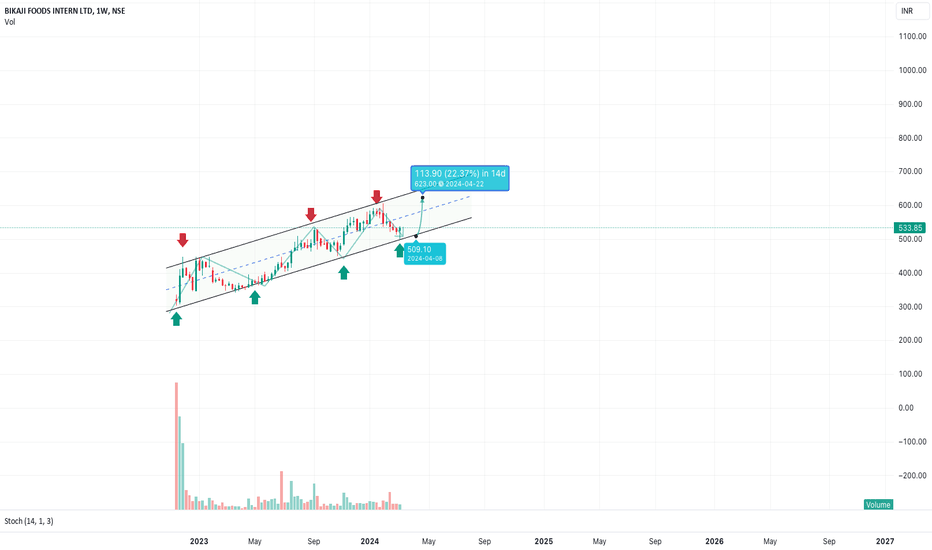
BIKAJI - Ready for the next swingBIKAJI is poised for its next upward move, presenting a potential upside of approximately 23%. The stock has maintained a trading channel for the past 2 years. This is an opportune moment to consider entry due to the following factors:
1. The Risk:Reward ratio appears favorable, with a stop loss (SL) potential below the channel.
2. Last week's candle exhibits a bullish hammer pattern, commonly indicating a reversal.
3. Very consistent fundamental numbers.
MAN/USDT 20x Potential and Bullish As per chart analysis NYSE:MAN 21x Potential Bull Run Analysis
1⃣ #MAN Broken Potential Inverse H&S Pattern
2⃣ Technically MAN/USDT is 21x Potential from Breakout Level
3⃣ Bull Run Targets = $$0.148/$0.387/$0.69
4⃣ Best Accumulation Zone of Matrix AI Network
◾️ Entry 1 = $0.05-$0.037
◾️ Entry 2 = $0.03-$0.025
5⃣ Matrix 3.0: Blending neuroscience, AI, and blockchain
6⃣ Avatar Intelligence (AvI) to create digital avatars from brain data ( This is 1st phase of AvI implementation )
MLong