 Long
Bullish Patterns
Long
Possible C-Wave; Short term Elliotical Approach to EURUSD. Hello Traders!
1. We see a 5-wave move down, a clear impulse; then Wave A breaking into 5 parts, and then a clear Wave B breaking into further 3 parts.
2. We see a running triangle variation forming as shown in the chart and then a 5-move impulse down. Image attached.
3. A 5-move wave up can be clearly seen on the chart in the 15-minute timeframe. That will be our 1st wave.
4. Target can be anywhere between 100% of Wave B and 161.8% of Wave A. That gives us the complete green zone.

 Long

TRIVENI TURBINE Hourly looking bullishTRIVENI TURBINE Hourly chart has inverted head n shoulder breakout/trendline breakout.
Good to buy at 323 for target of 401 with sl below 302
 Long

NTPC BULLISHNTPC Closing 172.4 with stoploss 161 then targets are 183-190.
Buying Reason.
1 --> Price closing above 20,50 EMA.
2 --> RSI is ready Cross 60 Level.
3 --> ADX is showing the Bullish Move and +DMI is Rise.
4 --> Volume is also showing the Breakout Volume and Cross the Average Volume.
5 --> Also Bollinger Bands are Open is Positive side.
 Long

TFCI TRADE wisely.
WE CAN JUST PREDICT.
Disclaimer: I am not a SEBI registered advisor , so before entering on my view plz ask your SEBI Registered Advisor . Profit is your and loss is your.
 Long

Zentec Bullish engulfing 1DThe pattern consists of a small red candlestick followed by a larger green candlestick that completely engulfs the previous red candlestick. The red candlestick represents selling pressure, while the green candlestick represents a strong buying pressure that is able to overcome the selling pressure and push the price higher.
The potential targets are 305, 345 and 380.
 Long

DELTACORP Out of Bears control ??!!!Chart pattern insist me the above titled opinion
REASONS
1. DELTACORP is trading inside a expanding triangular pattern .
2. It is seen respecting the pattern till now.
3. Currently , it is in the upswing move(in white channel pattern ) inside the expanding triangle pattern.
4. DECEMBER 23 & 26 candles make the Bullish harami pattern at the perfect support level .(with volume spike)
5. 238 is the resistance level( Breakout of the yellow trendline) to cross for the expected up move !!
6. Ta
 Long

Monitor IOC on 2H Chart for an opportunity of Swing TradeTechnical Analysis on 2H time frame.
Figure 1
1) I use EMA of 20, 50, 100 and 200 periods.
2) The moving averages are contracted in a very symmetric way.
3) The 20, 50 and 100 ema lines are almost on the same level.
4) The resistance comes on the level of 81
Figure 2
1) On 17 Feb we got the breakout of the triangular pattern.
2) The price tested its resistance of 81 but failed to give the breakout.
Figure 3
1) Bollinger bands are squeezed and a long pipe-like structure is formed.
2) The
 Long

Why I selected IGL for Swing Trade on 4H time frame.IGL looks bullish on 4h chart.
Technical Analysis:
Candlestick Chart:
- Breakout of Triangular pattern.
- Breakout of Resistance at 436.
- EMA 20,50,100,200
+ Moving average lines expanded.
+ All moving average lines are arranged according to their position.
Renko Chart (Brick Size = 5)
- 4 Bricks are printed
+ First 3 bricks formed the base zone.
+ From the 4th brick it has entered in zone 1.
Conclusion:
We can take a long position from 430 to 440 with a stop loss
 Long

IEX looks good for Swing Trade on the Daily Chart.Technical Analysis
Figure 1
1) Bollinger Band squeezed and formed a pipe-like structure.
2) Breakout of the upper band.
3) RSI > 6
4) MACD Bullish Crossover and histogram gives the buy signal.
Figure 2
We use Exponential Moving Averages of 20, 50, 100 and 200 periods.
- The averages are expanded.
- The price is testing its 100ema
- The overall structure looks bullish and the price can test its 200ema which is at the level of 155.75
Resistance - 153
Conclusion:
The stock looks bullish.
 Long

 Long

intraday, swing, short termFundamentally earnings also good
dividend also provided
for long term investment
reffer my old analysis attached below
 Long

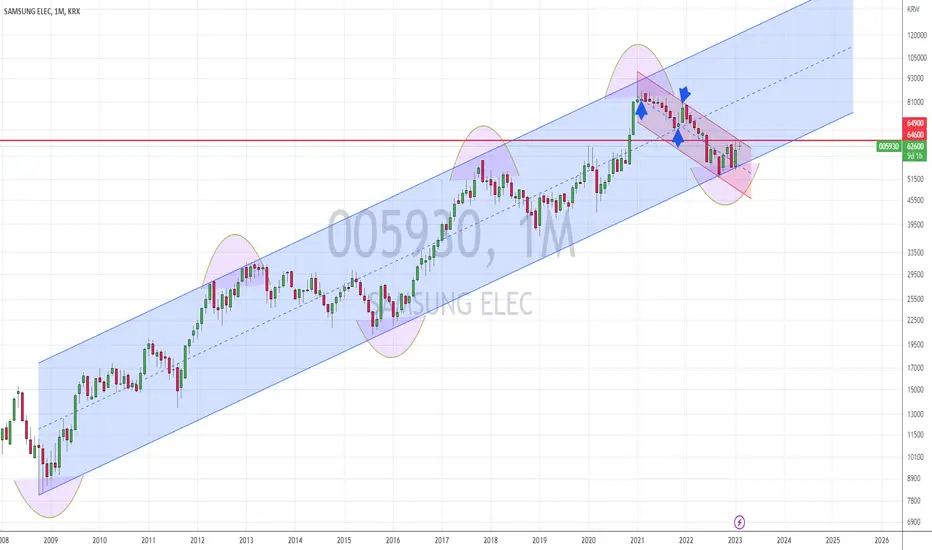
Samsungelecsince jan 2021 Samsung electronic is under selling pressure in parallel channel mode. after trying to cross 2 time still this is not able to cross the upper edge of the channel.
however this time looks to be different. It has touch the lower edge of long term channel. So I am expect the up move to continue
 Long
 Long

CNXIThead and shoulder followed by Inverse Head and shoulder has made this structure very interesting. Expect a bounce in near term
 Long

BHARATFORG Ready for Upmove ??!!Chart pattern does insist me to go with above titled opinion
REASONS
1. Bharatforg has been trading inside Expanding triangle and currently it is under its upswing move inside the major expanding triangle.
2. In Weekly timeframe, there is a Bullish Pennant formed and Breakout has happened it seems( volume not so good )
3. Target and SL mentioned @ chart
4. SL(less risky) can be Day candle closing out of dark blue Ascending channel .
5. Pink trendline (884 level) seems tough a
 Long

Renuka Sugars: Good price to enter from Long term perspectiveStock is at support levels. Buy at CMP and on dips towards 42.
Important resistance around 63-68. Once crossed and sustained, the stock may head much higher....
Take care & safe trading...!!!
Disclaimer
- The view expressed here is my personal view
- Past performance is not a guarantee for future predictions
- Use this for educational purpose
- Any decision you take, you need to take responsibility for the same
- It's your hard earned money. Treat it wisely
- Trade / Invest keeping in min
 Long

INDHOTELIf the weekly close price is above 322 then we can expect a steady bullish in coming days.
Target 1 range - 348 to 350
Target 2 range - 365 to 370
 Long

ZENSARTECH Daily looking bullishZENSARTECH Daily has rounded bottom breakout with 200 ema support on daily candle. Good to buy at retracement near 252 for targets of 323,395 and long term target of 538 with sl below 244
 Long

TCS Daily looking bullishTCS Daily has inverted head and shoulder breakout. Good to buy at 3529 for target of 4043 with sl below 3436
 Long

LICHSGFIN ON 15MINLICHSGFIN in symmetrical triangle, watchout for breakdown or breakout.
Take lines as targets.


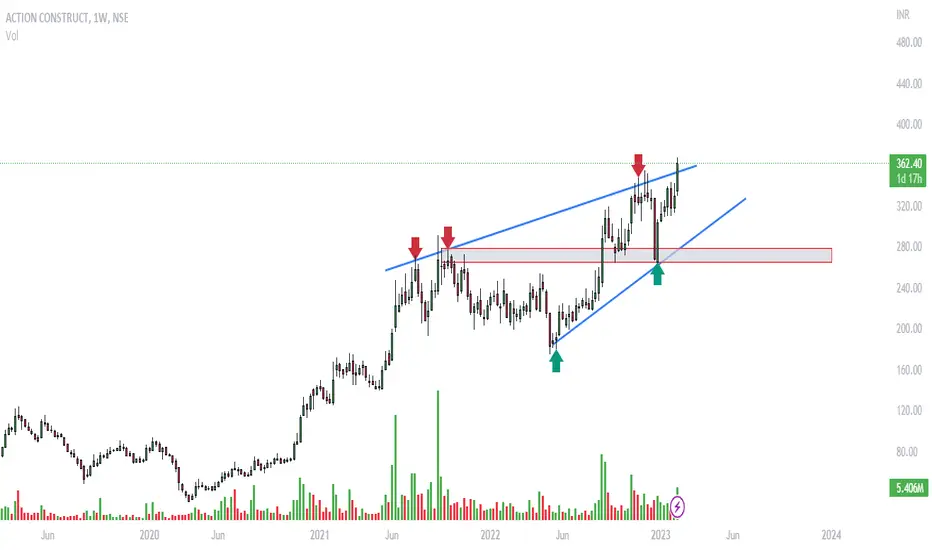
ACE weekly ChartAction Construction Equipment's Weekly Time Frame Breakout Confirm
It Is Breaking out the zone and Going for Bull Run
 Long
HLong

MANINFRA Daily looking bullishMANINFRA Daily has trendline breakout with 200 ema support on daily candle. Also it made double bottom with rsi divergence.
Good to buy at 82.50 for target of 99 with sl below 78
 Long
