$ONDO PRICE FORECAST | IS $7.65+ POSSIBLE? | CRYPTOPATEL TALSE:ONDO Is Trading At A High-Timeframe Fibonacci Demand Zone, Holding The 0.618 Retracement (~$0.45) After A Deep Corrective Move โ A Textbook Accumulation Structure.
Technical Structure
Accumulation Zone: $0.40โ$0.45
Bullish Order Block / Deeper Demand: $0.25โ$0.30 (0.786 Fib)
HTF Structure Remains Valid Above $0.25
Structural Flip Can Trigger Impulsive Expansion
Price Targets: $0.82 โ $1.20 โ $2.15 โ $7.65+
As Long As Demand Holds, ONDO Remains Positioned For A Multi-Leg Cycle Expansion W
Bullish Patterns
$ONDO PRICE FORECAST | IS $7.65+ POSSIBLE?LSE:ONDO is currently trading inside a high-timeframe Fibonacci demand zone after a deep corrective move. Price is holding above the 0.786 retracement, suggesting a potential accumulation phase rather than continuation to the downside.
This structure is consistent with HTF accumulation behavior, where patience is required before expansion.
\
Technical Structure Overview:
HTF Accumulation Zone: $0.45 โ $0.35
Bullish Order Block / Deeper Demand: $0.30 โ $0.25 (0.786 Fib)
HTF Market Structure Rem
XAUUSD Bullish Continuation | Buy the Dip @ 4400 - 4375Gold (XAUUSD) has delivered a strong bullish impulse following heightened geopolitical tensions involving the US and Venezuela. Price is holding firmly above the 4400 key support zone, signaling sustained bullish strength.
As long as gold maintains acceptance above this level, the bias remains bullish, with upside targets at 4440 and 4470.
We are patiently waiting for a healthy pullback toward support to look for high-probability buy opportunities in line with the prevailing trend.
๐ Disclaim
$ASTER PRICE FORECAST | CAN ASTER HIT $10โ$15? | ANALYSIS BY CPBINANCE:ASTERUSDT | Breakout Structure From HTF Accumulation | TA By CryptoPatel
ASTER is trading at a high-timeframe accumulation base following a prolonged corrective phase. Price compression near demand indicates trend exhaustion with increasing probability of a bullish expansion.
Technical Structure
Accumulation range holding: 0.65 โ 0.75
Descending trendline pressure building
Strong demand reaction inside accumulation zone
Volatility contraction โ expansion setup
Key Levels
Bullish Whil
$XRP Price Forecast | Is $10 Possible?CRYPTOCAP:XRP Is Currently Retesting A Breakout That Took Nearly 8 Years To Form โ A Rare, High-Timeframe, Cycle-Level Structure That Typically Precedes Major Market Expansions.
The Last Time This Exact Structure Appeared (2017), XRP Delivered An Extraordinary 40,000% (400x) Move Following The Breakout.
Current High-Timeframe Technical Structure:
โ
Multi-Year Descending Structure Broken
โ
~57% Corrective Pullback From Recent ATH
โ
Price Holding Within The $2โ$1.50 Demand Zone
โ
Strong Macro S
BNB Price Forecast 2026 | Is $10K/BNB Possible? | Analysis By CPBNB has shown strong price action recently. After bouncing from the $500 support zone, price moved higher, broke the previous all-time high, and successfully cleared the $700 resistance, which is now acting as a strong support area.
Currently, BNB is consolidating around the $800 level, suggesting the market is digesting the recent move.
Technical Overview
Multi-year ascending trendline: Still intact, indicating long-term bullish structure.
Major support zone: $500โ$800
This range has acted a
ETHEREUM 2026 ATH Price Forecast | Bitcoin Halving Cycle AnalysiThis study observes Ethereumโs historical behavior relative to Bitcoin halving events. The purpose is to highlight recurring market structure patterns, not to provide financial or investment advice.
Observed Historical Cycles
2016 Bitcoin Halving
~70% drawdown in ETH
~546 days of sideways accumulation
Followed by a multi-year expansion phase (~22,800% peak move)
2020 Bitcoin Halving
~75% drawdown in ETH
~546 days of consolidation
Subsequent expansion to ~$4,693 (+2,600% approx.)
2024 Bitcoin
$BNB Technical Analysis: Why $10,000 Is On The RadarBNB Technical Analysis: Why $10,000 Is On The Radar
1๏ธโฃ Historical Precedent
2021 Bull Run: +1,950%
2027 Projection: +1,900% (based on same chart pattern & price structure)
Repeating patterns suggest massive green candles could follow.
2๏ธโฃ Key Support Zones
Strong long-term support: $500 & $200 ( Accumulation zone )
Support is holding, signaling a high-probability base for a breakout.
3๏ธโฃ Price Targets
Short-term: $2,000 โ $5,000
Long-term: $10,000 ๐ฏ
This aligns with historical price
Will SOLANA potentila to $1000?Many people are emotionally attached to Solana and the $1,000 target and that may be possible long term.
But markets never move straight up.
Corrections are part of every cycle, and CRYPTOCAP:SOL is currently in a correction phase.
If the $120 support breaks, Iโm expecting SOL to drop below $100.
A move under $100 could offer a strong long-term accumulation opportunity.
My accumulation zone: $98 โ $50
Long-term outlook: $500 โ $1,000
Crypto is highly volatile and risky.
Always DYOR, manage
Is $MONAD Bullish? Technical Structure Suggests 10x PotentialPrice is Consolidating in a range-bound Structure Between Well-Defined Support and Resistance, indicating active Accumulation.
๐ฆ Demand Zone: $0.020โ$0.022
๐ฅ Supply Zone: $0.025โ$0.027
A Confirmed Breakout and close above Resistance Would signal a Bullish Structure Shift and Continuation of the Uptrend.
Trend Remains Bullish above $0.016, the recent swing low. A breakdown below invalidates the setup.
Based on Structure and Expansion Potential, 10x Upside is possible in a Strong Altseason.
Vol
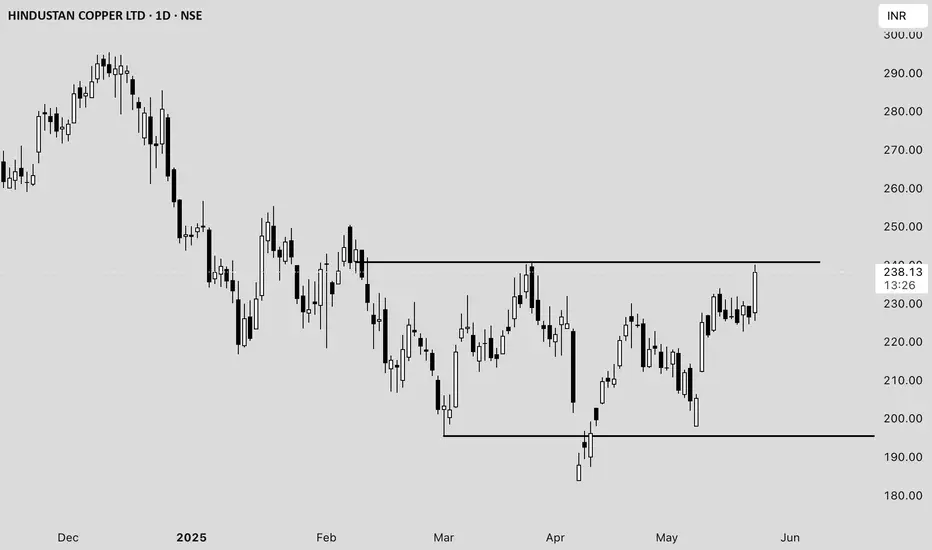
Hindustan Copper Ltd. (HINDCOPPER) Price Analysis **Date:*#### **Current Price and Intraday Movement**
- **Latest Price:** โน237.98 (+5.09% / +โน11.52)
- **Dayโs Range:** โน225.50 โ โน240.10
- **Open:** โน227.60
- **Previous Close:** โน226.46
- **Volume:** 1.63 crore shares (well above average daily volume of 55.89 lakh)
#### **Technical Overview**
- **52-Week Range:** โน183.82 โ โน381.90
- **50-Day Average:** โน216.99
- **200-Day Average:** โน260.58
- **Market Cap:** โน23,013 crore
- **P/E Ratio:** 57.48
- **EPS:** โน4.14
#### **Recent Performance an
Kalyan Jewellers Bullish SetupKalyan Jewellers
F&O Segment Stock
The stock fell almost 50% from its high of about โน783 in September 2024. But now it's finding good support, building a base, and moving inside a parallel channel. For the past year, it's been stuck in a rangeโwhich usually means a bigger move is getting ready (could be a channel, triangle, or some other pattern).
Here's why I'm positive about it:
It's holding strong at the channel's lower support line.
It's sitting right on key moving averages (EMA support).
Everyone Asking Why $PIPPIN Did a 30x in a Few Days Is Already LEveryone Asking Why CRYPTOCAP:PIPPIN Did a 30x in a Few Days Is Already Late (Read Before You Trade)
CRYPTOCAP:PIPPIN did not rally 30x because of innovation.
It rallied because market structure allowed it to.
No presale.
No venture capital.
No team allocation.
From Pump.fun to $300M+ market cap in days.
Here is the reality ๐
1๏ธโฃ Separate narrative from mechanics
Markets do not move on stories.
They move on liquidity, positioning, and leverage.
CRYPTOCAP:PIPPIN โs move was structural,
$TAO Reset Complete? This One Level Decides the Next 5xGETTEX:TAO : High-Timeframe Technical Outlook
GETTEX:TAO has already delivered ~200% upside from earlier structure. From the recent swing high near $539, price has corrected ~50% and is now ~65% below ATH, A normal reset after an impulsive expansion.
Key Structure & Levels
Price is currently trading above the 0.618 Fibonacci retracement at ~$262, which is a critical HTF support.
As long as $262 (0.618 fib) holds on a daily/weekly closing basis, the structure remains bullish, with potential f
ETH Premium OB & FVG Zones โ ChoCh Could Hit at $3,660ETH Premium OB & FVG Zones โ ChoCh Could Hit at $3,660
Market remains in a Bearish Structure with steady LH โ LL and clean BOS down. The current upward move is just a retracement into premium.
Key Zones:
FVG: $3,250โ3,350 โ First Reaction Zone for Short Entries
Bearish OB: $3,600โ3,660 โ Prime Supply Zone for Shorts
Shorting Strategy:
If you are Shorting ETH, these are the best levels to scale in.
Caution:
Any HTF candle closing above $3,660 Bearish OB signals a ChoCh. Exit shorts immediatel
Is $LTC Dead? The Same Question Asked Before Every Major RallyโฆIs NYSE:LTC Dead? The Same Question Asked Before Every Major Rallyโฆ
When markets forget history, they repeat it. Litecoin has gone through multiple full-cycle Retracements, Each time followed by explosive multi-X expansions. Letโs walk through the data:
๐ฐ 2013โ2015 Cycle: โLTC is Deadโ #1
๐น LTC hit an ATH of $55 from $1.
๐น Retraced ~98%, bottoming at $0.985 within 16 months.
๐น Retail sentiment: โLTC is dead.โ
๐น Smart money quietly accumulated.
Result?
$0.985 โ $9 in 4 months (โ +900%)
Event
BTCUSD โ Demand Zone Reaction & Trendline Reclaim | Bullish Setu๐ Key Highlights
Liquidity grab below previous lows triggered strong bullish momentum.
Clear demand zone reaction with buyers defending the same region multiple times.
Price has reclaimed the ascending trendline, showing a potential shift in short-term structure.
Now sitting in the retest zone, aligned with intraday support.
๐ฏ Trade Plan
Entry Zone: Retest of the trendline + support cluster
Invalidation: Below the demand zone (~$84,600)
Targets:
TP1: $93,200
Final Target: $94,000 suppl
Inverted Head and Shoulders - Bullish Setup๐ Overview
The Inverted Head & Shoulders is a bullish reversal pattern that forms after a downtrend.
It signals that selling pressure is weakening and buyers are gradually gaining control.
The structure has three major lows: Left Shoulder, Head (deepest low), and Right Shoulder โ followed by a breakout above the Neckline, confirming a trend shift to the upside.
โโโโโโโโโโโโโโโโโโโโโโโโโโโโโโโโโโโโโโโโโโ
๐ How the Pattern Forms
1๏ธโฃ Left Shoulder
โข Price creates a swing low, then
XAUUSD Repricing MoveXAUUSD Repricing Move
Gold continues to trade inside a broader corrective cycle, with price action showing a clear transition from prior strength into a short-term distribution phase. The chart highlights repeated breaks in market structure and shifts in order flow, signalling a controlled decline built on institutional rebalancing.
After the recent downside sweep, price is now hovering around a key reaction zone where liquidity has already been absorbed. Sellers dominated the previous swing,
#BITCOIN UPDATE: Structure Still Playing Out Exactly as Mapped#BITCOIN Technical Update: Structure Still Playing Out Exactly as Mapped
CRYPTOCAP:BTC has now broken below the $90K zone, a level not seen since 22 April 2025, Seven months ago.
I told you this when Bitcoin was rejecting $115K, and weโre now ~22% down from that zone.
Price is following the structure with precision.
Key observations:
๐ป BTC currently sits on the 0.618 FIB: High-probability bounce zone.
A relief move into the $98Kโ$100K region is very possible in the coming days.
๐ผ Upside FVG
Warning: $ETH Is About to Hit Its Most Critical Zone of 2025!Warning: CRYPTOCAP:ETH Is About to Hit Its Most Critical Zone of 2025!
Macro Structure
ETH remains macro bullish, currently in a healthy correction after rejecting the premium zone near $4,960.
The strong displacement from $1,577 (0.618 Fib) confirmed bullish structure, but price is now retracing into discount levels.
Key Fibonacci Levels
Measured from $879 โ $4,960, ETH is deeply entering ICT discount territory:
0.382 โ $3,048 (Tested)
0.500 โ $2,622
0.618 โ $2,256 โ Top probability zone
0.
EURUSD โ Bullish Setup Toward 1.16EURUSD โ Bullish Setup Toward 1.17
EURUSD is showing strong signs of a bullish reversal after an extended period of downside movement. The 3H chart highlights several Market Structure Shifts (MSS) and Breaks of Structure (BOS) suggesting that bearish momentum is fading and buyers are regaining control near the 1.1500 demand zone.
The price is forming a solid accumulation base, indicating that smart money may be positioning for a move higher. A clean break above the 1.1680โ1.1730 resistance are
XAU Empire | Bullish FlowXAU Empire | Bullish Flow
The market maintains a bullish structure after confirming a break of structure (BOS). Price is currently retracing into a short-term demand zone near 4,100, showing healthy correction within trend. This zone is acting as accumulation before potential continuation.
Momentum supports a move toward 4,316 โ 4,386, aligning with unfilled imbalance and previous supply area. Institutional flow remains on the buy side as long as price holds above 4,080.
---
Market Bias: Bu