Axis Bank โ Monthly Chart Analysis short opportunity๐ Axis Bank โ Monthly Chart Analysis
Potential Short Opportunity
Double Top Formation:
Price has formed a clear double top pattern near the โน1300โโน1350 zone, indicating strong resistance.
Bearish Divergence (RSI):
Momentum indicator (RSI) is showing lower highs while price formed higher highs โ a classic sign of weakening bullish momentum.
Evening Star Pattern (Monthly):
A confirmed evening star candlestick pattern on the monthly timeframe strengthens the probability of a medium-term reversal.
Bullish Butterfly
NIFTY50 // BULLISH ENGULFING // 4HR TFHey folks,
I am looking here at the 4hr TF of Nifty 50 with EMA 50.
A visible Bullish engulfing on the 4hr tf has formed today above 50EMA, confirming the support of the moving average.
I know it is not a perfect bullish engulfing some of you might say, because of current 4hr candle open was not below previous one close. But in Chart analysis there is a rule that you to be versatile and flexible regarding these patterns, so it can be said that the two said price points are marginally close
PCBL: Reversal Structure and Key LevelsThe stock of PCBL has experienced a significant decline from the โน437 level, followed by a notable recovery from a major support zone, often referred to by traders as a discount or value area. Recent price behaviour indicates the possibility of a trend reversal supported by multiple technical factors.
After a prolonged down move, the stock has reacted strongly from a key bottom support level.
On the weekly chart, the formation of an inverted hammer at this zone adds weight to the expectatio
XAUUSD โ Historic Volatility Doji at 1.618 | Exhaustion SignalXAUUSD โ HTF Exhaustion at 1.618 | Major Volatility Signal Formed
GOLD HAS PRINTED ITS BIGGEST DOJI IN ENTIRE HISTORY OF DAY CANDLE NEARLY 490$ FROM LOW TO HIGH AND ENDED WITH INDECISION. LETS SEE WHAT HAPPENS NEXT . WAIT FOR LOW AND HIGH OF DOJI.......?
Gold has reacted precisely from the 1.618 Fibonacci extension zone (~5600), where price printed a high at 5597.04 and faced strong rejection.
The current Daily candle is forming an exceptionally large indecision candle (Doji-like structure) a
SUPREMEIND โ STWP Equity Snapshot ๐ SUPREMEIND โ Technical & Educational Snapshot
Ticker: NSE: SUPREMEIND
Sector: ๐งช Chemicals / Plastics
CMP: 3,500.80 โฒ (+4.15% | 22 Jan 2026)
Learning Rating: โญโญโญโญโ (NeutralโRange with Recovery Bias)
Chart Pattern Observed: ๐ Range Structure with Recovery from Demand
Candlestick Pattern Observed: Bullish Engulfing
๐ Technical Snapshot
SUPREMEIND is attempting a short-term stabilisation after a sharp corrective phase, with the latest daily candle showing a strong bullish response from lower dema
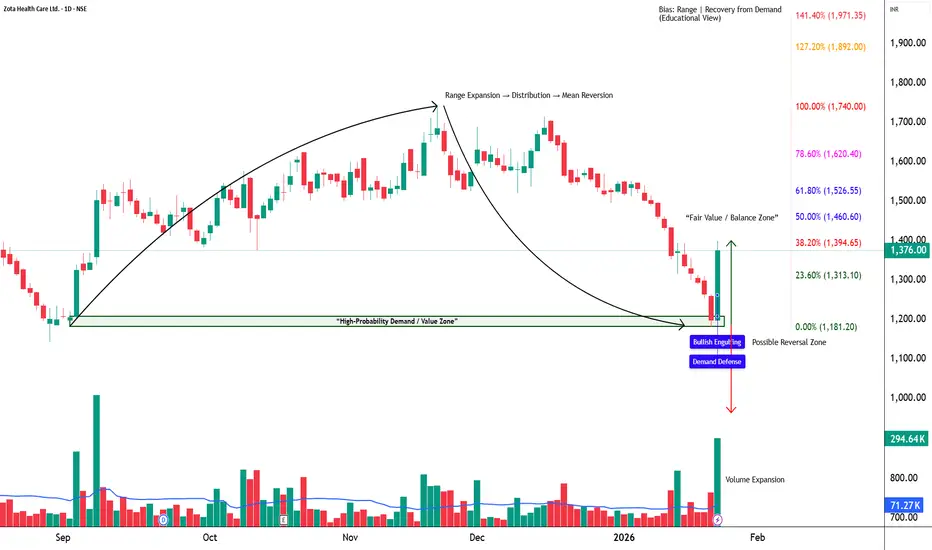
ZOTA - STWP Equity Snapshot๐ STWP Equity Snapshot โ Zota Health Care Ltd
(Educational | Chart-Based Interpretation)
Market Structure
ZOTA witnessed a sharp corrective phase from higher levels, followed by a strong rebound from a well-defined demand zone. The recent candle stands out as a decisive bullish reaction, indicating aggressive buying interest after prolonged selling pressure. Despite the strength of the bounce, price is still trading within a broader range, and the larger trend structure has not yet shifted into
PGIL - STWP Equity Snapshot
๐ STWP Equity Snapshot โ PGIL (Pearl Global Industries Ltd)
(Educational | Chart-Based Interpretation)
Market Structure:
Price fell sharply from the recent high and moved into a known demand zone where buyers usually step in. From this area, buying interest appeared, highlighted by a bullish engulfing candle. This shows that buyers are active and willing to defend this level. However, price is still moving inside a broader range, so the overall trend has not yet changed. Strength is visible
MOTILALOFS - LongIn this chart, price has formed a lower low near the support zone, but RSI has made a higher low. This is called positive divergence and it shows that selling pressure is weakening even though price dipped. It often appears near the end of a down move.
Near the same area, a Morning Star pattern is visible. First, there is a strong red candle showing panic selling. Then a small candle appears, showing indecision. Finally, a strong green candle closes well into the body of the first red candle, i
OFSS - STWP Equity SnapshotSTWP Equity Snapshot โ OFSS (Educational | Chart-Based Interpretation)
๐ Intraday Reference Levels (Structure-based)
Reference Price Zone: 7,841
Risk Reference (Structure Invalidation): 7,432.87
Observed Upside Zones: 8,330.75 โ 8,657.26
๐ Swing Reference Levels (Hybrid Model | 2โ5 days | Observational)
Reference Price Zone: 7,841
Risk Reference (Structural Breakdown): 7,324.35
Higher Range Projection (If structure sustains): 8,874.29 โ 9,649.27
Key Levels โ Daily TF
Support: 7,643 | 7,455 | 7,
Trent (W): Bullish Reversal, Trend Reversal at Major SupportTimeframe: Weekly | Scale: Logarithmic
The stock is staging a classic reversal after a brutal 2-month correction. The "Morning Star" and "Hammer" combination at the 200-day EMA equivalent support signals that the "Panic Selling" is over and "Smart Money" accumulation has begun.
๐ 1. The Fundamental Catalyst (The "Why")
The reversal is driven by a shift in market perception:
> Valuation Comfort: After correcting ~50% from the top, the stock's valuation has cooled off significantly, attrac
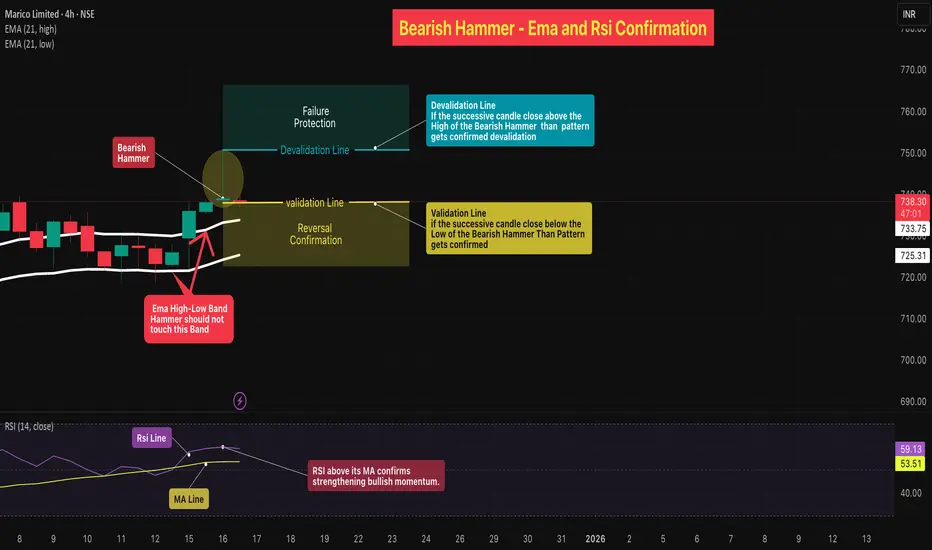
Bearish Hammer - Ema and Rsi Confirmation๐ Overview
The Bearish Hammer with EMA and RSI Confirmation is a structure-based reversal setup that focuses on price rejection at higher levels, supported by EMA positioning and RSI behavior. This setup helps filter weak candles and highlights situations where selling pressure begins to emerge after an upward move.
โโโโโโโโโโโโโโโโโโโโโโโโโโโโ
๐ EMA & RSI
EMA (Exponential Moving Average)
โข EMA represents short-term price balance and dynamic support/resistance.
โข The EMA HighโLow Band d
#ADANIPOWER โ Double Top Danger Zone!๐โก #ADANIPOWER ๐จ
ADANIPOWER has formed a monthly double top ๐ near the 179โ183 (ATH) zone and is now slipping toward its rising trendline ๐
Price is also trading inside the September monthly candle (182.70โ120.00). MCB or sustained close below 120 will signal major weakness โ ๏ธ๐
If selling continues, price may head toward 112.50โ124, 92โ96 , and the breakout retest supports at 83โ87 .
Bulls must defend the trendline to avoid a deeper correction ๐ก๏ธ๐ฅ
Resistances: 151.20 / 179โ183 (
GSLSU: Trend Reversal Signals The stock of GSLSU has been in a sustained downtrend since May, revisiting its discount zone multiple times. However, recent price action suggests a possible shift in sentiment. On Friday, October 17, the daily chart printed an inverted hammer candlestick, a pattern often interpreted by technical analysts as a potential bullish reversal signalโespecially when supported by volume and other indicators.
The inverted hammer on the daily timeframe may indicate buying interest at lower levels. This
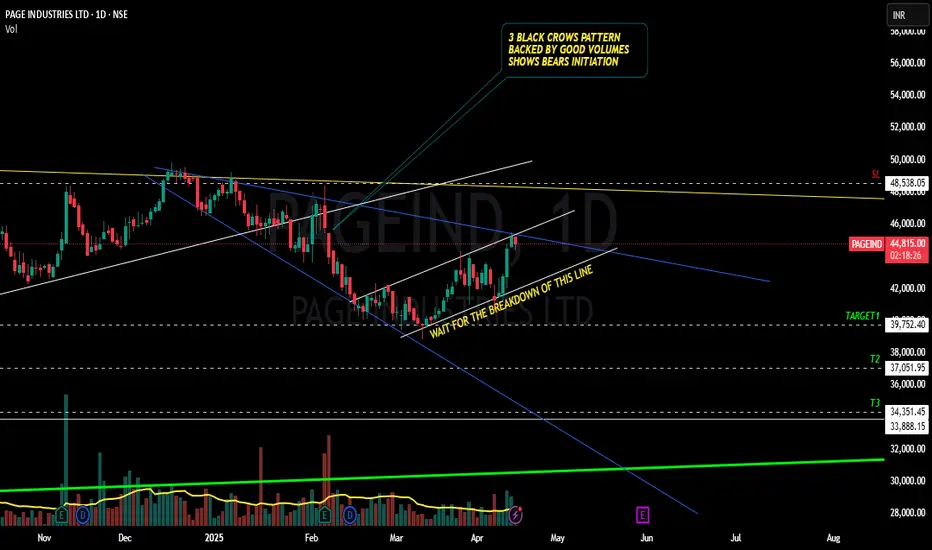
PAGEIND - BEARS READY TO TEAR JOCKEY DOWN TO 20% FALL???YES!!!!! Chart patterns made me think of the above titled opinion.
REASONS FOR MY IDEA
1.MONTHLY CANDLE BREAKDOWN WITH GOOD VOLUME
2. OCT 2022 Highs not tested even during 2024 bullish phase shows weakness
3. Weekly candle too shows a voluminous breakdown as shown below
4. 3 BLACK CROWS pattern in the daily time frame recently adds to the woes
5. I will mostly wait for the white trendline break for the entry.(though it is now at the resistance trendline , recent bullish candles may delay the
#UNIVPHOTO: Reversal Alert at Falling Channel Midline!CMP: 286
UnivPhoto found support โ
& bounced strongly off the mid-line of the falling channel (245โ266 zone), forming a textbook Morning Star on the weekly chart โ a classic bullish reversal! โญ๏ธ๐ฅ
Now testing key resistance 310โ337 + downtrend line. A breakout could fuel a rally to 484 โ 747/818 โ 988 (ATH) ๐๐
Could this be the end of the multi-year downtrend? Watch closely! ๐โจ
#UNIVPHOTO #MorningStar #CandleStickPattern #PriceAction #LongTerm #Investing
๐ #Disclaimer: This analys
Premier Polyfilm Ltd โ Inverted Hammer Reversal at Key SupportStrong Bullish Candle After Multi-Month Downtrend
Premier Polyfilm has printed a bullish Inverted Hammer at a major support zone after a prolonged decline โ a classic early reversal signal on the weekly timeframe. The stock has been falling consistently for months, and this weekโs sharp +12% bounce shows strong buying interest returning near the demand zone of โน34โโน36.
Price is now closing above the minor resistance zone (โน40โโน43). If sustained, the stock may attempt a short-term trend reversa
$NVDA โ Weekly Bearish Signal Triggering?CMP: $184
NVDA has formed a Bearish Engulfing on the weekly chart and is currently trading inside the engulfed candle.
A WCB / sustained break below $178.91 will confirm the pattern โ likely dragging price toward $164 and the major $153โ$148 breakout-retest zone . ๐ป
A WCB above the ATH $212.19 will invalidate the pattern and signal a fresh uptrend. ๐
๐ Note: Q3 earnings to be announced post-market. ๐
Bias: Short-term bearish, HTF bullish if $148โ$153 holds. ๐
#USMarket #NVDA
$Gold: Breakdown or Bounce?๐ป #Gold Breakdown or Bounce? ๐บ
Price tested a critical level (upward sloping trendline - Breakdown Retest ) after a bearish engulfing and is now pulling back. Will the breakdown continue, or can bulls reclaim control? ๐
Trendline break ๐จ
Breakdown retest โ ๏ธ
Key levels to watch:
๐ง Resistance: $4099.40 - $4126.08 / $4185.91 - $4195.21 / $4355.80 - $4381.44
๐ก Support: $4024.53 / $3932.10 - $3930.62 / $3953.00
Below $3953 โ opens downside toward $3500.20โ$3432.84 ๐
Between ATH &
#Silver Alert: Double Top Breakdown Incoming?๐จ Double Top on XAGUSD daily chart:
1๏ธโฃ First Top: Bearish Engulfing
2๏ธโฃ Second Top: Dark Cloud Cover
Pattern confirms DCB ๐ป below $45.55 , ๐ฏ targeting $36.71 .
๐ง Resistance: $52.32 - $54.49
๐ก Support: $50.62, $49.38 - $48.91, $47.17 - $46.90
โ ๏ธ Major sell-off potential. Longs only above Double Top high after 2 consecutive closes.
#Silver #XAGUSD #DoubleTop #TechnicalAnalysis #BearishReversal #ChartPatterns #CandlestickPatterns #PriceAction
๐ #Disclaimer: This analysis is