Bullish Cypher
visa and bollinger band Bollinger band suggest the counter is ready to make a breakout
multiple times respected bollinger band earlier as shown in the chart.
the counter in past have seen support from mid or lower band
while resistance at the upper band along with retracements at mid band when in uptrend.
which sugest the counter is a good candidate to play via BB
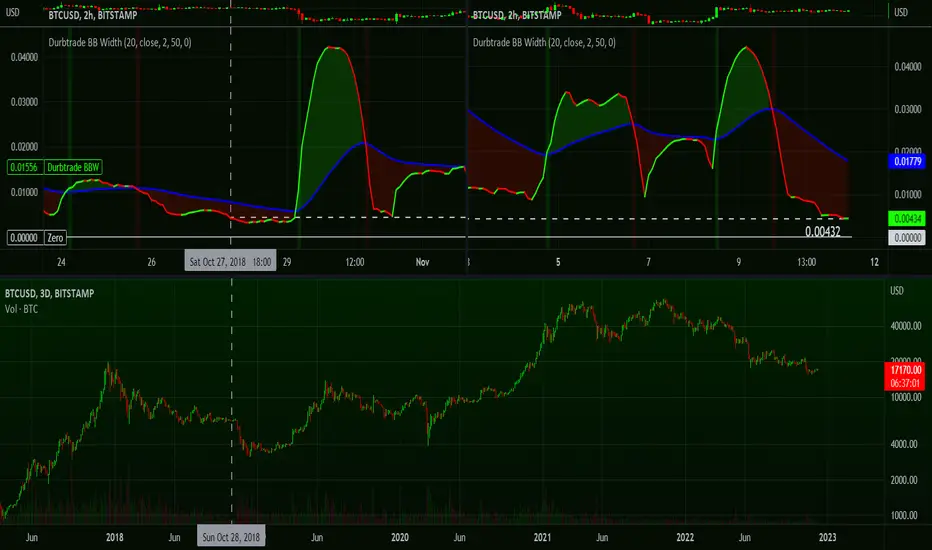
BTC : 2hr Bollinger Band Width lowest since October 2018Bitstamp BTC 2hr Bollinger Band Width printed a drop to 0.00432 just now... lowest point since October 2018.
Top left chart shows 2hr BTC BBW in October 2018.
Top right chart shows 2hr BTC BBW at present.
Bottom chart shows BTC price action since October 2018 on the 3day.
// Durbtrade
$SHIWETH Shina InuSHI Price Live Data
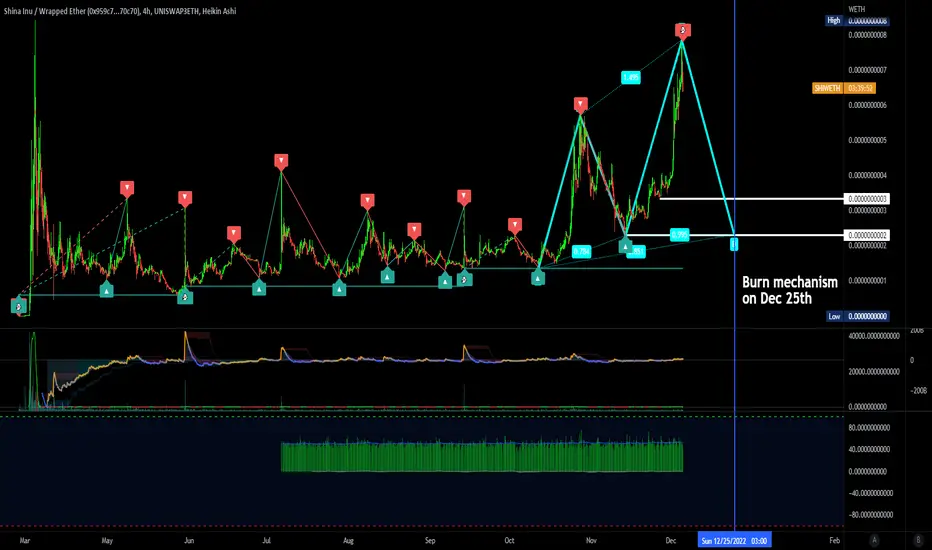
The live Shina Inu price today is $8.05e-7 USD with a 24-hour trading volume of $1,075,646 USD. We update our SHI to USD price in real-time. Shina Inu is down 2.27% in the last 24 hours. The current CoinMarketCap ranking is #2732, with a live market cap of not available. The circulating supply is not available and a max. supply of 20,000,000,000,000 SHI coins.
If you would like to know where to buy Shina Inu at the current rate, the top cryptocurrency exchanges for trading i
SLong
ARUSD: Bearish 3 Line Strike and a Close Above the 0.786 RetraceArweave today has simultaneously closed above the 0.786 retrace and has taken out the last 3-4 Days of Bearish Price Action on the Daily Timeframe.
We may also be at the PCZ of some sort of Deep Cypher Pattern; it can't be a Shark because the 1.618 Extension is nowhere near being reached so i think it's a Deep Cypher.
DODG - Round 2?DODG looking like it may want to squeeze up more soon. Regression trend down off the recent high showing the potential for a reversal back to the upside with fairly strong divergence off the regression channel midline. BBs have gotten tight again on the 4-hour and shorter timeframes indicating a directional change. Volume appears to be swinging back to bullish. DODG is not oversold on the daily chart. Will look for confirmation of the move and add (or not) based on direction.
With lots of
DLong
UNISWAPHello Dear friends
Aren't decentralized exchanges more attractive?
All patterns formed in different time frames identify higher targets. Our support areas have been well maintained so far.
Provided that the orders in the area of $5.65 are not fully consumed, the possibility of continuing the upward trend to the area of $7.17 is high.
Keep in mind that this view has little validity until the bullish trend breaks above the $6.38 range.
We would be happy to hear your comments
TOTAL Crypto Market Cap Bullish ABCD and CypherThe TOTAL Market Cap looks to be ready to target back up to $2.16 Trillion Dollars from here in the coming Weeks-Months based off the presence of a Bullish Cypher and Bullish ABCD Confluence Zone Visible on the Weekly Timeframe.
The ideas in the Related Ideas Tab below are also relevant to this analysis of TOTAL.
closing all shorts, waiting for 3860 retest from D leg of cypherlooking at the 1hr time frame on spx, I'm seeing the bullish cypher. from d leg the target is 3860 or b leg of the bullish cypher. if there is enough momentum it can be carried to the 3900 of this pattern.
This is not trading or financial advice. im simply trading and reacting to the market. I'm using tradingview as my trading log, but im more than happy to share my views. Just be respectful.
EURGBPHi traders, EURGBP is setting up for a downside possible move watch price to go our mentioned pattern completion area and look price action on the top for a short position opportunity if price break 0.85786 level without hiting our mentioned pattern completion area then this setup will be invalidate.
Trade with your own strategy GOOD LUCK.
BTC Bullish Cypher Update #3: A Falling Wedge AdditionSince first identifying this Cypher on the weekly I have noticed that BTC seems to have been trading within this huge Falling Wedge and now this week after bouncing up from a much Smaller Daily Timeframe Bullish Shark for the second time, it is attempting a weekly Breakout of the more prominent Falling Wedge.
The Measured Move for this wedge breakout would be around a $29,580 upside move to which would take us very close to the 61.8% Retrace from high to low at $49.6k.
We currently have Multi
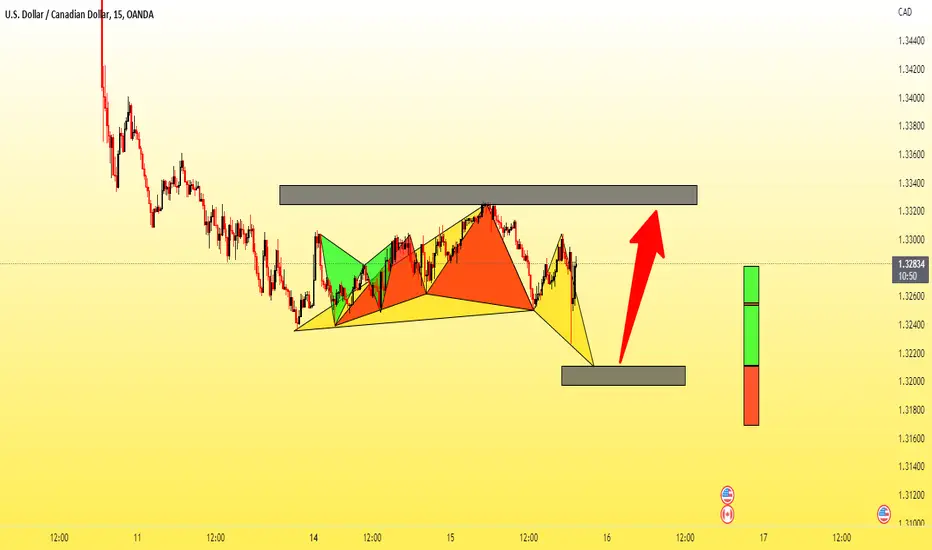
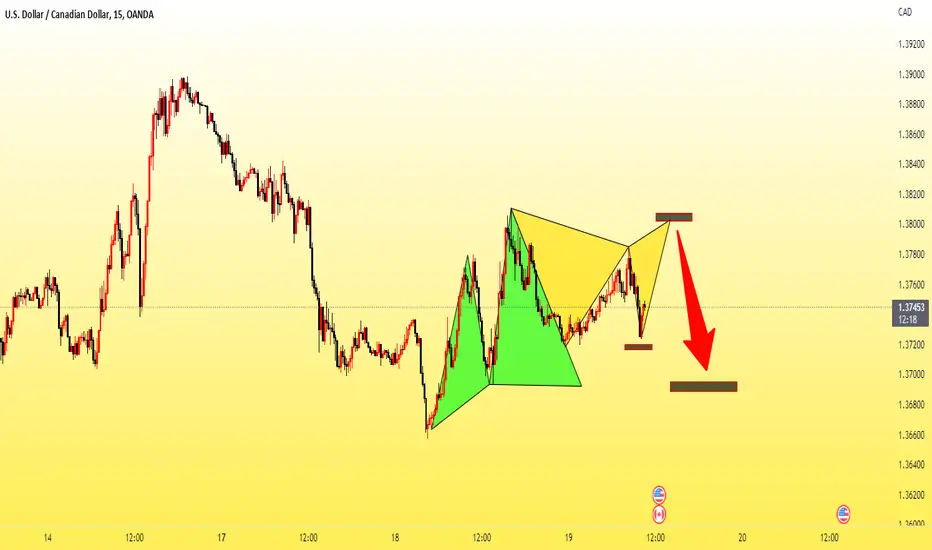
USDCADHi traders, i am looking it the USDCAD chart if price go back our mentioned pattern completion area then i will be looking price action again for a short position opportunity, if price drop from the current area and break 1.37184 level without hiting our mentioned entry level then this setup will be invalidate.
If you are taking this trade so please i request you trade with your according strategy do not depend on my analysis, this analysis is just a scenario and i would love to be wrong GOOD LU
Bitcoin bullish based on HarmonicsBitcoin printing a bullish cypher harmonic pattern on HTF charts. Usual Cypher targets marked in green but I am more inclined into using harmonic patterns for trend reversals and determining my overall market bias / sentiment.
Not expecting any impulsive moves but I believe we have reached the bottom (or that the bottom is very near) with $BTC and we will start ranging for a bit to fuel the move to the upside.
Check linked idea for LTF scenarios for Bitcoin.
ADAUSD: Trading at Harmonic Levels of ConfluenceADA Right Now is Trading at the PCZ of a small Bullish Gartley(The Harmonic furthest to the right) and a Bullish Cypher(The Harmonic in the Middle) and A Shark(The Biggest one to the left) Usually ADA tends to lag after XRP so as long as BTC holds these levels we should be able to see ADA break above the trendline from here in the coming weeks or atleast test the trendline and if ADA Breaks the Trendline i'd expect to see it get bought up to the next maor resistance at 89 Cents.
The trendline m
BTCUSD: Bullish Cypher at Weekly Support Congestion ZoneBTC leading to the Fed SPeaking in the 21st may see a rally from the Support Zone it's been trading within. It formed this Bullish Cypher/Shark on the Daily and rallied about 61.8% of the way before failing and pulling back down again. This sorta action is very dangerous as it makes me think it could be a Bearish 5-0 that could lead to us making a lower low and if we do that we will likely come back down to atleast the 786 retrace below at 17.8k. But as of right now the move down to PCZ of this
Beat the BATS - Harmonic Bat PatternsHi Traders, Investors and Speculators 📉📈
Ev here. Been trading crypto since 2017 and later got into stocks. I have 3 board exams on financial markets and studied economics from a top tier university for a year. Daytime job - Math Teacher. 👩🏫
In today's analysis, we'll look at a different way to speculate the next immediate price action of an asset : the Harmonic Bat Patterns. There is a really cool tool on the platform that you can use called the Cypher Pattern, you can find this in your d