AUDUSDThere is reversal pattern of Double Bottom have bullish divergence also. So we wait for the breakout of the neckline then take buy entry. Longby AlamdarHaider0
NZDUSD ChartTrend Bearish Divergence Bullish Bullish Reversal Pattern Sentiments Also Bullish Trade Plan After confirmation of Trend Reversal.Longby AlamdarHaider13
AUDUSDThere is Bearish trend but we found Bullish Divergence and also Falling Wedge reversal Pattern. So, will take entry when the reversal will be confirm when it will break the last LH.Longby AlamdarHaider1
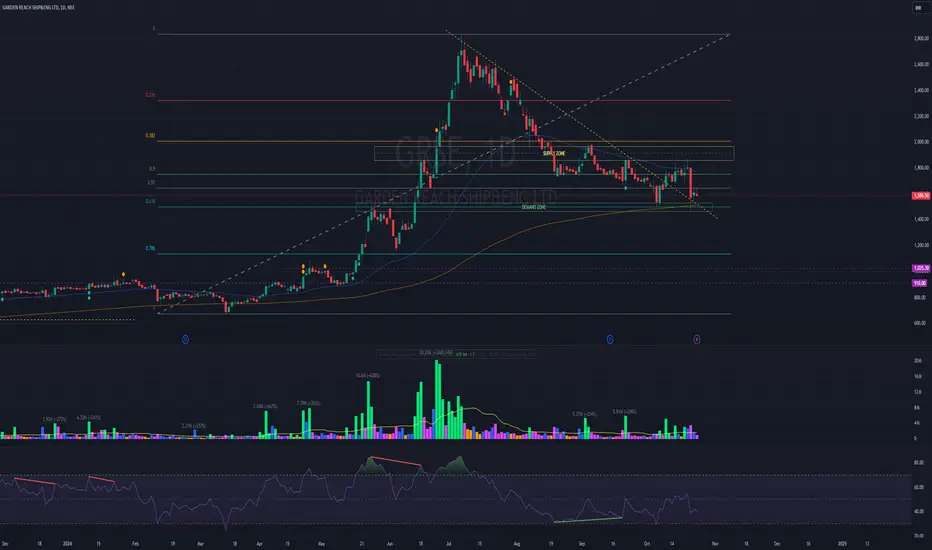
2 logicPrice is taking support from demand zone and taken support twice from 200ema. Trend line breakout with retest successfully. After trendline breakout volume spurt in daily time frame. Bullish divergence in daily timeframe. Fundamentals are OK. Check Fib in weekly time frame. NOTE: I do my analysis, do yours before trade. Eat🍜 Sleep😴 TradingView📈 Repeat 🔁Longby GreyandWise22
BOME Long Position (Retest of 21-day EMA)Market Context: BOME is approaching the 21-day EMA after a Market Structure Shift (MSS). We're looking for a retest of the trend to form a higher low, while sweeping liquidity at the $0.075 level. This provides a potential opportunity for entry. Trade Setup: Entry: $0.007 - $0.008 Take Profit: First target: $0.012 Second target: $0.016 Third target: $0.020 Stop Loss: Daily close below $0.006 This setup seeks to capture the bounce from the higher low, capitalizing on the anticipated continuatiLongby Richtv_official11
NZDUSD ChartNZDUSD Chart There is Bearish trend. Now, bullish divergence formed also have the Bullish falling Wedge Reversal pattern. So, will take buy entry at the breakout of last LH.Longby AlamdarHaider5
EURUSD ChartEURUSD Chart The pair is in Bearish Trend Forming series of LL's & LH's. On RSI there is Bullish divergence and also Bullish reversal Pattern of Double bottom. Will wait for BOS If the LH (1.09560) breakout then take buy trade SL on (1.08960). Do your own research before taking the Trade.Longby AlamdarHaider2
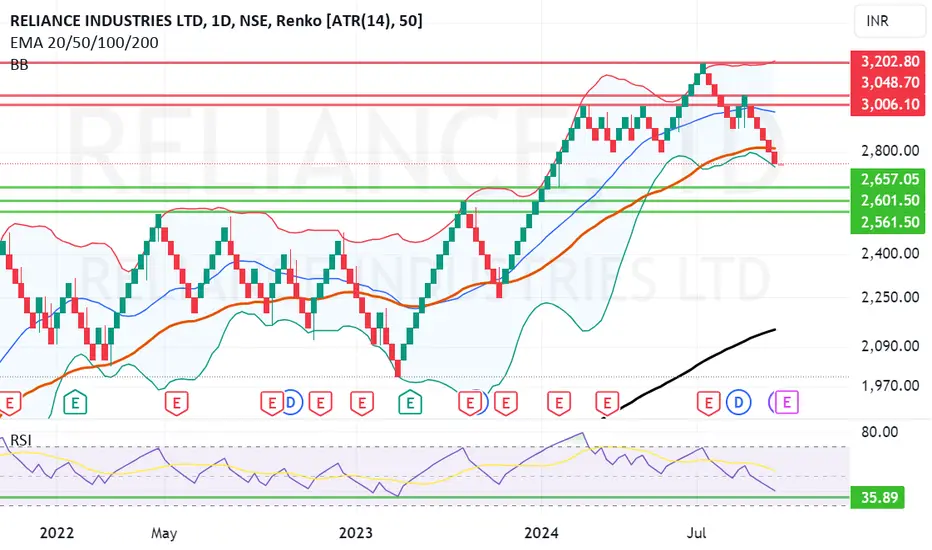
Understanding the Renko Bricks (Educational Article)Today we are going to study a chart which is called a Renko chart. Renko chart is a chart which is typically used to study price movement. I use Renko chart many times to determine supports and resistnace. I find it easy and accurate way of determining supports and resistances. The word Renko is derived from Japanese word renga. Renga means brick. As you can see in the chart below it shows a kind of Brick formation. The brick size is determined wither by the user and mostly it depends of typicEducationby Happy_Candles_Investment14
GBPUSD Oct 8th Analysis Pennant/Falling wedge30 min reversal pattern Falling Wedge with bullish divergence 5 min bullish pennant. Expecting 100 pip move near 1.32000 area.Longby JasonFosterII0
BTC reversal soon??Divergences between price and RSI can often show that a trend is coming to an end and a new one is beginning. In this case we can see that RSI on the 4H timeframe hit the oversold zone, and has been steadily climbing out of it ever since. However, we can see that price has continued making lower lows and lower highs... The price and the oscillator are out of phase and in this case as RSI grows larger but price continues to drop it's a bullish divergence signal and this suggests a trend shift froby ProR353
The last bullish chance of BITCOIN in short-term !!BTC is attempting to break through resistance of ascending triangle pattern after bouncing off support. Wait for a decisive breakout above the ma 200 to confirm the continuation of the bullish trend . Up we go if we do breakout , also a bullish hidden Divergence (HD+) on MACD which shows Positive Signs for BTC. The price can increase as much as the measured price movement ( AB=CD ) . The break out needed for increasing further has not happened but it should happen pretty soon. ✨Traders, if youLongby CobraVanguardUpdated 75
EGLD Outlook after the Dip. What to expect NOW ?BINANCE:EGLDUSDT EGLDUSDT is forming a falling wedge on Daily timeframe , Up we go if we do breakout. According to Elliott's theory, the double combo waves have ended and it means that the price can increase. Also a bullish Divergence (RD+) on MACD which shows Positive Signs for EGLD. ✨Traders, if you liked this idea or have your opinion on it, write in the comments, We will be glad. _ _ _ _ __ _ _ _ _ _ _ _ _ _ _ _ _ _ _ _ _ _ _ _ _ _ _ _ _ _ _ _ ✅Thank you, and for more ideas, hit ❤️Longby CobraVanguardUpdated 150
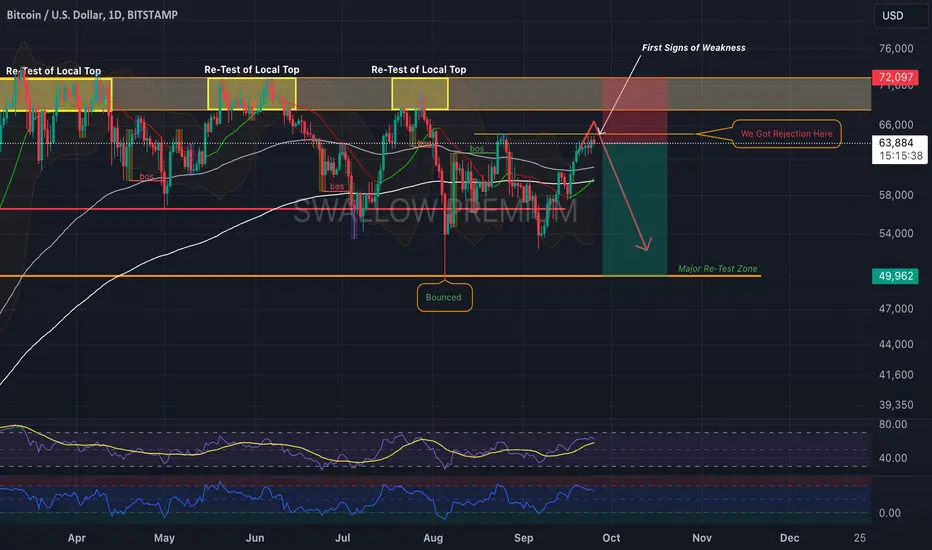
Bitcoin (BTC): Slowly Starting To Look For Short!Bitcoin on a daily timeframe has fully secured the EMAs as of now and now price is testing that smaller rejection zone. So far our gameplan remains the same and we are looking for a full switch of trends, which would result only after seeing some kind of strong rejection from the current zone or upper resistance zone so we keep an eye on candle movements to catch any possible confident move! Swallow Team Shortby SwallowAcademy17
BTCUSDT RSI EMA VWMA Signals with Profit Target for CryptohopperThis strategy combines the Relative Strength Index (RSI), Exponential Moving Average (EMA), and Volume Weighted Moving Average (VWMA) to create buy and sell signals, along with a profit target, for cryptocurrency trading. It is specifically designed for use with Cryptohopper through webhook alerts. How It Works: Buy Signal: A buy signal is triggered when the RSI crosses above the lower threshold (user-defined) and the 9-period EMA is above the 20-period VWMA. Sell Signal: A sell signal is trigLongby PPonBIN7
SPY regains but still in bearish zoneSPY bounces back after Friday sell off, still inside downward trend comparing against 1h and 2h timeframe we see that ema remains below sma for both This also holds true for RSI between 1 and 2h. RSI remains remains below sma stock remains inside the downward trend after bounce back SPY still shows signs of bearishness and more selling to come. Not looking like we are out of the woods yet.Shortby ratchet-mint10
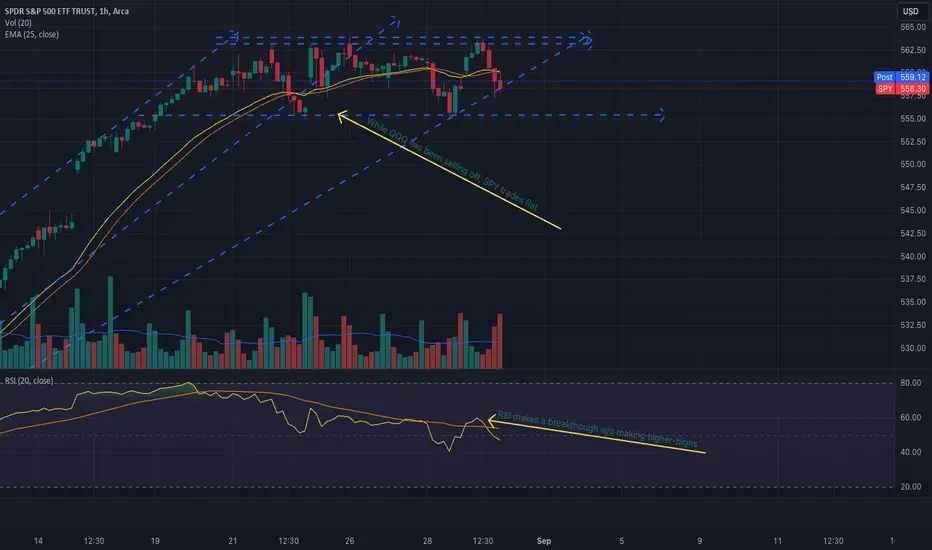
SPY holds steady while QQQ sells offDuring the past week, SPY and QQQ have diverged in their paths QQQ slowly and steadily sold off SPY traded flat during that time This indicates that the sell off in QQQ was primarily tech driven and did not spread to the rest of the industries other industries look to be holding stable by ratchet-mint1
QQQ shows a reversal is nearQQQ experienced a number of turning points showing increased weakness in the sell off we have been seeing over the past week. False breakout to the upside Strong growth in volume confirming the breakout direction Hammer candle on close indicating reversal maybe coming after later day retracement RSI breaks above SMA line for first time This change in direction we have seen today with a new interest from the bulls shows that ever selling we experience going forward will likely be by ratchet-mint8
Nano [XNO] bullish divergenceNano is showing bullish divergence on a higher timeframe. My expectation is that downtrend which started since ATH will be reversed soon. Similar bullish divergance pattern appeared with previous bullrun when and BINANCE:XNOBTC pair gained about 500%. Price action since ATH seems corrective (three wave move), which indicates a new impulsive wave could exceed ATH.Xby priv3e24
NOTHING !!KUCOIN:GTAIUSDT The price is in a megaphone, and now the price is on the bottom of Megaphone, and this means that the price can grow to the top of the megaphone. Also bullish divergence increases the chance of this signal. ✨Traders, if you liked this idea or have your opinion on it, write in the comments, We will be glad. _ _ _ _ __ _ _ _ _ _ _ _ _ _ _ _ _ _ _ _ _ _ _ _ _ _ _ _ _ _ _ _ ✅Thank you, and for more ideas, hit ❤️Like❤️ and 🌟Follow🌟! ⚠️Things can change... The markets are alwaysby CobraVanguard43
#EURGBP buying opportunityAs can be seen in the chart, the price appears to have completed a bearish corrective move, signaled by a change in market structure to the upside and the formation of a bullish divergence. Now, we could look for buying opportunities during minor bearish corrections.Longby mohemati10
BTC 1D OUTLOOKBitcoin is in a tricky place right now. The fear and greed index has cooled off massively and now sits at a neutral score of 55. General sentiment is very poor and after nearly 2 months of sideways action traders/investors are getting restless especially after the promise of price rally post-halving, but is there any positive news? The chart is pretty clear, HTF is bullish, still above the 1D 200EMA but LTF is bearish. BTC has clearly broken its uptrend and is now in a bearish trend channel, alby ProR35Updated 333
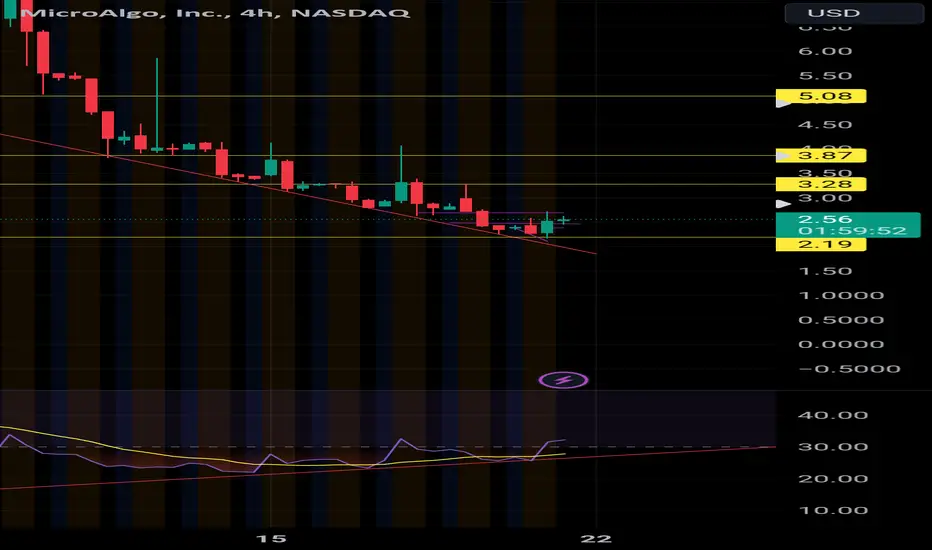
MLGO BULLISH DIVERGENCEWe had around 15 red days on this one it's pretty oversold, bullish divergence formed and it's overdue for a pump next week Targets: $3.8 and up Fill your bags and wait they gonna pump itLongby Bruce_Wayne_2201199719
I call this the big kahuna - TRACBTCBullish Divergence here..... we are squeezing all sorts of loose and strict... on a 7 day chart we are squeezing long for a very long time... Lets see what 2020 brings for the long forgotten TRACBTC...TLongby bottomshorterUpdated 311
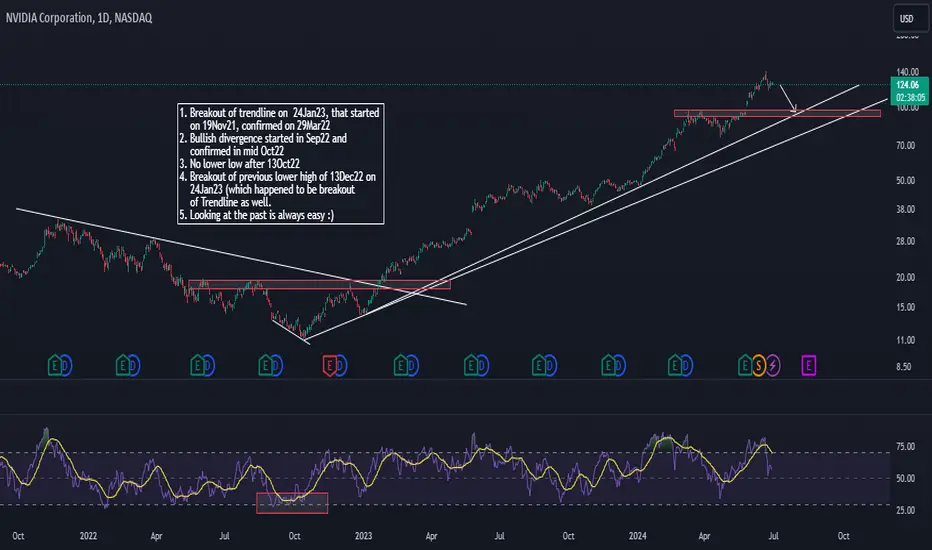
Nvidia : Learning from the pastNASDAQ:NVDA Looking at the past is easy, but learning from it is easier. Let's get listed the points. 1. Breakout of trendline on 24Jan23, that started on 19Nov21, confirmed on 29Mar22; 2. Bullish divergence started in Sep22 and confirmed in mid Oct22; 3. No lower low after 13Oct22; 4. Breakout of previous lower high of 13Dec22 on 24Jan23 (which happened to be breakout of Trendline as well.by wish_fund7

 LongLong
 LongLong
 Long
 LongLong
 Long
 Education
 Long
 Long
 LongShortLong
 Short

 Long
 Long