TSLA: Road to the All Time High.Hello traders and investors! Let’s see how Tesla is doing today!
Ok, so Tesla was added to the S&P 500, and this is giving fuel to the stock right now. In my previous analysis, we discussed Bullish Engulfing , which was our last entry point on Tesla. Now it is too late to buy, but we could see an opportunity here if Tesla does a pullback. And if you missed my previous analysis, the link is below, as usual.
For now, since we are trading around $ 490, I see that a pullback to the $ 462 again
Bullish Engulfing
TSLA: Low volume/low volatility... What to expect next?Hello traders and investors! Let’s see how Tesla is doing today. It’s been some time since my last analysis, so, let me give you guys some updates. And the link to my previous analysis is below, as usual.
First, Tesla is trapped inside what I like to call a Trap Zone , trading above the support at $ 406, but under the resistance at the 21 ema, and the price could breakout to any direction from here.
The support at $ 406 is strong, but Tesla is coming from a clear short-term bear trend. We h
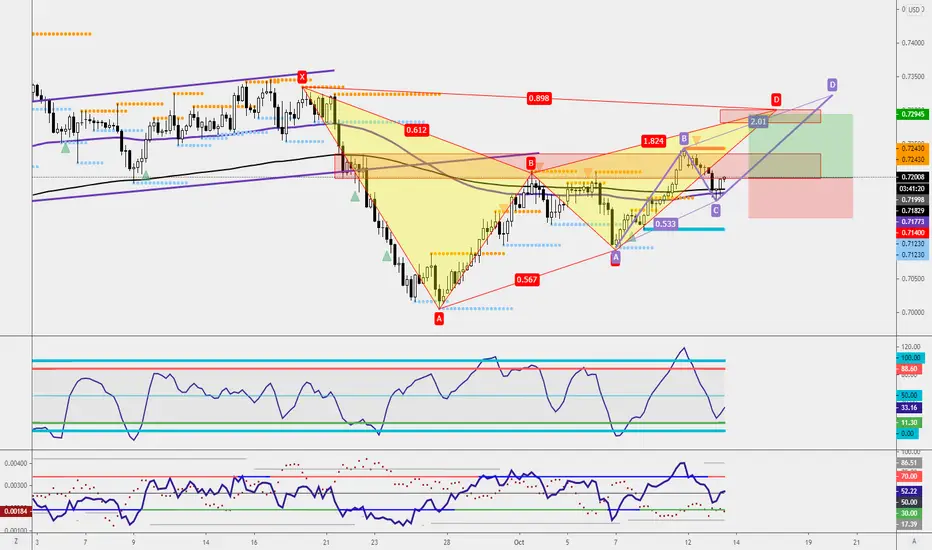
AUDUSD - Moving Averages A structure trade that has a buying opportunity as market pullback 50% on Fibonacci Retracement and it that offers target1 to have 1.5:1. The candle was above both moving averages, and the target1 coincide with the area for potential shorting opportunities of both Deep Bearish Gartley Pattern and ABCD Pattern.
Trade engaged with tight stops.
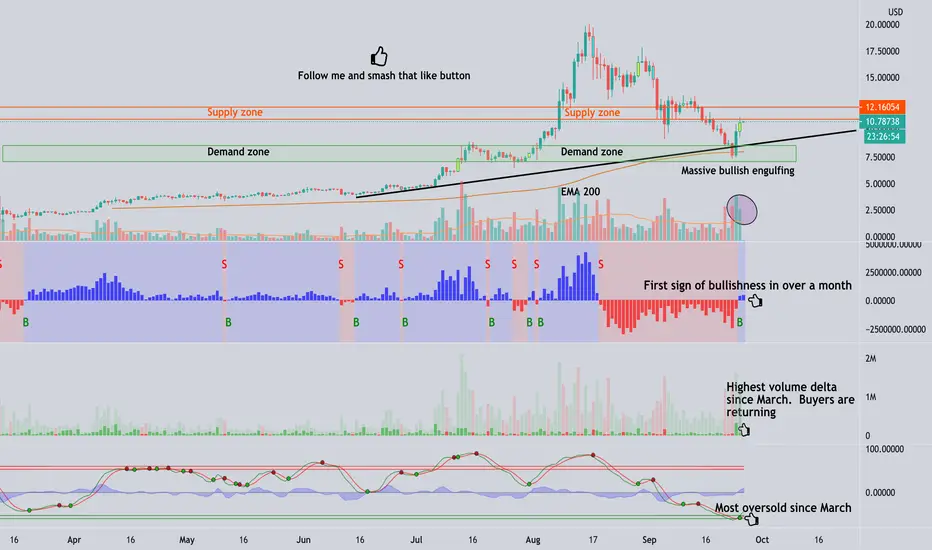
LINK- Massive distribution nears the endAfter the massive distribution and deep correction ended at fib 61.8 and EMA 200, it seems that LINK's buying pressure has returned.
I expect another re-test in the demand zone after the price reaches the supply zone because BTC is still short-term to mid-term bearish.
Bullish Engulfing on important Support levelHello, traders.
The bullish engulfing pattern is a two-candle reversal pattern. The second candle completely ‘engulfs’ the real body of the first one, without regard to the length of the tail shadows. The Bullish Engulfing pattern appears in a downtrend and is a combination of one dark candle followed by a larger hollow candle. On the second day of the pattern, price opens lower than the previous low, yet buying pressure pushes the price up to a higher level than the previous high, culminating
BLong
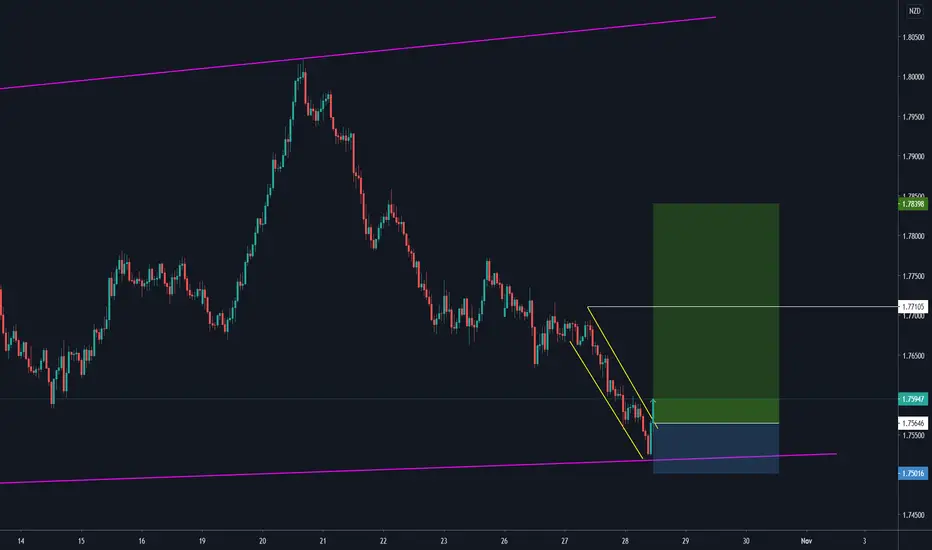
Support Holds With BUEBYesterday we discussed this market and the critical support level price was looking to test on the 4 hour chart. We also discussed the recent higher lows price had been forming.
As the 4 hour chart shows; price has now formed a large bullish engulfing bar at this area and moved back higher.
The recent swing high resistance now comes back into play and is the next major watch for this pair.
ThANKS FOR YOUR LIKE AND SUPOORT....
Silver (XAG/USD) Pieces Through Trend Line - Upside AheadHello Fellow Trader!
Silver (XAG/USD) Pieces Through Trend Line
4 Hour Time Frame: Strong bullish Engulfing pattern at key Fibonacci level and price.
A simple way to find support and resistance in Silver is to plot price intervals of $XX.50 as seen in the labelled examples, and watch and back test price behaviour at these levels for opportunities or clusters with Fibonacci levels or moving averages.
Silver has yet to break its All Time High price while Gold has achieved this milestone.
C
SPX: Bull or Bear trap? Let's see...Hello traders and investors! Let’s see how SPX is doing in this Multi Time Frame Analysis (MTFA)! This could be a bull or a bear trap, and here are the most important points to keep in mind.
We see a Dark Cloud Cover candlestick pattern under the 21 ema in the hourly chart. This is a bearish sign, and today’s rally could be just a short rally to its resistance and start a further drop, especially if SPX loses this red line at 3349, which would trigger a pivot.
Today, SPX filled the gap
XTZ: These are the most important points to keep in mind!Hello traders and hodlers! Let’s what XTZ is doing today and do a complete Multi Time Frame Analysis (MTFA)!
In the hourly chart, Tezos is struggling a lot, as the bears are dominating the crypto. It did lose the purple trendline , which was the first sign the trend was going to get weaker, but now it is doing descending tops and bottoms , a trait of a bear market.
Right now, XTZ is doing what it was supposed to do in a bear market: Seeking previous supports . It is very close to the pink l
Price Flip HoldingWe discussed this market last week and the fact that price was looking to pullback into the major support level and 50% Fibonacci level.
Now price has pulled back into this level we can see a bullish engulfing bar and rejection candles have formed rejecting the support.
As yet there has been little follow through and for a move back into the recent swing high we will need to see the recent daily highs taken out.
Bullish engulfing Yesterday was interesting and with good movements.
This morning we are reviewing the daytime candles for turn signals and one of the options is USDJPY.
Here we have bullish engulfing, which is a signal of an expected rise in price. We expect buyers to be stronger than sellers in the next few days.
We found another very clear signal on the daily chart of one of the main pairs.
Indicate which is it in the comments.
Tomorrow we will analyze it.
USDJPY - Next MoveLooking into the higher time frames we can see that we broke the bullish flag formed and are now sitting around the key level of 105.500 waiting for the markets next move. The last daily candle closure was a bullish engulfing candlestick suggesting price may want to continue up into the key structure marked after making a slight pullback. If we don’t see this and price wants to break the 105.500 level, our long term target will be 101.500 depending on how the DXY performs.
Our most recent COT d
BTC broke out of the downtrendWelcome fellow Tradingviewers,
This analyses is a follow-up from our BTC halving TA and this analyses has proven to be effectious.
If you haven't already consider reading that analyses before going deeper into this one.
In this analyses we are going to show you our view on the current market situation for Bitcoin .
We will be analysing BTC using a top-down strategy , including candlestick patterns , indicators and price patterns .
Monthly:
- The monthly close was a bullish engul
CADJPY H4 ANALYSIS! BREAKING OF EITHER SIDES WILL BE MAJOR! Good day traders! New York market has been opened and I hope y'all have a great trades ahead. Start off with my sharing on CADJPY to give y'all a little heads up on the directions!
CADJPY has been struggling in between the price range of 79.70 to 78.34 for the past few days. Therefore, a break of 78.34 would result in bearish movement to 74.13 (ideally) whereas fail to break below 78.34 would push the price to 81.64, which is the recent high.
Therefore, we will be waiting for the confirmation
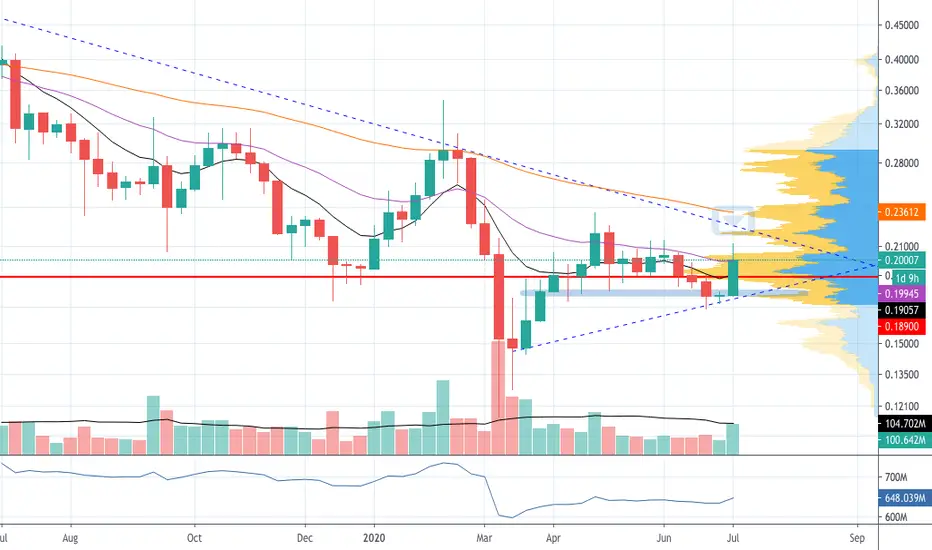
XRP Weekly AnalysisXRP on the weekly chart is still in an overall downtrend but it’s showing bullish signs. Currently trading just around it’s 20ema, also it’s point of control YTD as seen on the volume profile . If we can close above this with above average volume (+104.655M), we can expect more bullish sentiment to follow. I’d be looking to see a brief some resistance around the downward trending tend line and high volume node before resistance around the 50ema
Other bullish signs:
XRP is forming a morning sta
EURUSD - Continuation of a strong trend?EURUSD is in a clear uptrend, with the pair that doesn't seem to show any sign of counter-trend or strong retracement.
Recent action shows a slight retracement, with buyers immediately reacting with a bullish engulfing pattern and a new higher high.
Stop loss below last important swing low and trying to have it also below the uptrend line.
I don't really have a take profit in this situation, I just want to join the trend and see when we have some signs of sellers on the market.
For now, I pla