Nifty Intraday Analysis for 18th August 2026NSE:NIFTY
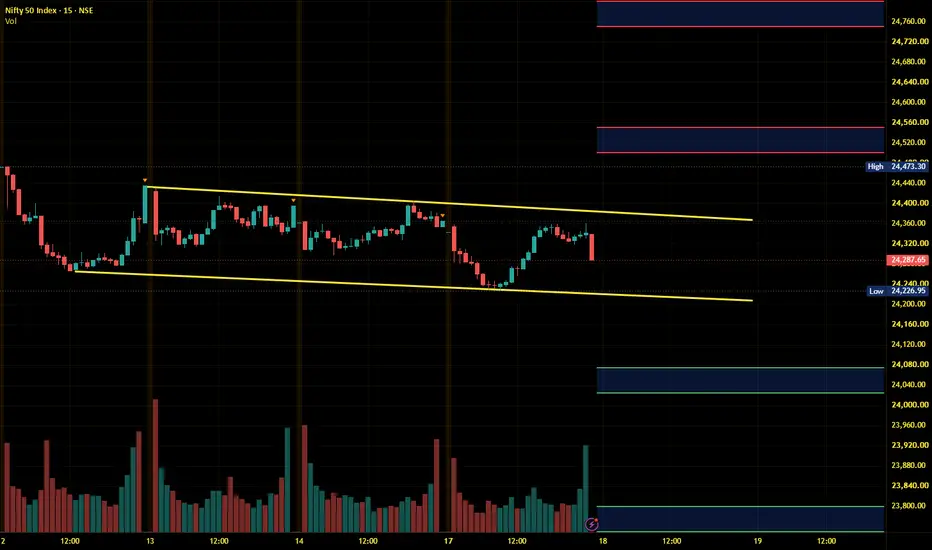
Index will be range bound as long as it is in the 24250 - 24500 range and trend will emerge on either side when index will break the range.
The upward movement may lead to 24500 – 24550 resistance range and if the index crosses and sustains above this level then may reach near 24750 – 24800 range.
On the contrary, The downward moment may drag the Index to 24075 – 24025 support range in downward momentum and if this support is broken then index may tank near 23800 – 23750 range
Bullish Flag
Banknifty Intraday Analysis for 18th August 2026NSE:BANKNIFTY
Index has strong resistance near 58000 - 58300 range and uptrend is expected only when the index breaks and sustains above this resistance range.
The upward moment may lead the Index to 58200 – 58300 resistance range in upward momentum and if the index crosses and sustains above this level then may reach near 58900 – 59000 range.
On the contrary, The downward moment may drag the Index to 56800 – 56700 support range in downward momentum and if this support is broken then the in
Finnifty Intraday Analysis for 18th August 2026NSE:CNXFINANCE
The index is near 26000 support and range bound moment in 26000 - 26500 range expected and uptrend will be formed only when index breaks and sustains above 26500 resistance.
The upward movement may lead the Index to 26475 - 26525 resistance range and if the index crosses and sustains above this level then may reach near 26800 - 26850 range.
On the contrary, The downward moment may drag the to 25950 – 25900 support range and if this support too is broken then index may tank
Midnifty Intraday Analysis for 18th August 2026NSE:NIFTY_MID_SELECT
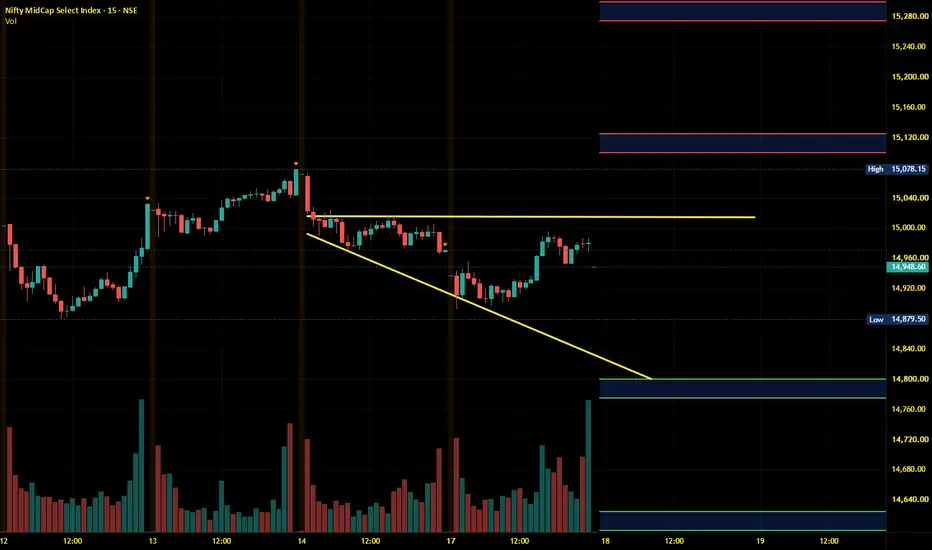
Index has support near 14900 - 14875 range and uptrend is expected to continue as long as the index is above this support range.
The upward movement may lead the Index near 15100 – 15125 resistance range and if the index crosses and sustains above this level then may reach 15275 – 15300 range.
On the contrary, The downward moment may drag the index to 14800 – 14775 support range and if this support is broken then index may tank near 14625 – 14600 range.
UPL - Multitime frame analysisIn a smaller time frame, the price has formed a rounding top pattern. As per the daily chart, the price is testing an important zone at 560. The price will be bearish below that.
Sell below 558 with a stop-loss at 564 for targets at 554, 548, 542 and 536.
This will become invalid if the price closes above 570 with bullish strength.
Always do your analysis before taking any trade.
BAJFINANCE: High-Probability SMC Retest at Demand ZoneNSE:BAJFINANCE
Market Structure & Setup Analysis:
Structure: Bajaj Finance has completed a clean structural breakout above multi-month All-Time High resistance (~₹1,100), sweeping Buy-Side Liquidity up to ₹1,176.4.
Smart Money Concept (SMC): Price is now conducting a controlled pullback into the daily Point of Interest (POI) / Demand Zone spanning ₹1,050 – ₹1,090, which aligns with the 20 EMA retest.
Volume & RSI Confluence: Volume has contracted sharply on the retracement (signalin
EUR/JPY 15M Intraday (18/08/2026) – Retest & Continuation to 185Date: August 18, 2026
The EUR/JPY 15-minute chart displays a decisive bullish market structure, characterized by higher highs and higher lows following a breakout from prior consolidation. Price action reflects strong buying momentum after clearing the key intermediate level at 184.656, rallying upward to test a session high of 184.904 . Buyers remain firmly in control, driving price toward the primary overhead resistance targets marked at 185.056 and the higher supply zone spanning 185.1
CHF/JPY Swing Breakout SetupCHF/JPY is showing a classic swing opportunity with higher lows forming after a sharp drop. Price is approaching the 199.172–200.000 supply zone, with resistance marked at 200.977. A bullish breakout above this level could trigger momentum toward TP1 at 197.309 and beyond. Demand remains strong near 193.000–194.000, providing a solid base for risk management. This setup highlights a clean swing structure with defined entry, stop-loss, and profit targets — ideal for traders looking to capture med
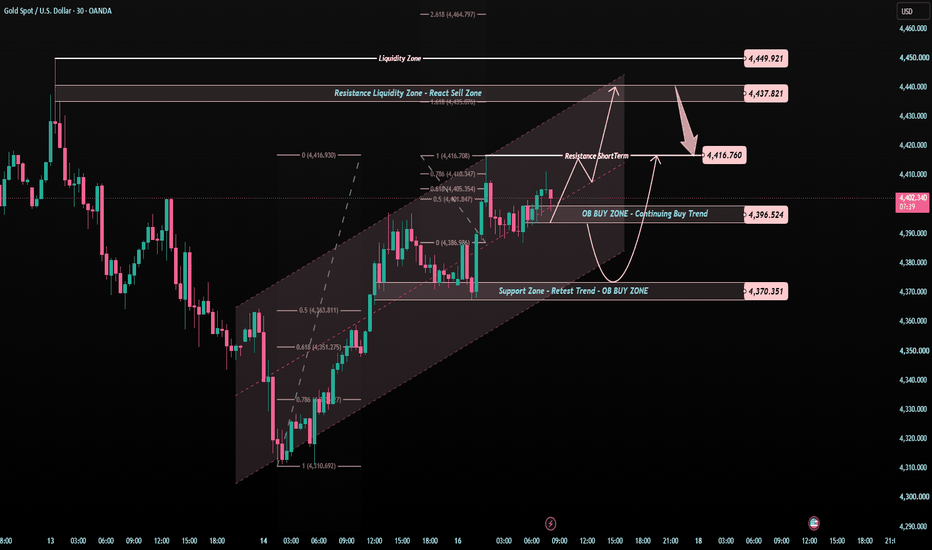
4,416 Is the Line to WatchGold is still moving inside a short-term bullish channel, but the market is now testing a very important area.
Price is holding around 4,400 - 4,410 after recovering from the lower trend support.
Buyers are still present.
But the next clean move depends on one question:
Can gold break 4,416 with confirmation?
The simple read
4,416 is the first short-term resistance today.
If gold breaks and holds above 4,416, buyers may try to continue toward 4,437.
The 4,437 area is the Resistance Liqui
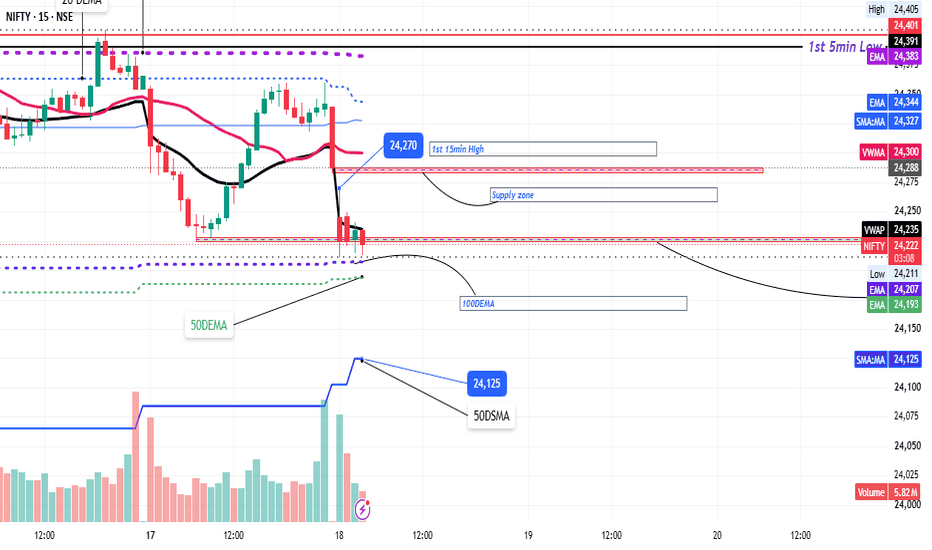
NIFTY Outlook | 18 August 2026 | Expiry Day CautionMarket View
NIFTY is currently displaying negative price action, but the market has not yet confirmed a bearish breakdown.
Yesterday's support zone was retested, and despite the weakness, the index has not managed to close below this critical support area on the 15-minute timeframe. This suggests that selling pressure exists, but it has not yet been strong enough to trigger a confirmed downside move.
As today is weekly expiry, traders should expect increased volatility, false breakouts, and p
NIFTY 50 Index 15M Technical Analysis – Aug 18, 2026The chart shows the Nifty 50 Index on a 15-minute timeframe, currently trading around 24,225.75. Price has experienced a sharp downward move after failing to sustain higher levels, driving directly into your purple Point of Interest (POI) zone at 24,223–24,207. A clean break below this POI will confirm continuation for your short setup toward lower support targets.
Overhead resistance zones and lines (red) are stacked above at 24,274–24,254, 24,306.45, 24,329.00, 24,357–24,343, and 24,427–24,
US 10Y AnalysisUS 10Y closed above 4.70% for the first time since Jan'25, amid the geopolitical tensions and inflation concerns. 4.80% can be the near the near term target, considering the Jan'25 swing high levels. It has also formed flag and pole pattern on the charts, indicating a further possible rise in the yields towards 4.88% and 5.00%(Oct'23 high).
Let me know your thoughts. DYOR
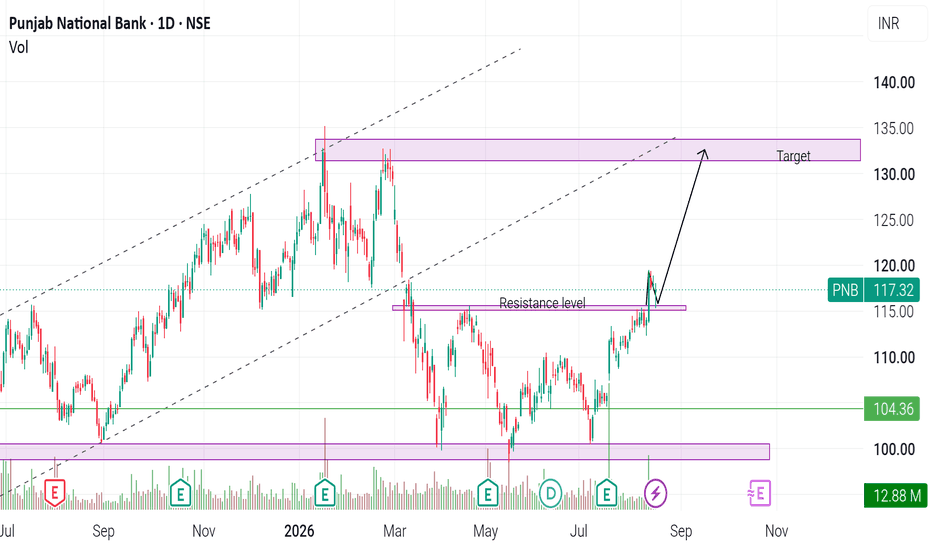
Breakout Retesting Resistance levelFundamentally strong stock which makes your fund safe.
Technically - Currently stock is Retesting his Resistance level (115)
Aggressive Buyer can buy at current price (117)
Safe players can buy after 120
Target - near about 130-132
Disclaimer - I'm not a sebi registered analysist before trading do your own analysis and don't trust blindly anyone.
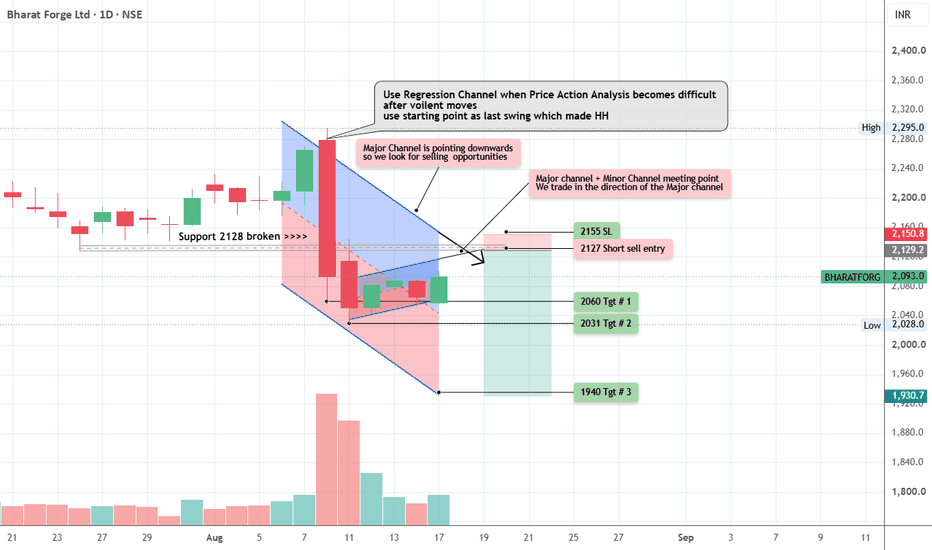
Bharat Forge - Should we trade for Down or Up move?Bharat Forge spent a good amount of time in 2125-2150 range before making 2295 high.
The range broke on the day of results with heavy volumes crashing all the way to 2030.
The major trend seems on downside.
while it is showing signs of revival the volumes dont support it much. in fact volumes at higher levels can be thought of sellers are arriving as the stock nears its broken support of 2125
Short selling levels are shown on the chart 2125-2150
Keeping SL at 2155 final target could be near 1950
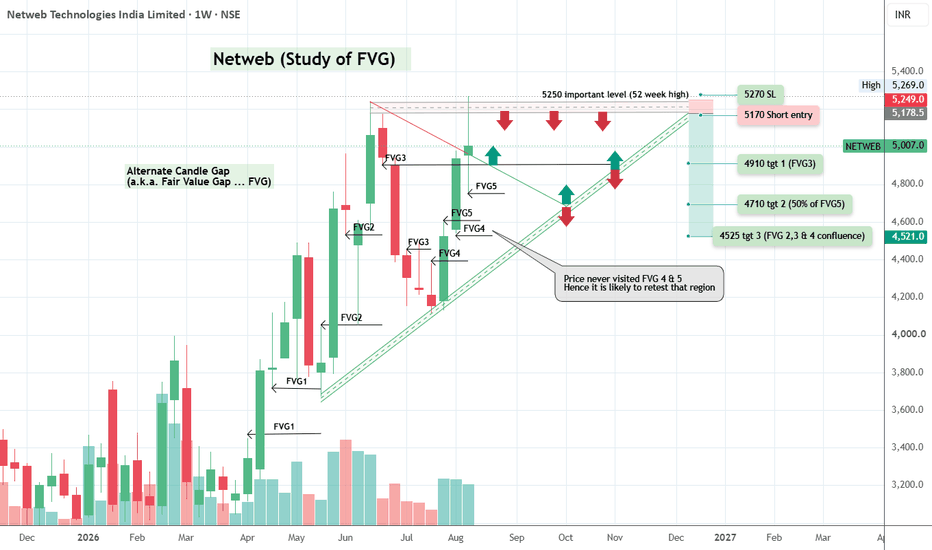
Netweb Technologies at 52 week high, now what?This is a study of FVG on weekly timeframe
FVG is Fair Value Gap. It is calculated as gap left between alternate candles. Price usually comes back to fill that gap. Sometimes 50% sometimes 75% sometimes full 100% of that gap.
Netweb consolidated near 3200 levels for several weeks
Breakout came near 3700 area when it created the first FVG1 set this took price to 5200 level within 9 weeks
on the way new sets of FVG were created as shown on the charts.
FVG4 & FVG5 has not been visited.
Rejection
NIFTY will get weaker below 24200As we can see NIFTY closed below the trendline, showing signs of weakness but we have not closed below previous candles low. Hence as long as NIFTY manages to sustain itself above the low, we are still bullish and can show weakness if goes below it. So plan your trades accordingly and keep watching everyone.
IREN Bullish Breakout Toward $56Iris Energy NASDAQ:IREN has broken above its multi-week descending resistance trendline on the 6-hour chart, showing strong bullish momentum.
The setup remains bullish while key support holds, with upside potential toward $56.
Trading Levels
Entry: $38–$40
TP1: $45
TP2: $56
Stop Loss: $37
LDO Holds Key Support After 37% Surge— Targeting $0.335Lido DAO (LDO) surged 37% following our previous analysis before pulling back from above $0.4100.
Price is now consolidating around an important support area. As long as $0.258–$0.265 holds, the structure remains favorable for a potential recovery move.
Trade Levels:
• Entry: $0.258–$0.265
• TP1: $0.295
• TP2: $0.335
• Stop Loss: $0.238
Bullish above $0.258–$0.265.
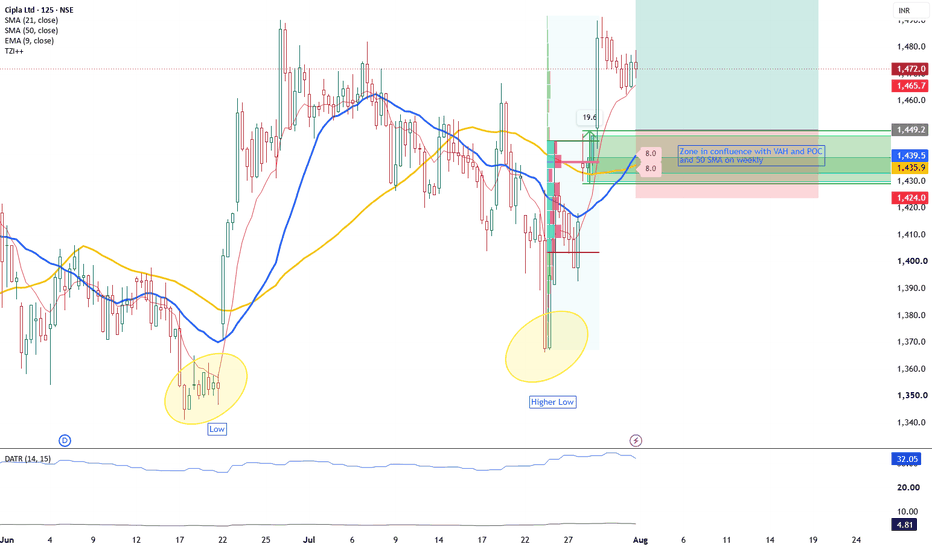
Cipla Ltd – Bullish StructureCipla has formed a higher low structure, signaling potential trend continuation. Price has rebounded from a demand zone that aligns with VAH (Value Area High), POC (Point of Control), and the 50 SMA on the weekly timeframe, creating a strong confluence area for buyers.
Key Technical Highlights:
Higher Low confirms bullish market structure.
Demand Zone: ₹1,430–₹1,450 range, supported by VAH and POC.
Moving Averages: EMA 9, SMA 21, and SMA 50 converging — momentum building.
Price Action: Reje
Bullish Continuation Setup – Jio Financial Services LtdTrade Type: Swing / Positional
Bias: Bullish
Technical Context:
Price is consolidating above the daily 9 EMA and POC (Point of Control), forming a continuation zone after breaking a prior pivot high. The confluence of dynamic support (EMA) and volume equilibrium (POC) strengthens the bullish structure. The demand zone remains intact, providing a solid base for potential upside continuation.
Trade Thesis:
This setup represents a trend continuation within a strong bullish structure. The prio
SILVERMIC: Volatility Compression at Major ResistanceCategory: Technical Analysis
Bias: Long
Timeframe: 1D (Daily)
The Macro Sentiment & Setup
Silver is currently sitting at a fascinating crossroads. Driven by shifting global macroeconomic winds and its dual identity as both a precious safe-haven and a critical industrial metal, market sentiment is pivoting from bearish exhaustion to quiet accumulation.
Looking at the SILVERMIC1! daily chart, we are witnessing a textbook volatility squeeze. Following a steep corrective leg, price action has been
Cipla (D): Breakdown SetupCipla has been consolidating within a Higher TF Balance Area on the daily chart, with a tighter Lower TF Balance Area forming inside it. Price has now broken down below the lower TF Balance Area potentially opening breakdown opportunities.
Trade Plan:
Bias: Short
Entry Zone: 1,431.4
Stop Loss: 1,471.0
Target: 1,369.9
Risk:Reward: 1:1.5
Invalidation:
A close back above 1,471.0 invalidates this setup, putting price back inside the lower TF Balance Area signalling that breakdown has failed.
Nifty Intraday Analysis for 17th August 2026NSE:NIFTY
Index will be range bound as long as it is in the 24250 - 24500 range and trend will emerge on either side when index will break the range.
The upward movement may lead to 24600 – 24650 resistance range and if the index crosses and sustains above this level then may reach near 24850 – 24900 range.
On the contrary, The downward moment may drag the Index to 24150 – 24100 support range in downward momentum and if this support is broken then index may tank near 23900 – 23850 range