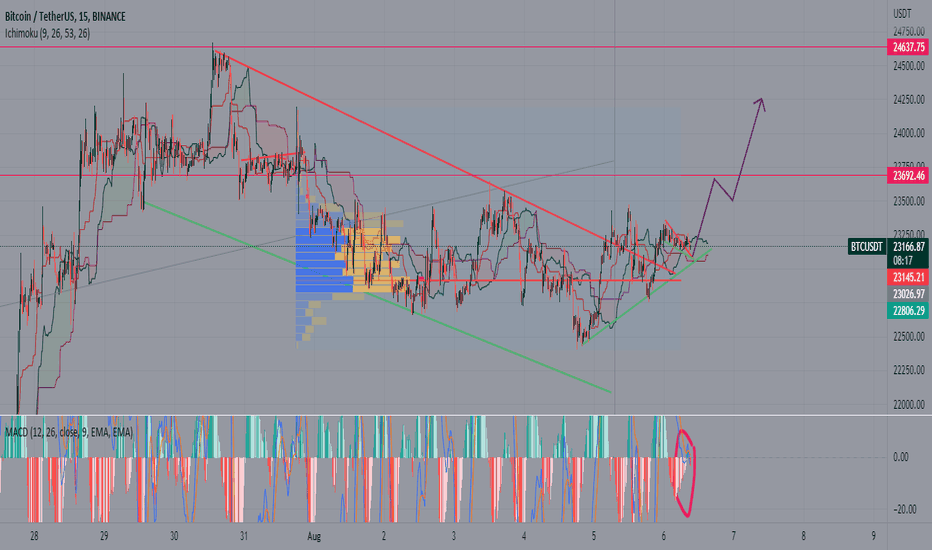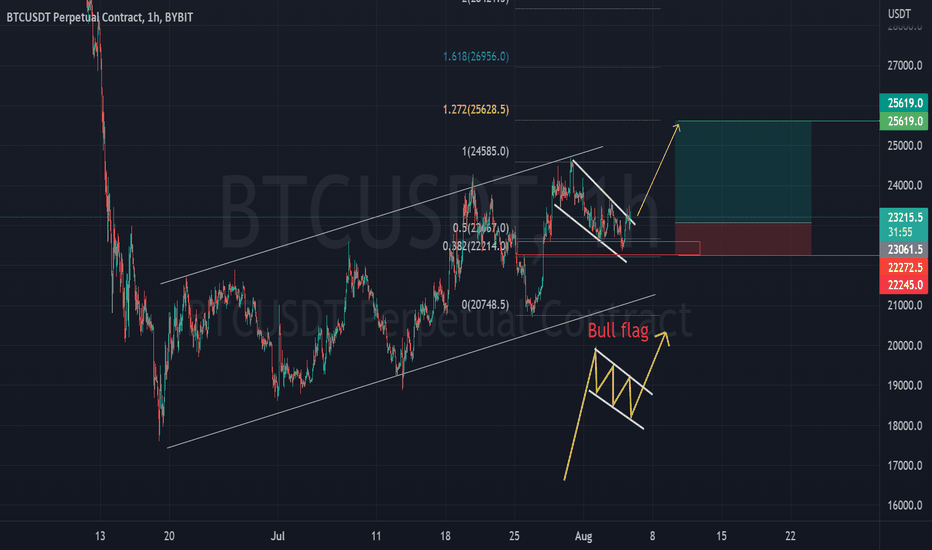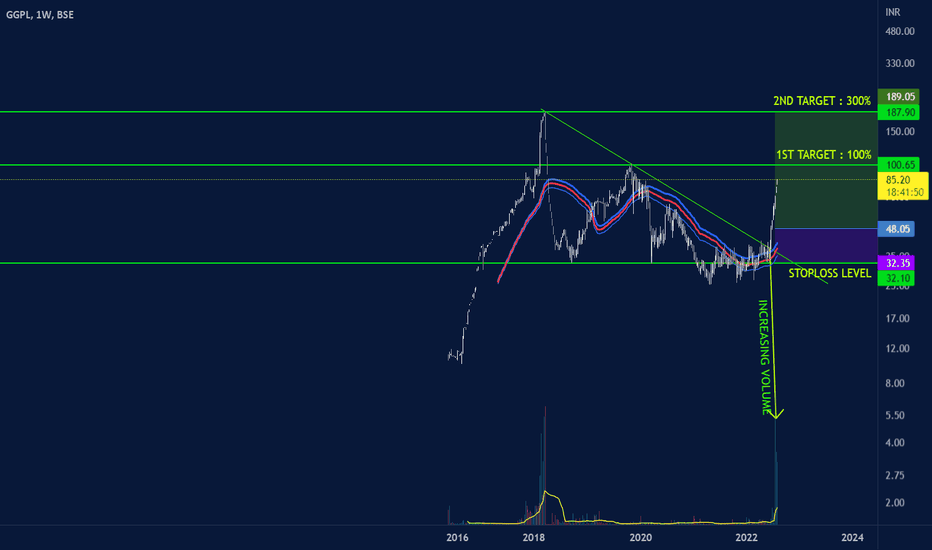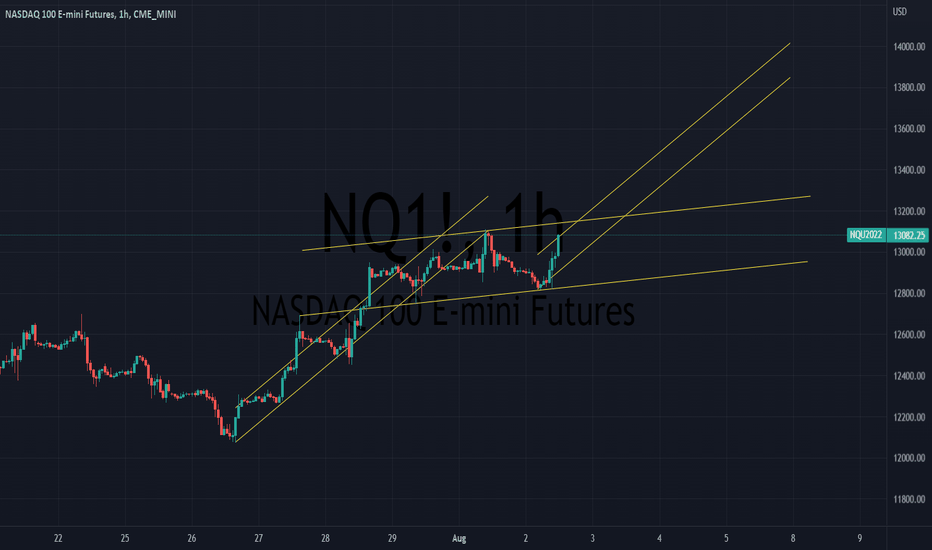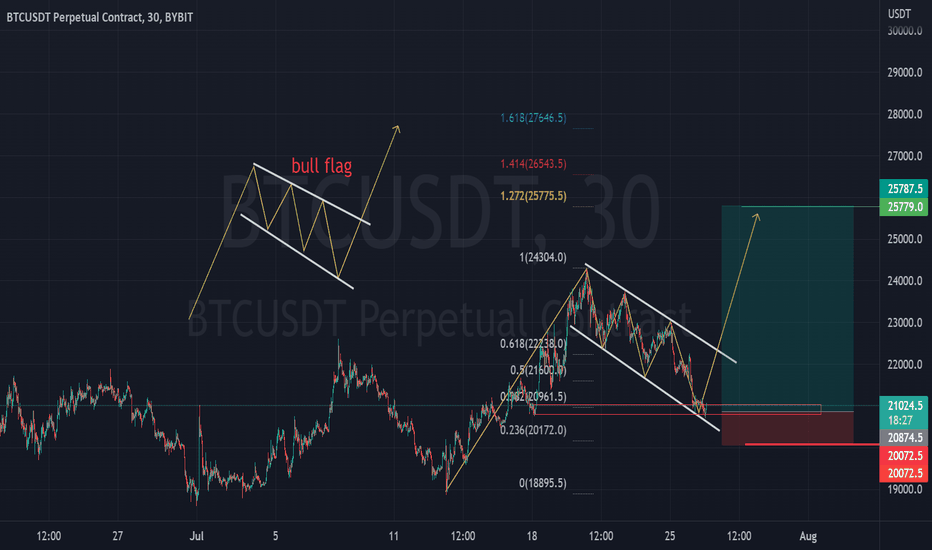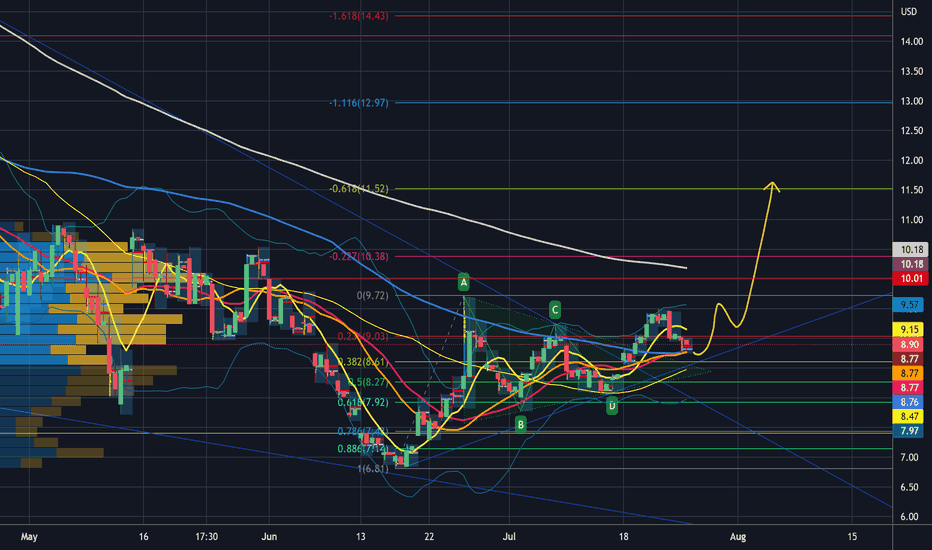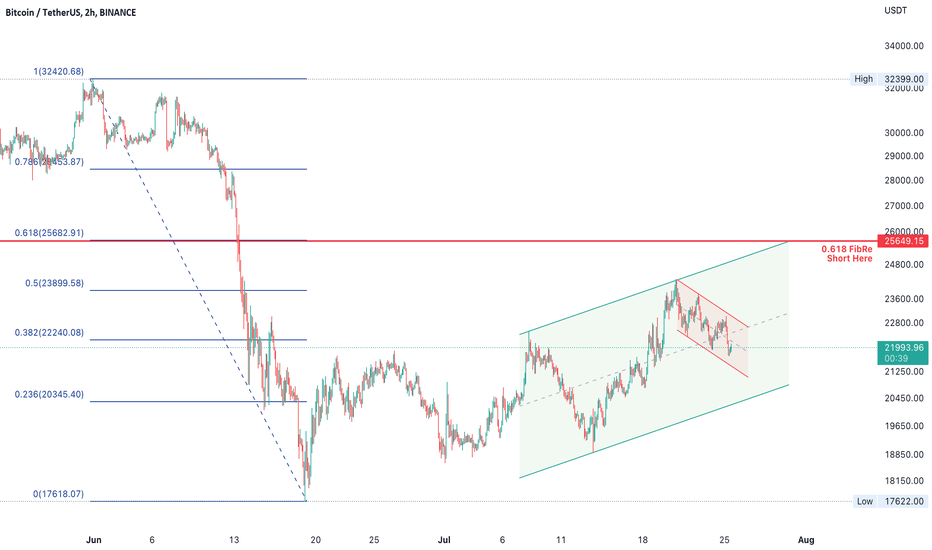
Bullish Flag
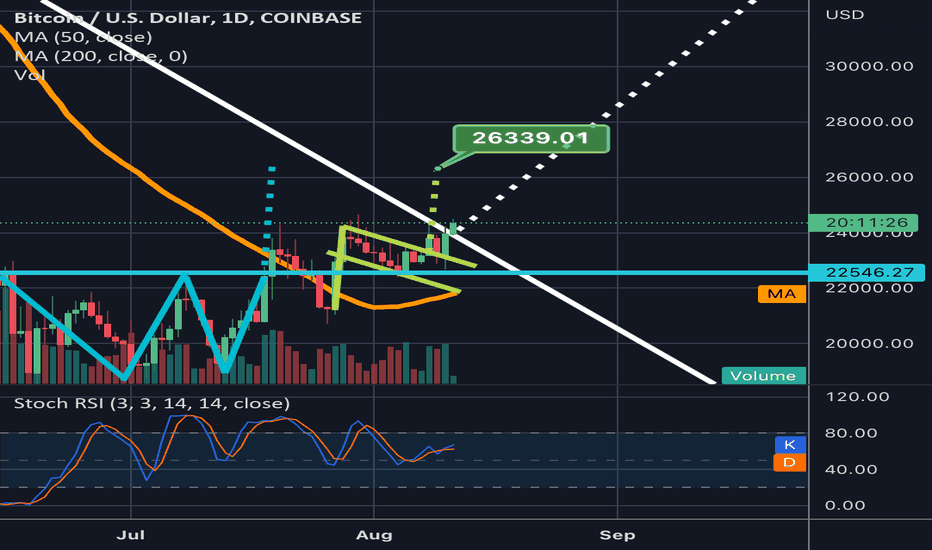
Double bottom & bullflag both share the same breakout targetWe can see the double bottom pattern here in blue and the bullflag in lime neon green. Both breakout targets take us to the 26.3k range. This is great bullish confluence also great to see how when inside the flag the price action held perfect support when retesting the teal horizontal neckline of the double bottom. This all appears to be leading to something potentially much much bigger though as we can see on the coinbase chart price action is now above this descending white trendline. If we ca
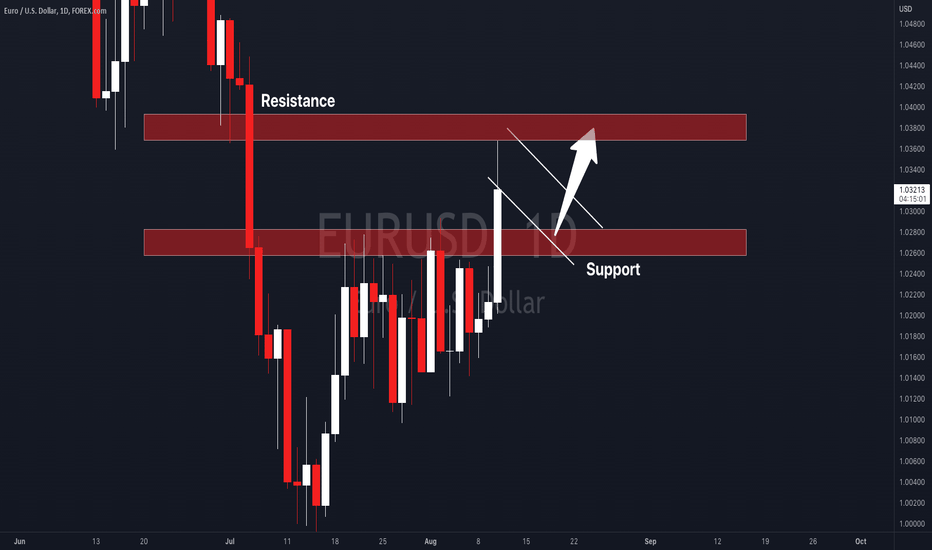
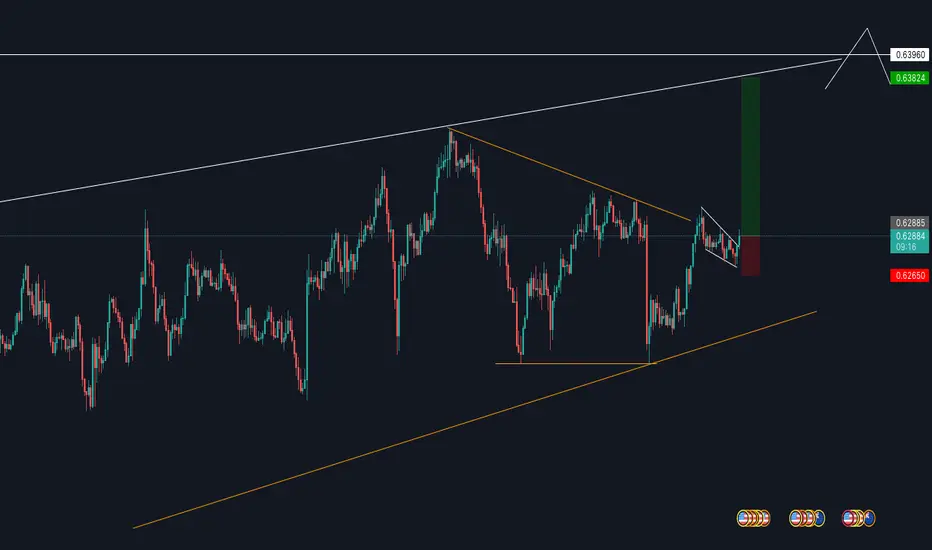
EURUSD CPI Report Breakout-What's Next!Welcome back! Let me know your thoughts in the comments!
**EURUSD - Listen to video!
We recommend that you keep this pair on your watchlist and enter when the entry criteria of your strategy is met.
Please support this idea with a LIKE and COMMENT if you find it useful and Click "Follow" on our profile if you'd like these trade ideas delivered straight to your email in the future.
Thanks for your continued support!
Brian & Kenya Horton, BK Forex Academy
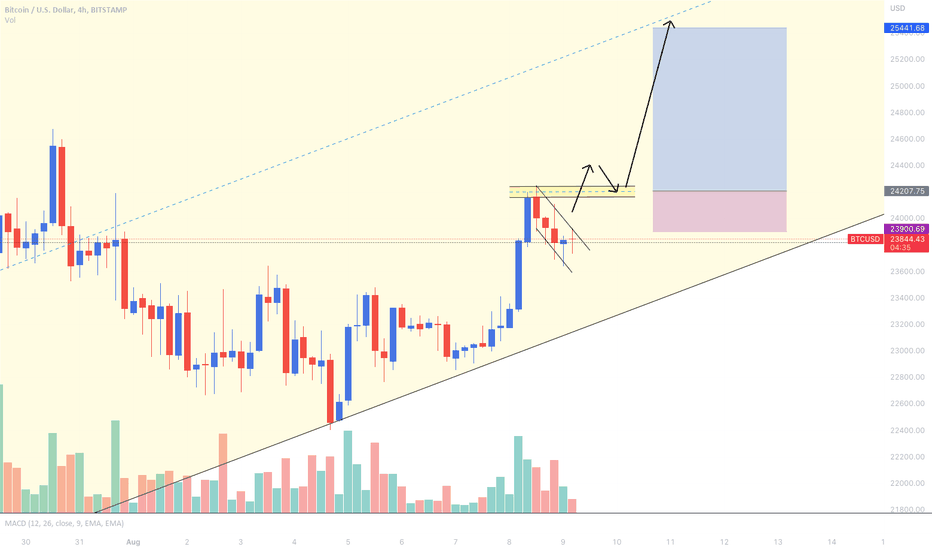
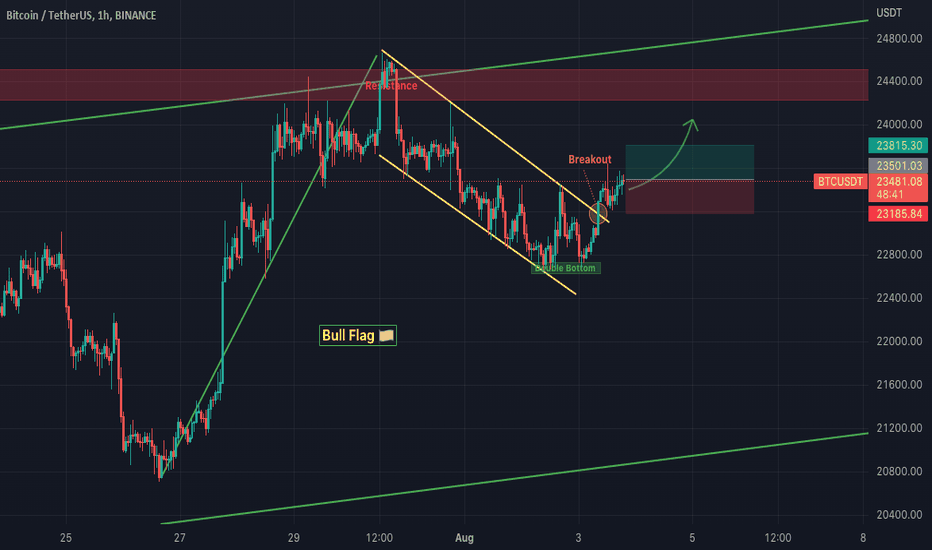
Bitcoin Bull Flag Setup In The 4-hour ChartLooking at Trading a possible Bull flag pattern on Bitcoin (BTC/USD) today.
In the Daily time frame, we are still in that large ascending channel and we have had a nice bounce off of the bottom of the channel suggesting a move higher.
In the 4-hour chart, there is a bull flag forming. We have an impulsive move up with four bullish candles taking out previous resistance. Accompanying this impulsive move upwards is large bullish volume. These are the two things we want to see when looking for a
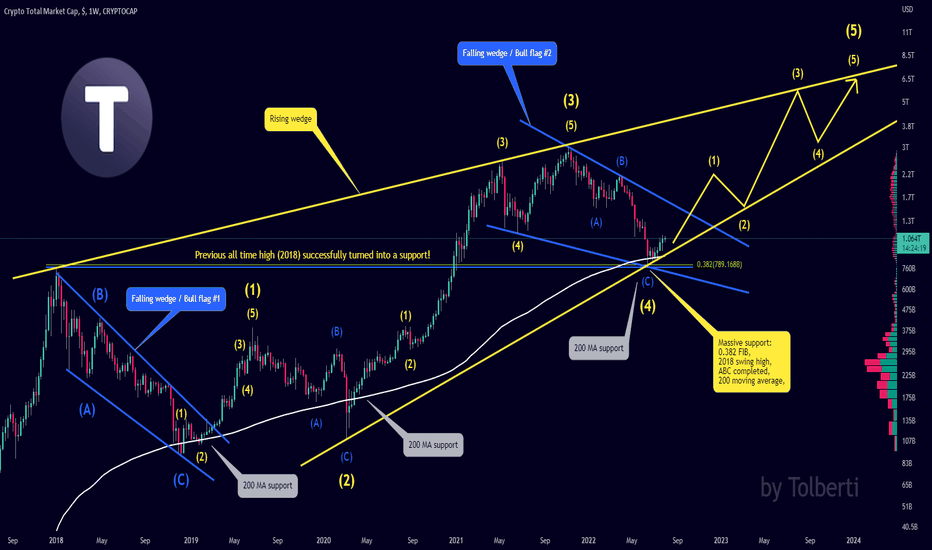
TOTAL Crypto market cap - New rising wedge on the weekly chart!
2023 is going to be a very bullish year for crypto in my opinion!
I believe we can reach a market cap of 6-7 trillion dollars by December 2023.
Most likely, you have never seen this rising wedge elsewhere, because it's a brand new pattern on the weekly scale (LOG).
200 moving average is considered a strong support by huge institutions and hedge funds, and the bulls successfully defended this area.
As per my Elliott Wave analysis, the ABC correction has been completed on the macro scale, an
70% UP IN 2 MONTHS: AMAZING STRATEGYHELLO FRIENDS!
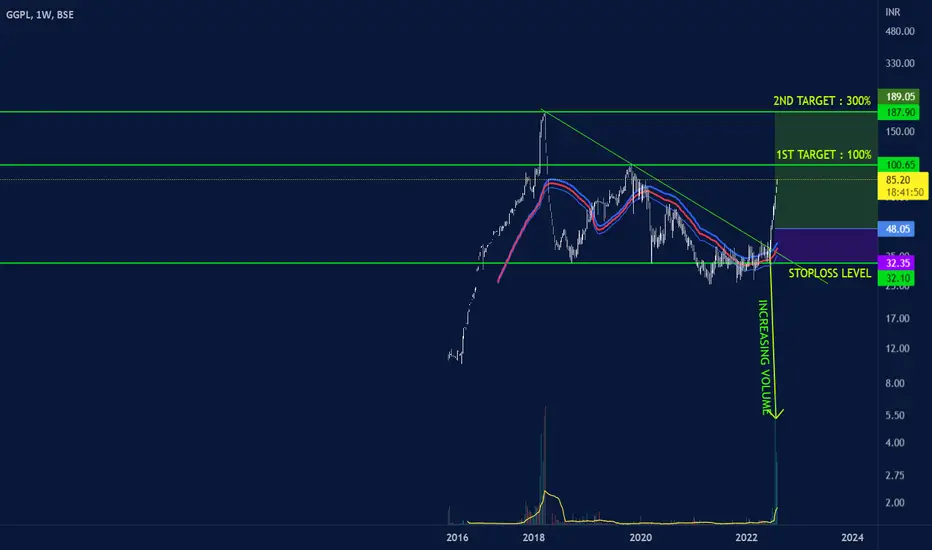
Analyzed this stock 2 months back in my videos in my channel. Worked perfectly as per the analysis. Target is 300% which I assume may hit in 2 months.
Logic behind this trade is Stock was facing resistance of the trendline for a long time. In the third attempt in June it broke the trendline. Another logic is the stock had given breakout above the 50ma band and sustained above that for so long, which indicates bullishness of the stock and the entry of BIG BOYS.
One can notice
EUR USD Bullish Idea based on three patternsEUR/USD
Bull Run seems coming as the following three patterns are all inclined towards a bull run:
1- Cup and Handle.
2- Bullish Flag.
3- ABCD.
The take Profit has been set on the lowest of the projections of all of the three patterns to remain at a safer size while the Stop Loss has been set according to the Dow's Higher low.
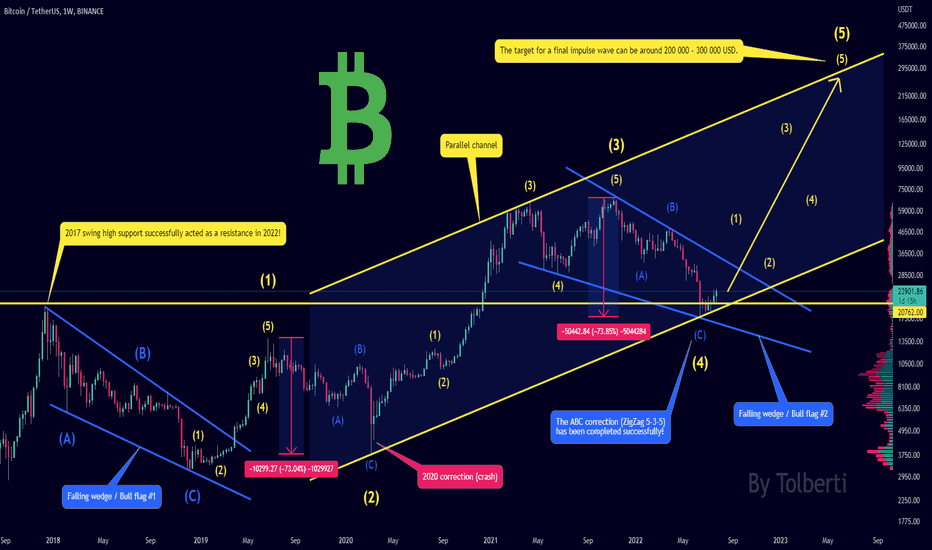
Bitcoin BTC - 250 000 USD next target! Bull market continues.
I think there is absolutely no time for a multi-year bear market at this moment.
We had exactly the same correction (73%) as in 2020, and after that a massive bull run started.
As per my Elliott Wave analysis, we are still in the bull market of an impulse wave and we need to finish it.
An ABC correction (ZigZag 5-3-5, wave 4) has been completed successfully, and we can simply continue with a final wave 5.
We can reach 250 000 USD next year, probably around December.
2017 swing high suppor
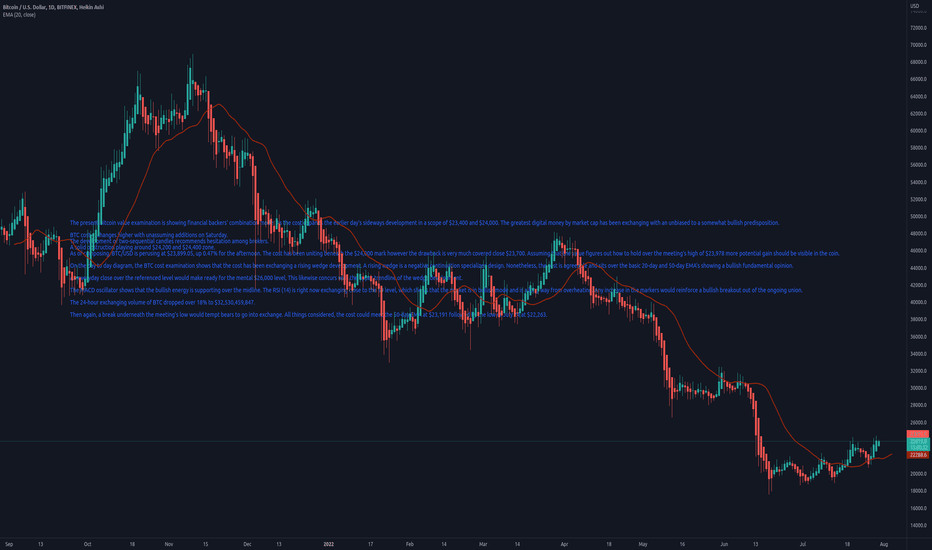
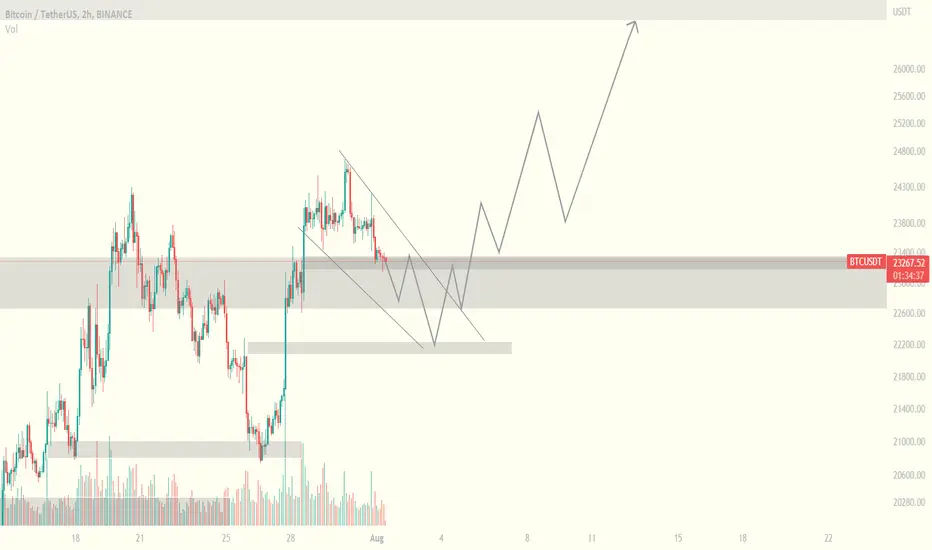
BTC Pressured Below $24,000; Is $26,000 conceivable?The present Bitcoin value examination is showing financial backers' combination mode. As the cost expands the earlier day's sideways development in a scope of $23,400 and $24,000. The greatest digital money by market cap has been exchanging with an unbiased to a somewhat bullish predisposition.
BTC cost exchanges higher with unassuming additions on Saturday.
The development of two-sequential candles recommends hesitation among brokers.
A solid obstruction playing around $24,200 and $24,400 zone
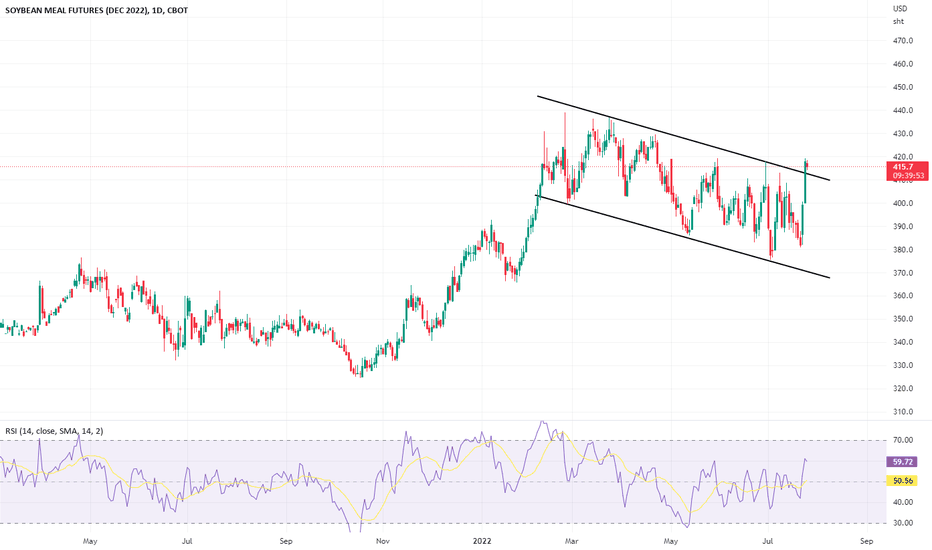
Prime time for soybean meal?Similar to our previous idea , we think grains are primed for a move. With soybean meal futures jumping over 10% from last week, some technical set-ups have come into play.
Firstly, the September soybean meal contract shows a 7-month head-and-shoulder pattern which failed. A broken right shoulder suggests bullish strength.
Secondly, the December soybean meal contract is showing a bull flag that is breaking out, which is also a bullish signal.
Combined, we believe soybean meal future
$HOOD Fibonacci, Bull Flag, Trend line Retouch, now we go up?This chart is similar to the chart for WISH, in my opinion. Similar, yet holds a few critical differences- primarily, the trend line placement & consolidation since March 29th. It looks to me like the price consolidated in this wedge, is being held up, formed a bull flag, came back down to touch it, & in doing so has consolidated further on the fib levels of a fibonacci pattern, & is due to move upward.
Unless, of course, there's a whole lot more sideways action.. As we see with WISH.
*Not tra
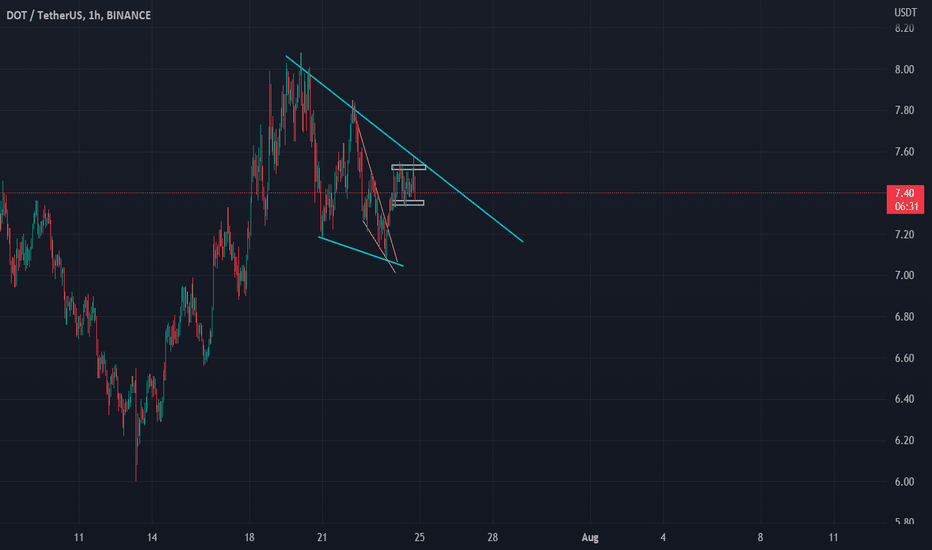
DOTUSDT Preparing a HUGE Run-UpHi Everyone,
Yesterday we mentioned that BINANCE:DOTUSDT was making a Pullback into the 0.5 Fibonacci level and it almost touched it.
After breaking above the falling wedge (bounded by the yellow lines),BINANCE:DOTUSDT after that it consolidated for many hours in a tight range inside a wedge.
As of right now, we are inside a Bullish flag, at its resistance level precisely. If it closes above the pattern, we might buy at the retest of the flag. However, if we don't break it, we will most
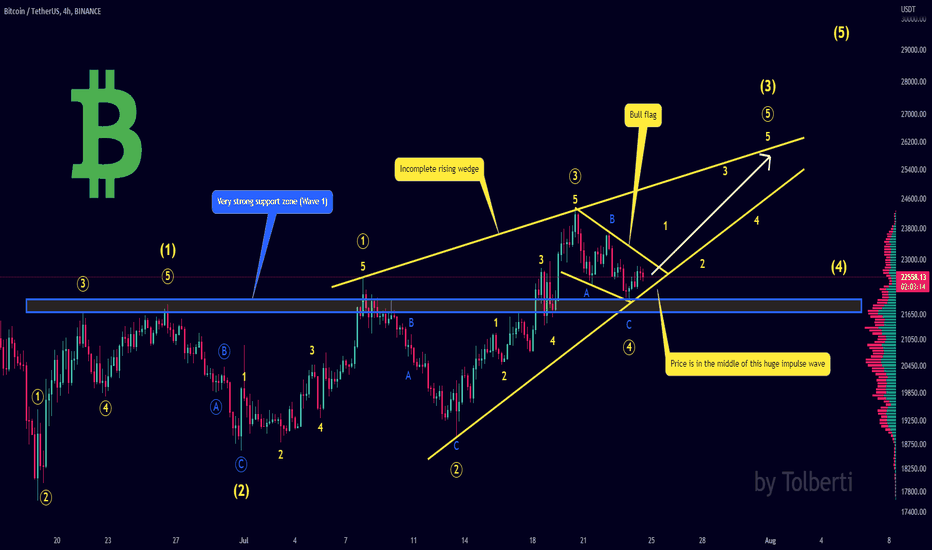
Bitcoin BTC - Ready for another pump! Wedge + Elliott Wave
This is my quick update on Bitcoin on the 4h chart (local price action).
Price is still holding the major support zone (21 700 USDT - 22 000 USDT) and that's why my bias is still very bullish!
We have an incomplete rising wedge, so there is a great chance for another wave to the upside.
As per my Elliott wave analysis - we are basically in the middle of this "huge" Impulse wave!
There are a lot of Elliott waves combinations, but i think this is most probable scenario.
Look at my ideas abo
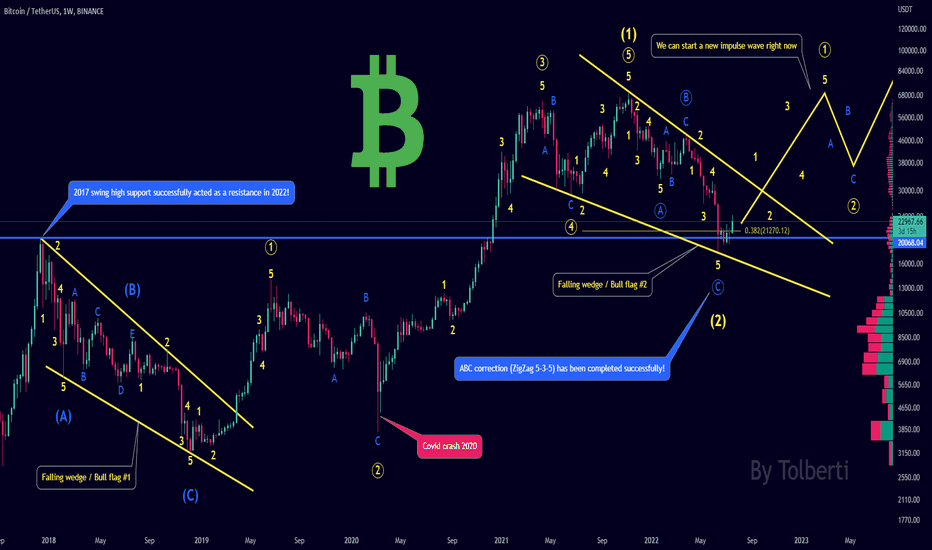
Bitcoin BTC - New bull market just started! Elliott Wave + Wedge
The price is currently above 22 000 USD and we have had a capitulation wick to 17 600 USD to kick out high leverage traders.
I do not see any reason why bitcoin should not respect the previous all time high support from 2017 (around 20 000 USD)!
Bitcoin on the weekly chart is currently sitting on the main support: Previous 2017 Swing high + 0.382 FIB + ABC correction completed!
The price is forming a falling wedge pattern, which is definitely a good sign that can lead to a new bullish trend