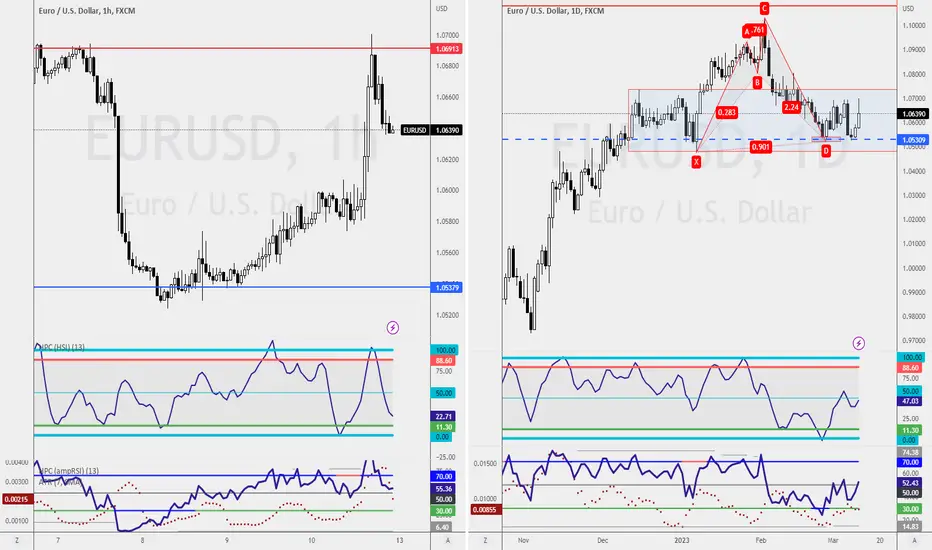
Combo Trade, Buying Opportunity on EURUSDOn the right, the Bullish Shark Pattern has been completed. A retest at 1.0530 would give an opportunity for trend traders to engage in the trade.
On the left, the sideway bounce trading setup on the 1-hourly chart gives traders like me to trade it both ways, shorting and buying opportunities. However, my focus will be put on the buying opportunity at 1.0537 to form a combo trading management setup.
Bullish Shark
Opportunity to buy some Gold$1824.47 is a Great price for me to engage the Gold on a buying opportunity, especially a Bullish Shark Pattern has shown me an opportunity to get involved.
Normally I don't like to engage the trade on a Friday evening(SGT), but a trade like this with RSI Divergence it's hard to say no.
NATURALGAS: 3 White Soldiers at Bullish Shark PCZAt the start of the year Natural Gas had a potential Bullish Shark setup at the minimum .886 PCZ and it ultimately failed to pivot from there but now we are significantly lower at the 1.13/1.618 Confluence zone of this Shark and are showing Bullish Divergence on the MACD as well as a 3 White Soldiers pattern on the daily. The bullish Target for Natural Gas remains to be $4.5 but it could go as high as $9.00. As for stops i'd put it below the second candle of the 3 White Soldiers Pattern which s
NLong
1 Trading Ideas might workThe Bearish Shark Pattern with a HUGE cross might not complete this round; instead of the Shark Patterns, it could form a Bearish Gartley Pattern.
Personally, I will have my focus on the Bullish Shark Pattern that is completing at 1.188.
I've a Bearish Biasness on the GBPUSD based on the higher timeframe, which means the buying trend would be a means to an end.
If the Bullish Shark Pattern does form up, I will be waiting for the Bearish 5-0 Patterns.
I know there is a lot of this going, I wi
A buying and shorting opportunityA buying opportunity and shorting opportunity present on the EURUSD trade, which would you take?
On the higher timeframe(right), there is a buying opportunity base on the Bullish Shark Pattern that is completing at 1.0519. Although the trade is within the Buy Zone(blue box), a retest at 1.0519 with an RSI Divergence is preferred.
On the 4-hourly chart, the Bearish Flag Pattern is on the move. The way I'll trade it is to wait for a retest at 1.0666 with an RSI Divergence.
Both setups are trend
XRPUSDT is inside a massive descending channelXRPUSDT has been creating a daily channel, indicating a period of consolidation and uncertainty in the market. However, after a bullish impulse, the market bounced off the 0.618 Fibonacci level, which is a common level of retracement in technical analysis.
This retracement suggests that buyers are still interested in entering the market and that there is strong support at this level. Furthermore, if the market is able to grab new liquidity from the 0.37$ area and break out of the descending cha
BTCUSD: Bullish Shark within a Bullish Rectangle at the 200 SMABTC is sitting at a confluence zone of the 200 SMA and 1.13 Bullish Shark PCZ while showing heavy amounts of MACD Bullish Divergence; If this area holds i think BTC could go up to target the 2.618 Fibonacci Extension at $27,275.50.
If it fails to hold above this level of confluence then it will likely flush down to an 88.6% retrace below
(W) Multiple patterns completed for NGASNGAS
The symmetrical abcd pattern was completed at 2.49 and the bullish shark pattern was forged at the golden fib extension a couple of points($) below at 2.44.
Both patterns suggest a bounce that could send ngas trading back to $5, which is equivalent to a move of 100% or 25k points above the current price.
We have new fractal support at 1.96 - just below the 200% fib extension - the default target for the head and shoulders pattern printed above.
Solana Showing Signs of Life Near the PCZ of a Bullish SharkSolana after bringing us a Weekly Double MACD Bullish Divergence Below Support has managed to Spring Back into the Major Support Zone that is confluent with a 1.618 Bullish Shark and is now Preparing to Bullishly Engulf the previous weekly candle in an attempt to hook on to the zone.
This can lead to us confirming the Old Support Zone as Support Again where we could then rally off the Support and take off to the Minimum Harmonic Target of $133.86 and if things are really Bullish; All Time High
An upsize trade coming upA Potential Bearish Bat Pattern is looking to complete at 0.9314. This allows me to trigger my upsize trades and gives me an opportunity to stretch my final target to the completion of the Bullish Shark Pattern on the daily chart.
In order for that to happen, a series of confirmation need to be in place, 1 of which require a violation of the Buy Zone/ Demand Zone(blue box).
I've my Bias to short GBPUSDI've my Bias to short GBPUSD, and that's because I've spotted an RSI Divergence off the Daily chart. To fulfil that trade plan, I've my Bearish Shark Patterns on the 1-hourly chart(left) and patiently wait for a shorting opportunity once the market touch 1.2234.
For trend trading traders, you could wait for a buying opportunity on the 4-hourly chart(right) at 1.1879.
Level for buying BTCLevel for consideration for traders who are looking for buying opportunity on BTC. The next optimal level I'm looking at is at $20706.50 base of the Bullish Shark Patterns.
Even for investment or purely buying the coins and store it on wallet, investors/ traders can wait for candlestick pattern confirmation before the actual purchased.
One should not take this as investment advice, but it is my view on the next best price to get involved better than the regular Dollar Cost Averaging(DCA).
Focus on where the Arrows are and earn 187pipsFocus on these 2 arrows, and it might bring you the opportunity to capture the 187pips of potential profits. A Type2 Bullish Shark Pattern(Grey) is what happens.
If the Shark Patterns got violated, I will be waiting for the Deep Bullish Gartley Pattern to engage for a buying opportunity.
The easiest 100pips profits to captureAs early as 8 Feb 23, I've been shouting LONG the Shark, LONG the Shark(at this to my community). The trading analysis report was written on TradingView.
The Bullish Shark Pattern has been bouncing off the Bearish 5-0 patterns, and this combo, it produces more than 100pips of profit potential.
It has bounced up and down 5 times; that's not too bad. 5x100pips = 500pips.
I'm excited to wait for the next confirmation to get involved in this trade.
Someone asked me my view on GoldI was waiting for time to visit my hairdresser while seeing a message left by my follower on my thoughts of Gold.
I must highlight this is not any investment or trading advice, but my opinion on the next best price to look at for a buying opportunity, should I choose to long XAUUSD.
I'm waiting to long XAUUSD at $1840.29 when the market stabilises and respects the Point D of this Bullish Shark Trading Pattern.
One of the way is to wait for the 3-bar reversal as a confirmation signal.
EURUSD-Weekly Market Analysis-Feb23,Wk1EURUSD is on a Bullish Trend 🐮. On the Daily Trend EURUSD hit a resistance at 1.0878 as the market respect the Bearish Crab Pattern's HOP Level. If you are looking for Trend Trading Opportunity (looking to buy), I'll be looking to long at 1.0817 because the potential Bullish Shark Pattern converge with the Bullish Crab Pattern, this will attract 2 groups of buyer to engage the trade.
Natrual Gas at PCZ of Bullish ABCD with Bullish DivergenceNATGAS has Bullish Divergence at the PCZ of a Bullish ABCD on the 2 Day and it also has a smaller intraweek Bullish Shark Setup on the Hourly with a Bullish Divergence.
I will target $4.50 on the Hourly and $8.00 on the Daily.
NLong
USDJPY LONG: Bullish RetracementUSDJPY is finally ready to bounce to the up-side.
The Elliott Wave Diagonal (Wedge) is certainly saying that.
XAUUSD is diverging, EURUSD found a top and the DXY looks ready to bounce.
My Technicals on USDJPY:
* Elliott Wave Reversal
* Leading Diagonal in Primary A (red)
* Bullish Divergence
* Harmonic Pattern: Bullish Shark
* Demand Zone
* Fibonacci Extension Confluence
* Golden Ratio Fibonacci Retracement
USDJPY LONG Signal:
* Entry @ 132.00
* SL @ 122.00
* TP1 @ 137.90
* TP2 @ 143.30
* T
SPX500USD: Partial Decline With Two Bullish HarmonicsWe have a Bullish Gartley on the 30 Minute and a medium sized Bullish Shark on the Daily within the local range above the support zone. If we can trade back above the zone marked in the white box on the bottom right chart we will likely reconfirm our partial decline from there and breakout of the overall Descending Boradening Wedge and go for Macro Targets between the 1.13 and the 1.618 Extension of the previous Local High to Low which would take us to the Halfway and Full Measured Moves of the