XRP - Time to buy for a 500% profit! (now)
XRP is currently retesting a major trendline from 2022, and this retest is exactly where you want to buy this coin! This trendline is also part of an ascending parallel channel on the daily chart, which strengthens the support.
What's more, we have had a strong 0.618 FIB retracement on the LOG scale. We hit this level almost to the dollar, so if you bought at this level, congratulations! I share my trades transparently and post trade setups privately.
We also need to take a look at the volum
Bullish Trend Line
Bitcoin - Explosive breakout, watch this bull flag!
Bitcoin is forming a bullish flag pattern or a wedge pattern on the daily chart, and that's why we can expect an explosive breakout in the immediate short term! The question is, when is it going to be? I would say this or next week, because the price could still touch the upward yellow trendline. But the decision will be very soon!
Bitcoin is bullish because the price is above the yellow trendline and above the 200-day simple moving average. They are pretty close to each other. This moving av
EURUSD - Huge uptrend is ready! (prepare longs)
EURUSD is still extremely bullish because the price is above the 200-day daily moving average and also above the major white trendline. Trend is your friend, so we want to take only longs!
The price is also inside this ascending parallel channel, and I expect another push to the upside to test the upward trendline of the channel. It's possible to bull-break this channel!
In the last 2 weeks, EURUSD has been going down, but it's just a re-test of the previous 2 trendlines. We needed this pull
Bitcoin prediction 2028 (Fibonacci channel, must know)!
This is my projection for the next 5 years. Bitcoin always rapidly grows after the halving event. But around 16 months after the halving event, Bitcoin started to crash significantly.
On the chart, we can see a very important Fibonacci channel on the LOG scale. The 0.618 FIB is always a strong level, and bitcoin hit it almost to the dollar in 2022. Take a look at it! We deeply need to keep this Fibonacci channel in mind. The strongest FIB levels are 0.618 and 0.382. 0.618 + 0.382 = 1. Bitcoin
Bitcoin - Bart pattern + Comment your altcoin!Make a comment with your altcoin below this idea, and I will give you my opinion/analysis of it in reply! Make sure you hit the boost button as well to participate. I will answer your comment with an analysis for you on the weekly/daily chart (long term). I start my analysis with Bitcoin:
The bart pattern is a new type of chart pattern that occurs specifically on Bitcoin but sometimes also on other coins. It's something like pump and dump, but at the top of the pattern we have a sideways pr
Bitcoin - Huge alt-season is starting! (buy altcoins)
Bitcoin dominance is going down, and in confluence with this sideways price action, I expect a huge alt-season! It's a great time to buy some altcoins.
We can clearly see that the price of Bitcoin is stuck in this rising wedge pattern. Because of it, generally, there is a higher probability of the price going down, but we still have plenty of time, and the price can stay inside for another 30 or 50 days.
We need to wait for the rising wedge pattern to show us the direction. The trendline of
Bitcoin - Bearish 21k target confirmed! (Bart pattern)
The Bart pattern is now confirmed, and it doesn't look good at all for the price of Bitcoin! We need to react to the recent price action, and this pattern is breaking down. I would not be surprised if we woke up in the morning and saw a big red dildo!
You can say that Bitcoin is still inside the major parallel channel and that we are still bullish, but I can tell you that the trendline has already touched three times, and only a small bounce is expected on the fourth touch. This channel is st
Bitcoin - Secret pattern no one talks about! (insider info)
This secret parallel channel on the LOG scale is very important for your trades because you want to take profits if the price reaches the top of the descending channel! This is a dynamic resistance, so the trendline changes over time, but currently the resistance is around 39K.
39K is a strong level not only because of this channel but also because of the 0.618 FIB retracement of the previous huge downtrend and the POC of the previous market structure (volume profile).
This analysis is not a
UNIUSDT Bearish Divergence 1H and 4H🚨📉 Alert to Crypto Traders 📉🚨
📈 #UNIUSDT #BullishTrend #BearishDivergence 📉
Crypto community, pay attention to UNIUSDT! 🚀📉
📈 The overall trend for UNIUSDT in the 1-hour and 4-hour time frames remains BULLISH, forming Higher Highs (HH) and Higher Lows (HL). 📈📈📈
🚨 However, we've spotted a concerning sign: #BearishDivergence on the Momentum Indicator RSI. 📉 RSI is showing Lower Highs (LH) and Lower Lows (LL) despite the price making higher moves. 📉📉
📉 This bearish divergence can be an early wa
Bitcoin - Huge pump is ready! + Bullish pennant
Bitcoin is forming this bullish pennant on the daily chart. The price has been inside this pattern for a month, and it's time for a massive breakout!
The next stop is around 34k because of the 0.618 FIB extension from Wave (1) to Wave (2) and we can hit this target next week. After it, a pullback is likely, but continuation of the uptrend to 39k is in place as per my previous analysis. Then I expect a crash to 21k!
This analysis is not a trade setup; there is no stop-loss, entry point, profi
Bitcoin - Pump to 39k! But then, crash to 21k (juicy)
We have had a lot of bullish news in recent days, and that's why Bitcoin is going to reach up to 39k this summer, but do not be too excited because I am expecting a huge crash to 21k later this year!
39K is an extremely strong resistance for the bulls, mainly because of the 0.618 FIB retracement and point of control of the previous market structure. Also during the downtrend in 2022, the price created an unfilled fair value gap, which acts as resistance as well. We can fill this gap and start
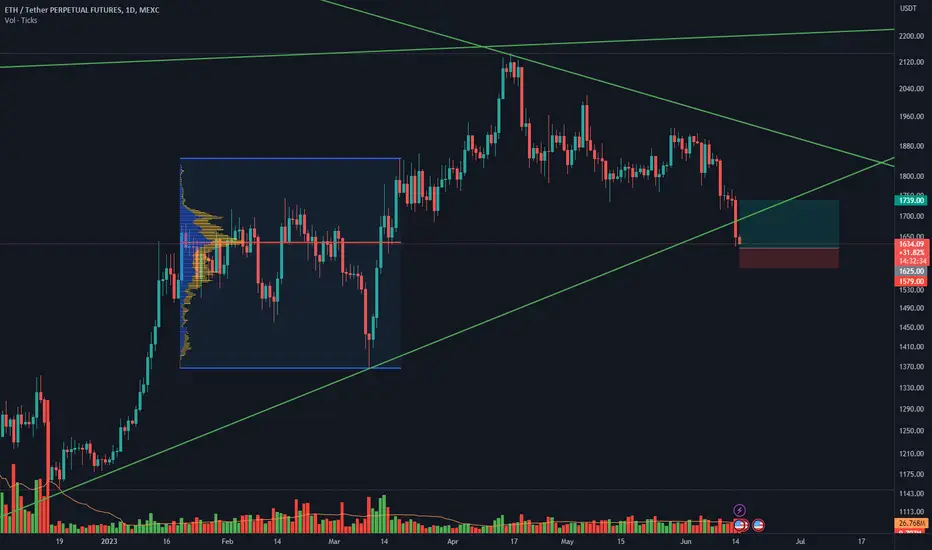
EthereumLet's take a look at Ethereum.
The uptrend is well maintained for now. The price range of $1,609.41 has been preserved in the downward trend.
On higher time frames, if the $2173.14 resistance zone is fully consumed, we can have an attractive bullish trend.
On the lower time frames, the condition of the upward trend can be the consumption of the range of $1937.12.
The above view is valid on the condition of maintaining the range of $1609.41.
ACCO Potential up until $6.39🐂 Trade Idea: Long - ACCO
🔥 Account Risk: 1.00%
📈 Recommended Product: Knockout / Option
🔍 Entry: +/- 5.57
🐿 DCA: No / Yes, up to or down to xxx.xx
😫 Stop-Loss: 4.75
🎯 Take-Profit #1: 6.39 (50%)
🎯 Trail Rest: Yes
🚨🚨🚨 Important: Don’t forget to always wait for strong confirmation once possible entry zone is reached. Trade ideas don’t work all the time no matter how good they look. Do not get a victim of FOMO, there is always another trade idea waiting. 🚨🚨🚨
If you like what you see don’t
EURGBP → Formation of a pre-breakout consolidationFX:EURGBP a week earlier forms a break of the resistance of the descending price channel. A consolidation of 0.86000-0.85400 is forming. We see consolidation at the resistance. What to expect from the price?
Most likely, the price will continue to test resistance 0.86067. Pre-break consolidation is forming, which can be interpreted as another attempt of price exit from the range, followed by the strengthening of the currency pair.
Moving averages are beginning to narrow and if the conditio
ETHEREUM long setup Hello Traders, here is the full analysis for this pair, let me know in the comment section below if you have any questions, the entry will be taken only if all rules of the strategies will be satisfied. I suggest you keep this pair on your watchlist and see if the rules of your strategy are satisfied. Please also refer to the Important Risk Notice linked below.
Bitcoin - Buy exactly here for the long term! (premium solution)Bitcoin is ready to go higher, but this uptrend is starting to be a little bit extended, and we need a correction to 21k. I have been warning you for a long time about a huge crash that is going to happen soon or later. We still have an unfilled CME GAP, and exactly in the GAP we have the 0.618 LOG FIB retracement (15476->33000), which is a good confluence to buy Bitcoin for the long-term and ride your position to a new all-time high!
It looks like Bitcoin is going to reach levels around 32k -
Bitcoin - Pitchfork and Bullish Flag (You haven't seen it!)
On the chart, you can see my Fibonacci original pitchfork on the logarithmic scale, starting from the bottom at 15476. As you can see, this pitchfork is very well respected, sometimes pretty much exactly to the dollar. The power of a pitchfork is real on Bitcoin. I use Fibonacci 1, 0.618, 0.382, and 0 values for it.
Right now, the price of Bitcoin is still bullish because the pitchfork is clearly holding, we can see a bullish flag / parallel channel on the recent price action, and what's more
USD/CHF - long positionWe have the USD/CHF on the daily time frame. We can see the downtrend, which is confirmed by indicator 200 EMA. Indicators SAR and RSI remains in the bullish control zone. It may be the right opportunity to take a long position. Final target, take profit, entry price and stop loss are in the chart.
Ethereum - Weekly bearish flag will send ETH to 618 USDT (gg)
Ethereum shows a lot of weakness on the major timeframes. You can see that the downtrend was pretty steep, and now we are in a consolidation phase. If we take a closer look at it, this is not even an uptrend; it's more like a sideways bearish flag consolidation.
A trendline from 2015 on the ETHBTC chart is breaking down, which is a significant bearish technical event. Make sure you check out the trendline in the related section down below!
Now the question is, "What will be the bottom on ETH
Bitcoin - 2 secret patterns, no one talks about!
We have a head and shoulders (reversal pattern) and ascending parallel channel on the daily chart. Both of these patterns are bearish because there is a higher probability of a breakdown. There is a lot of empty space at the bottom of the parallel channel, and I feel like we need to go down to fill up the price action.
It can be a great idea to long bitcoin at the bottom of the channel because there is also a POC of the previous expanding triangle and the 0.618 FIB retracement of the previous