Camarilla Pivot Points
UPTREND CONTINUATION IN ITC"ITC" is showing higher-highs in it's monthly chart which shows that the stock is in perfect "Uptrend'. It is getting ready for another rally and the next uptrend will continue above 510 (Let a daily candle close above the Entry point). Keep stop loss at the latest swing low in hourly chart. Target is calculated using ABCD Pattern of Harmonics, which is almost 17% on the deployed capital.
Natural gas yesterday booked 70 points profit making baseDisclaimer -
This information is only for educational purposes, this is not for any buy or sell recommendations .
On Our Harmonic pattern indicator
based trade setup take trade as explained below :-
ENTRY -
When price breaks 30% retracement Which is D points then take Entry on Buy or Sell Trade
SL -
SL is (-3%) Which is mentioned in Chart . our SL is just above or below of Recent high or Low .
TARGET -
Target 1- (T1 : 61.8 %)
Target 2- (T2 : 88.6 %)
Target 3- (T3 : 127.2 %)
Copper sell given at 866 , 853 Target hit avoid carry trade Disclaimer -
This information is only for educational purposes, this is not for any buy or sell recommendations .
On Our Harmonic pattern indicator
based trade setup take trade as explained below :-
ENTRY -
When price breaks 30% retracement Which is D points then take Entry on Buy or Sell Trade
SL -
SL is (-3%) Which is mentioned in Chart . our SL is just above or below of Recent high or Low .
TARGET -
Target 1- (T1 : 61.8 %)
Target 2- (T2 : 88.6 %)
Target 3- (T3 : 127.2 %)
SEI/USDT: Bullish Shark Pattern Signals Potential RallySEI/USDT has formed a bullish shark pattern and is showing a bullish divergence bounce, indicating strength.
There is now a chance to retest the $0.30 level, after which a rally is expected.
The targets are $0.58 and $1.16.
#SEI #USDT #CryptoTrading #BullishSharkPattern #BullishDivergence #CryptoAnalysis #TradingTargets #CryptoRally #TechnicalAnalysis
Banknifty today & yesterday good profit in sell tomorrow nutral Disclaimer -
This information is only for educational purposes, this is not for any buy or sell recommendations .
On Our Harmonic pattern indicator
based trade setup take trade as explained below :-
ENTRY -
When price breaks 30% retracement Which is D points then take Entry on Buy or Sell Trade
SL -
SL is (-3%) Which is mentioned in Chart . our SL is just above or below of Recent high or Low .
TARGET -
Target 1- (T1 : 61.8 %)
Target 2- (T2 : 88.6 %)
Target 3- (T3 : 127.2 %)
Bitcoin BTCUSD buy near 56500 SL 53500 Target 61100, 64500Disclaimer -
This information is only for educational purposes, this is not for any buy or sell recommendations .
On Our Harmonic pattern indicator
based trade setup take trade as explained below :-
ENTRY -
When price breaks 30% retracement Which is D points then take Entry on Buy or Sell Trade
SL -
SL is (-3%) Which is mentioned in Chart . our SL is just above or below of Recent high or Low .
TARGET -
Target 1- (T1 : 61.8 %)
Target 2- (T2 : 88.6 %)
Target 3- (T3 : 127.2 %)
Stock Market Analysis Report: Lupin Limited (NSE: LUPIN)
Introduction
Greetings, traders! If you're looking for a pharmaceutical stock that might just cure your portfolio blues, look no further than Lupin Limited. This stock is brewing up an interesting pattern that’s worth a closer look. Let’s dive into the technical details and see what’s in store!
Price Action Overview
Chart Analysis
Current Price: ₹1,759.30
Daily High: ₹1,767.00
Daily Low: ₹1,598.25
Volume: 10.039M
Key Technical Indicators
Bearish Gartley Pattern: The chart reveals a bearish G
Finnifty holding buy for tomorrow today get 700 points bankniftyDisclaimer -
This information is only for educational purposes, this is not for any buy or sell recommendations .
On Our Harmonic pattern indicator
based trade setup take trade as explained below :-
ENTRY -
When price breaks 30% retracement Which is D points then take Entry on Buy or Sell Trade
SL -
SL is (-3%) Which is mentioned in Chart . our SL is just above or below of Recent high or Low .
TARGET -
Target 1- (T1 : 61.8 %)
Target 2- (T2 : 88.6 %)
Target 3- (T3 : 127.2 %)
USDT.D Bearish Shark Pattern Signals Move to Key Support LevelsUSDT.D has formed a bearish shark pattern and has broken the support trendline, indicating a likely move towards the 4.6% and 4.10% support areas. The bearish confirmation is further supported by the RSI falling from the overbought zone and a clear bearish cross on the MACD.
#USDTDominance #BearishSharkPattern #TechnicalAnalysis #Crypto #RSI #MACD #SupportLevels #CryptoTrading
BTC Breaks Free from Downtrend: Next Stop $72KBitcoin Shows Bullish Signs: Breaks Downtrend, RSI Rebounds, Targeting $85K and $90K
Bitcoin has recently displayed strong bullish signals in the market. It formed a bullish divergence and successfully broke its downtrend. The RSI (Relative Strength Index) has bounced back from oversold levels, indicating increasing bullish momentum.
To sustain this upward trend, Bitcoin now needs to surpass key resistance levels at $64,500 and $72,000. If these levels are breached, new targets of $85,000 and
Gold buy on dip not going down so will go up onlyDisclaimer -
This information is only for educational purposes, this is not for any buy or sell recommendations .
On Our Harmonic pattern indicator
based trade setup take trade as explained below :-
ENTRY -
When price breaks 30% retracement Which is D points then take Entry on Buy or Sell Trade
SL -
SL is (-3%) Which is mentioned in Chart . our SL is just above or below of Recent high or Low .
TARGET -
Target 1- (T1 : 61.8 %)
Target 2- (T2 : 88.6 %)
Target 3- (T3 : 127.2 %)
Why Now is the Best Time to Buy Bitcoin (BTC) - Expert AnalysisArticle:
In the ever-evolving world of cryptocurrencies, Bitcoin (BTC) remains the king. Today, we dive into why now might be the perfect time to buy BTC and how you can capitalize on current market trends. Here’s an expert analysis to guide your investment decisions.
Nifty buy given at 23500 near 840 points profit running hold it Disclaimer -
This information is only for educational purposes, this is not for any buy or sell recommendations .
On Our Harmonic pattern indicator
based trade setup take trade as explained below :-
ENTRY -
When price breaks 30% retracement Which is D points then take Entry on Buy or Sell Trade
SL -
SL is (-3%) Which is mentioned in Chart . our SL is just above or below of Recent high or Low .
TARGET -
Target 1- (T1 : 61.8 %)
Target 2- (T2 : 88.6 %)
Target 3- (T3 : 127.2 %)
Nifty 170 points profit running next Target 23770 hold buy tradeDisclaimer -
This information is only for educational purposes, this is not for any buy or sell recommendations .
On Our Harmonic pattern indicator
based trade setup take trade as explained below :-
ENTRY -
When price breaks 30% retracement Which is D points then take Entry on Buy or Sell Trade
SL -
SL is (-3%) Which is mentioned in Chart . our SL is just above or below of Recent high or Low .
TARGET -
Target 1- (T1 : 61.8 %)
Target 2- (T2 : 88.6 %)
Target 3- (T3 : 127.2 %)
Finnifty buy given at 23030 , 450 points profit running hold it Disclaimer -
This information is only for educational purposes, this is not for any buy or sell recommendations .
On Our Harmonic pattern indicator
based trade setup take trade as explained below :-
ENTRY -
When price breaks 30% retracement Which is D points then take Entry on Buy or Sell Trade
SL -
SL is (-3%) Which is mentioned in Chart . our SL is just above or below of Recent high or Low .
TARGET -
Target 1- (T1 : 61.8 %)
Target 2- (T2 : 88.6 %)
Target 3- (T3 : 127.2 %)
LONG TERM TARGET FOR APOLLO HOSPITALSWe can see a strong breakout on monthly basis in " Apollo Hospitals ". The current monthly candle is undergoing a retracement to test the level of breakout. If the breakout is genuine, after retracement, there will be signs of bullish reversal. This indicates that the current trend is about to continue and for that I've used the ABCD pattern of Harmonics to find the next target of the current impulse wave. For entry with a good Risk-to-Reward Ratio, we need to switch to a lower timeframe and l
BAJAJ AUTO GETTING PREPARED FOR ANOTHER RALLYBajaj Auto is currently near it's ATH, and is getting ready for another rally in short term. The target is calculated using the ABCD pattern of Harmonics. Current daily candle tried to break ATH level but gave a closing below it. So, candle closing above 8700 will decide whether it will move upside or not. However, this is a perfect example of price action of a bullish market!
LINK's Bullish Shark Pattern: Retest Bounce Targets $23 with 100#Chainlink ( BIST:LINK ) is currently forming a bullish shark pattern, a harmonic pattern that indicates a potential reversal and a strong buying opportunity.
In this scenario, LINK's price is expected to bounce with retest of a crucial support level. The RSI (Relative Strength Index) has reached the oversold area, suggesting that the asset is undervalued and may soon experience a reversal.
If LINK successfully retests the support level and bounces, the bullish momentum could propel it to a si
NEAR/USDT: Bullish Shark Pattern Signals a Potential 60% Upside#NEAR/USDT has formed a bullish shark pattern & the RSI (Relative Strength Index) is currently in the oversold area, suggesting that for a rebound.
Currently, NEAR is standing at a bullish support trend line, which further reinforces the potential for an upward move. Given these strong technical signals to deliver a 60% profit.
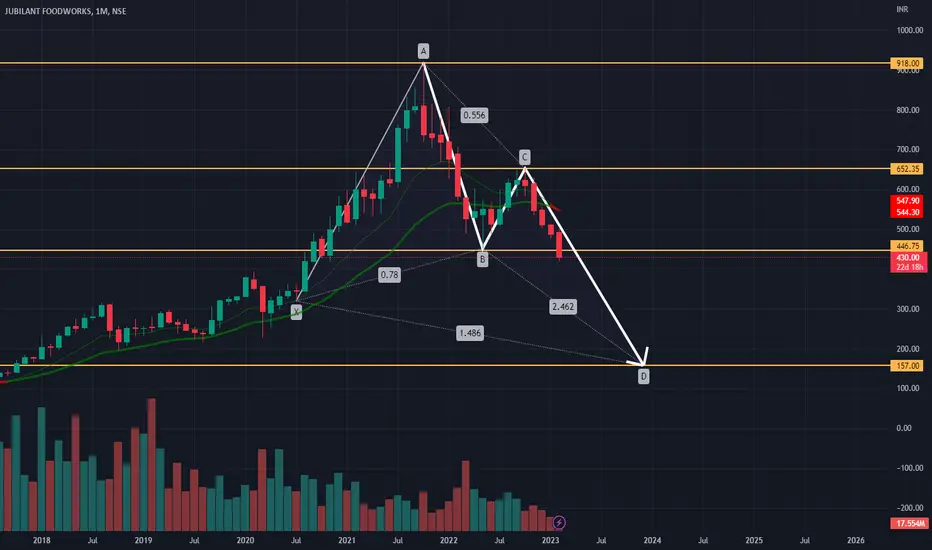
SELL JUBILANT FOODWORKSshare name : jubiLant food works
call type : sell
- share is forming a bullish butterfly pattern with ab=cd structural
- evening star on a point and tweezer top on c point
- currently share is breaking b point which is the neck of bullish butterfly pattern or you can say double top , in upcoming we can clearly see levels of 155
Thanks