Candlestick Analysis
Nifty 50 Price Structure Analysis [08/12/2025: Monday]Top-Down Nifty 50 Price Structure Analysis for 08th December 2025. The day is Monday.
(1) Monthly Time Frame:
Red paper umbrella candle. The body is smaller compared to the lower wick. So far, it is an indecisive market. The main trend is bullish, but the present scenario is indecisive. The major support zone is at 26100 and 26000. Major resistance is at 26300. The view is bullish to indecision.
(2) Weekly Time Frame:
Red paper umbrella candle. The body is smaller compared to the lower wick. There is no upper wick. Thus, there is good buyer participation. Looking at the combination of 3 candles, buyers (or bulls) are getting stronger. The lower wicks are getting longer every week. For the past 3 weeks, the price has been taking very good support at the zone (25850 - 25900). In the present scenario, levels 26100 and 26000 are major support zones. Major resistance is at 26300. Considering, past 8 weeks, the price is in the structure of higher highs and lower lows. Thus, bullishness is intact. Take no bearish trade until the price starts to trade below the zone of 26100 - 26050. Presently, the view is bullish to indecision. If the price keeps sustaining above the level 26200, then probably, the previous all-time high (ATH) will be breached.
(3) Daily Time Frame:
The past 2 days are green days. On 05th December price gave a 200-point bullish rally. However, price is still in the range of the bullish marubozu formed on 26th November (Wednesday). Price needs a stable movement above the level 26200. Presently, 3 levels have emerged as a strong support zone - 26100, 26050, and 26000. So, take no short position unless the price starts to trade below 26000. Any downward move should be doubted. The view is bullish to indecision as the previous ATH and level 26300 are very close.
(4) 30-Minute Time Frame:
The complex correction since 17th October 2025 continues. Presently, price is trying to trade in the upper zone of the rising channel. The direction of the complex correction is bullish but with high volatility and indecisive moves. A strong support zone is formed at the levels 26100 - 26000. A minor resistance is at 26200. Major resistance is at 26300 and the previous ATH (26277.35). Every down move should be doubted. Institutional bias is bullish. The view is bullish.
Event:
No expiries on Monday. No high-impact event. However, the U.S. Fed Interest Rate Decision is on 11th December (Thursday) - a high-impact event in the next week.
Bullish Scenario Set-Up:
(i) Price sustains above the opening price.
(ii) Price sustains above the level 26200 and shows promise of reaching levels 26277.35 (ATH) and level 26300.
Bearish Scenario Set-Up:
(i) Price sustains below the opening price.
(ii) Price starts to sustain below the level 26050 and starts to form a lower lows, lower highs structure below 26000.
No Trading Zone (NTZ): 26200 - 26100.
Expectations (Hypothesis and Insights from Trading Plan):
(i) Take bullish trades only. Price must start to trade above the level 26200.
(ii) Every down move should be doubted. Levels 26100 - 26050 are very strong support.
(iii) Be skeptical of executing trades in the first half of Monday, as level 26277.35 (previous ATH) and level 26300 are close. Also, in case of a gap up or a gap down, be very cautious. A clear price structure is needed for trend clarity.
(iv) Trade only when bullish/ bearish conditions are fulfilled. Otherwise, don't trade. Protect your resources.
NOTE:
"Mark your points. Trade your points. Price is God. Anything can happen. Therefore, trade what you see, not what you believe."
Happy Trading!
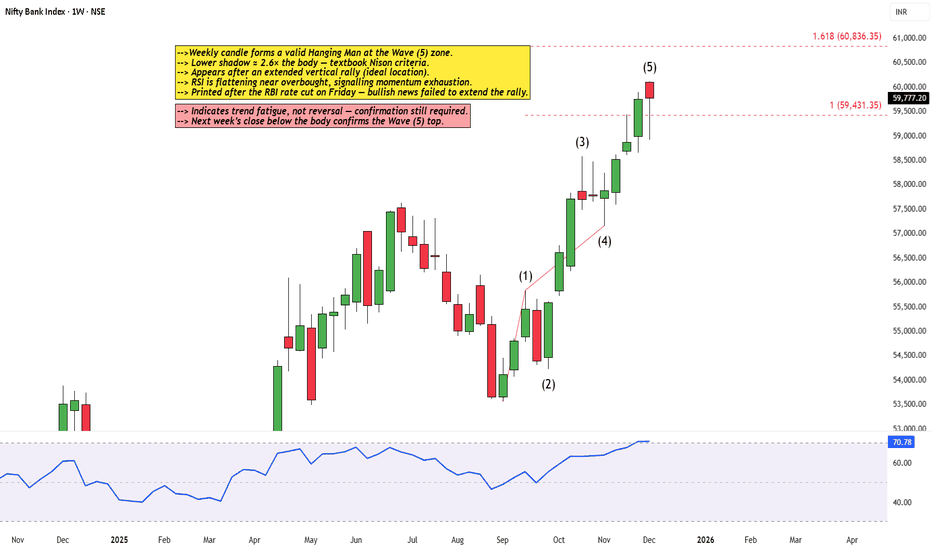
Wave (5) Meets a Hanging Man: Trend Fatigue in Bank NiftyBank Nifty has printed a valid Hanging Man at the Wave (5) zone, right inside the 1–1.618 Fibonacci cluster. RSI is flattening near overbought, and the RBI’s Friday rate cut failed to extend the rally. This points to visible trend fatigue.
A reversal, however, will only be confirmed if next week closes below the Hanging Man’s real body.
Disclaimer: This analysis is for educational purposes only and does not constitute investment advice. Please do your own research (DYOR).
Rejection. Divergence. Confirmation? A Short Setup EmergingFeature, Detail
Price Signal: Shooting Star at the peak, showing clear rejection of higher prices and buyer exhaustion
Momentum Signal: Bearish RSI divergence — price made a higher high while RSI formed a lower peak
Consensus: Reversal candle + momentum divergence creates a high-probability pullback setup
Current Price: Trading near the 52-week high of ₹2,011, making the rejection zone psychologically significant
Bias: Short-term correction favored
Action: Enter only after confirmation — a daily close below the Shooting Star’s body
Invalidation (SL): A close above the Shooting Star high negates the bearish setup
Disclaimer: Educational only. DYOR.
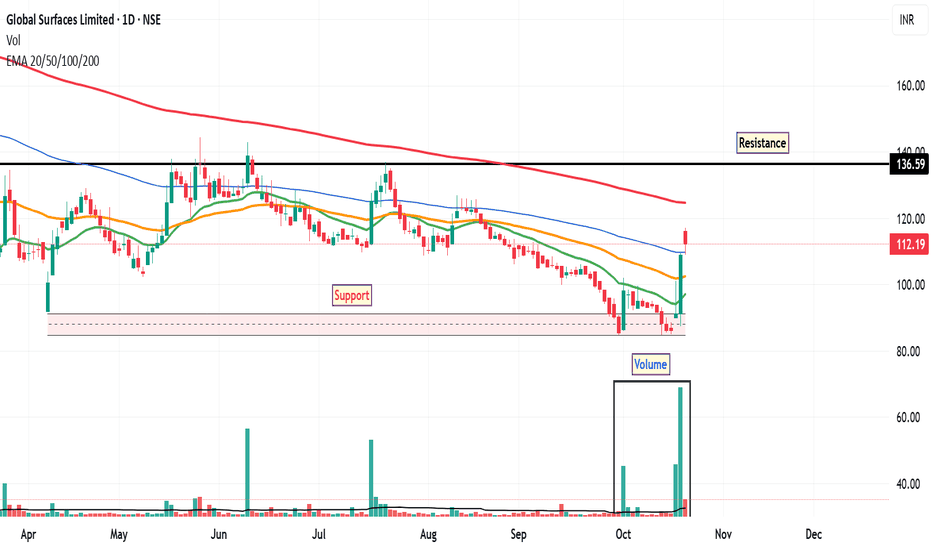
GSLSU: Trend Reversal Signals The stock of GSLSU has been in a sustained downtrend since May, revisiting its discount zone multiple times. However, recent price action suggests a possible shift in sentiment. On Friday, October 17, the daily chart printed an inverted hammer candlestick, a pattern often interpreted by technical analysts as a potential bullish reversal signal—especially when supported by volume and other indicators.
The inverted hammer on the daily timeframe may indicate buying interest at lower levels. This pattern gains significance when it appears after a prolonged downtrend and is accompanied by increased volume. The bullish signal is further supported by a rise in trading volume and a daily close above the 20-day, 50-day, and 100-day EMAs, suggesting short-term strength and potential trend reversal.
In the most recent trading session, the stock found support at the 100-day EMA and rebounded, reinforcing the validity of this level as a short-term base. The RSI has moved above 65, indicating increasing bullish momentum. This level is often seen as a sign of strengthening trend, though not yet in overbought territory.
If the stock sustains its upward movement, the next potential resistance level may be around ₹136 , based on previous price action. The discount zone near ₹84 may serve as a key support level. Traders often monitor such zones for invalidation of bullish setups or potential re-entry points.
Disclaimer: This analysis is intended for educational and informational purposes only. It does not constitute investment advice or a recommendation to buy, sell, or hold any financial instrument. Market participants should conduct their own research and consult with a licensed financial advisor before making any investment decisions.
RELIANCE AT A CRITICAL ZONEBeautiful Chart of Reliance in weekly timeframe and is at an interesting level from where it can go either side.
At weekly levels symmetrical formation of a rally for 3 weeks followed by a bearish engulfing and then crash.
Breakout
If Reliance breaks the high of 1580 the trend will be bullish and 2085 is in horizon in couple of months
Breakdown
If reliance breaks the level of 1535 and further breaks 1485 then it will go down again to the 1120 levels.
Time is of essence.
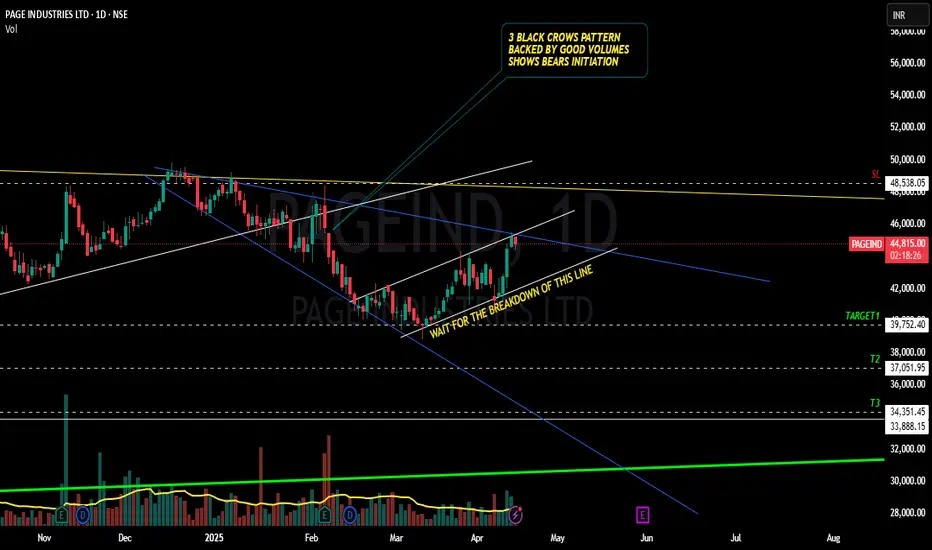
PAGEIND - BEARS READY TO TEAR JOCKEY DOWN TO 20% FALL???YES!!!!! Chart patterns made me think of the above titled opinion.
REASONS FOR MY IDEA
1.MONTHLY CANDLE BREAKDOWN WITH GOOD VOLUME
2. OCT 2022 Highs not tested even during 2024 bullish phase shows weakness
3. Weekly candle too shows a voluminous breakdown as shown below
4. 3 BLACK CROWS pattern in the daily time frame recently adds to the woes
5. I will mostly wait for the white trendline break for the entry.(though it is now at the resistance trendline , recent bullish candles may delay the down rally)
6. Given the sl , target are extreme levels.....will update after the white line breakdown.
LET THE MARKET DECIDE.....WE WILL WAIT AND WATCH!!!!!
This is just my opinion.....not a tip nor advice.
THANK YOU!!!!!!
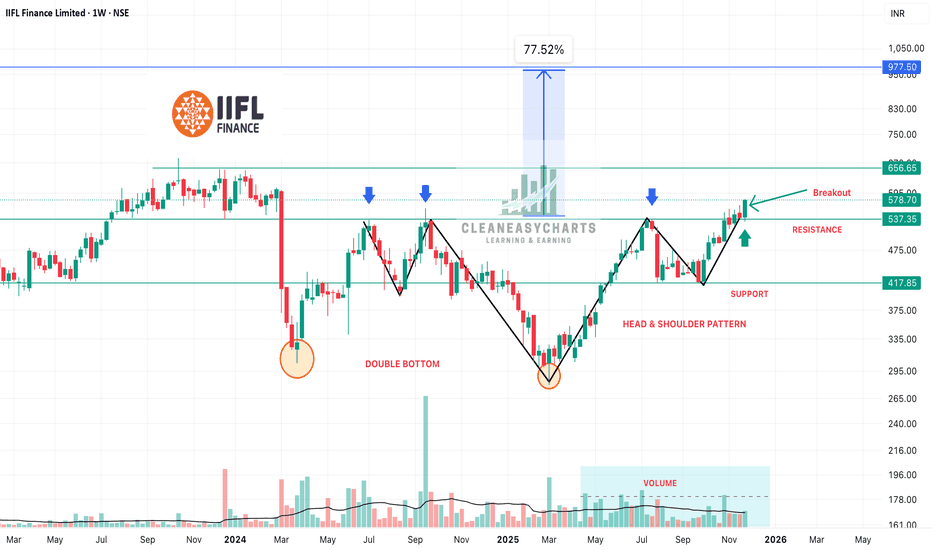
IIFL Finance - Double Bottom & Head & Shoulder PatternIIFL is read to rock by 70%-80% rise from current price on account of following:
1. 52% increase in QnQ profits
2. Double Bottom Pattern on Weekly Time Frame
3. Inverted Head & Shoulder Pattern on Weekly Time Frame
4. Weekly Breakout is already done - see last weeks candle
5. Volumes are steady
Keep following @Cleaneasycharts as we provide Right Stock at Right Time at Right Price.
Cheers!!!
#UNIVPHOTO: Reversal Alert at Falling Channel Midline!CMP: 286
UnivPhoto found support ✅ & bounced strongly off the mid-line of the falling channel (245–266 zone), forming a textbook Morning Star on the weekly chart — a classic bullish reversal! ⭐️🔥
Now testing key resistance 310–337 + downtrend line. A breakout could fuel a rally to 484 → 747/818 → 988 (ATH) 🚀🚀
Could this be the end of the multi-year downtrend? Watch closely! 👀✨
#UNIVPHOTO #MorningStar #CandleStickPattern #PriceAction #LongTerm #Investing
📌 #Disclaimer: This analysis is shared for educational purposes only. It is not a buy/sell recommendation. Please do your own research before making any trading decisions.
This week could be very decisive!!As we can see NIFTY couldn’t close itself and faced multiple rejections from 26000 levels which was both an important supply zone and psychological level. Hence if this weekly candle couldn’t close itself above 26000 level then we may see a sharp fall in NIFFTY so one should start getting cautious and only make new positions following the closing of this week’s candle so plan your trades accordingly.
26000 will act as a SUPPORT now!As we can see NIFTY managed to close itself above 26000 level which was both a strong resistance and psychological level and closes both in daily as well as weekly time frame. Hence, following the structure we can confirm the NIFTY’s breakout and we can expect NIFTY to take support at 26000 levels which previously acted as a resistance. So, one can plan their trades accordingly keeping SL on closing basis below 25800 .
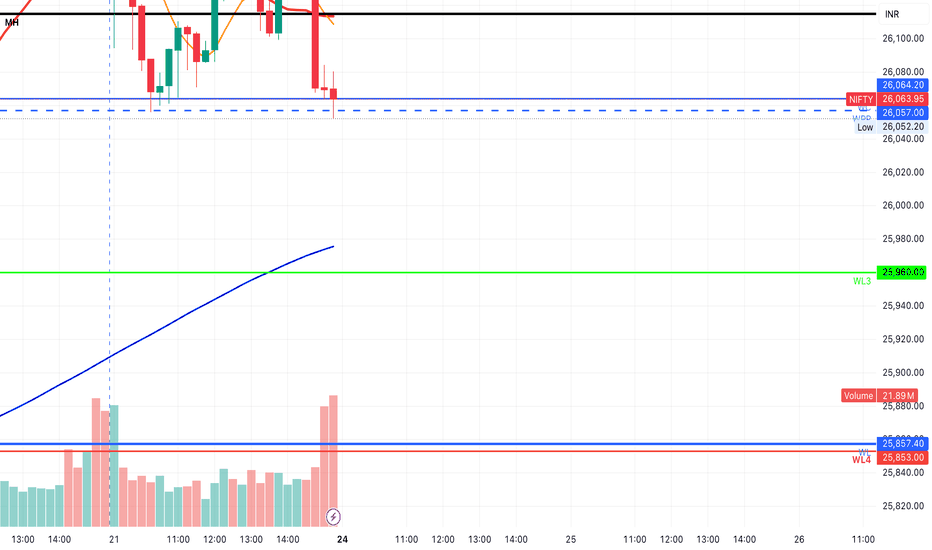
Bears Knocking, Then Reversal ? Weekly Wrap #Nifty50First Step of a successful trader is to build a Trade plan & review what he has done. (education purpose for all )
*Trend is rangbound, Short term Bearish.
*Trade plan: Sell on rise
* Critical Levels:
* Resistance:26135- 26200
* Support: 25960-25853
Jai Hind.
Disclaimer :
This video is only for educational purposes. Please consult your financial advisor before you take any trade.
Unidirectional move is yet to come! As we can see NIFTY has finally broken above 26100 level and has managed to close itself above the given level. Moreover it has broken the neckline of inverted head and shoulders pattern showing signs of strong upmove so plan your trades accordingly and keep watching everyone.
ICICIGI | High probable INHS setup - Looks good for 20-40%ICICIGI | High probable INHS setup - Looks good for 20-40%
CMP : 2006 (Dip : 1930)
SL : 1800
The stock has confirmed a classic inverted Head & Shoulders pattern on the daily chart, signaling a strong trend reversal.
✅ Breakout above neckline with decent volume, adding conviction to the move.
🎯 Immediate Target: 2300
🎯 Second Target (as per Fibonacci extension): 2700
📉 Pattern: Inverted H&S
📈 Volume: Supporting the breakout
📊 Bias: Bullish
This could be an excellent area of value for swing traders looking to ride the trend. A retest of the neckline could offer a second entry opportunity with a good risk-reward ratio.
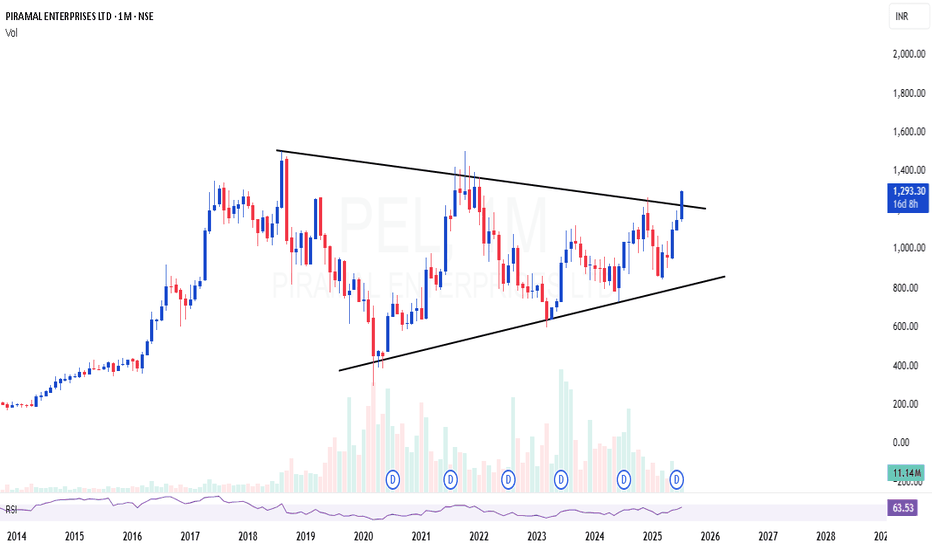
PEL | Triangle breakout after 7 years consolidationPEL | Triangle breakout after 7 years consolidation
CMP : 1293 (Dip : 1150)
SL : 1000
P
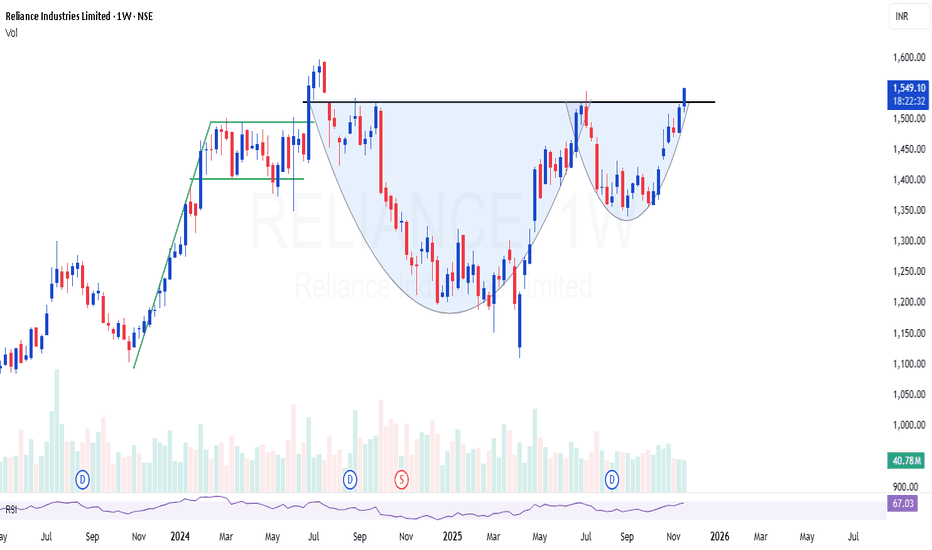
RELIANCE | Perfect cup & handle setup - Looks very strong 30%RELIANCE | Perfect cup & handle setup - Looks very strong for 30% short term
Last time the flag breakout disappointed, but this time Cup & handle will restore the faith i believe
Looks like 2026 is going to be a large cap year !
KOTAKBANK
RELIANCE
TCS
INFY
index heavy weights are super bullish
SBIN looking bullish on the weekly charts. (18/08/2025)State Bank of India is trading around the resistance zone after convincingly breaking the trendline and taking support from the weekly moving averages.
The stock has closed at 826.55 this week gaining 2.77% week on week.
If the stock starts trading above 833, there are chance of it travelling till 860 levels in the coming month.
SBIN has posted good result as well.
Major resistance :- 833, 865
Entry :- Above 833
SL :- Below 818
The stock looks bullish on the daily and the weekly charts.
Wait for the stock to close above the resistance levels on the daily chart frame.
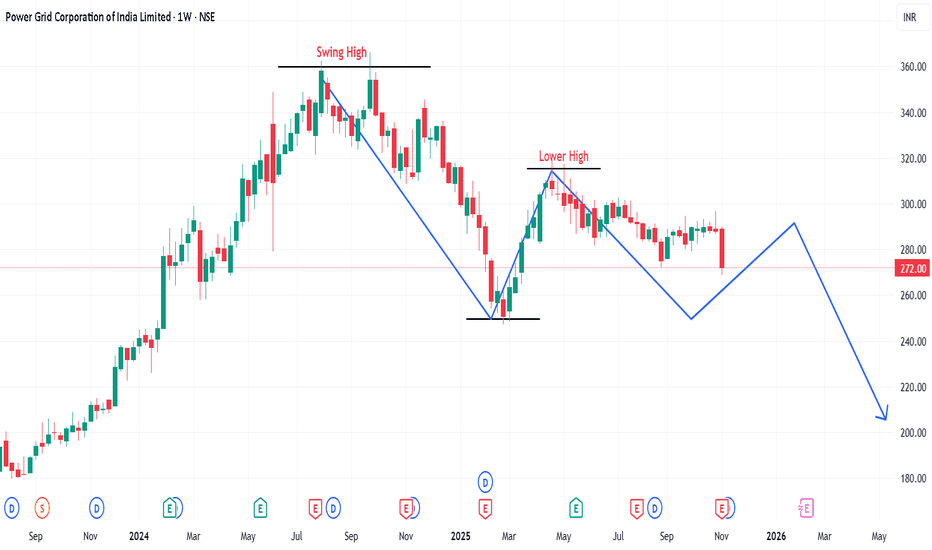
Will Powergrid showing sign of exiting it??Power Grid has been trading in a range for a while and it is showing sign of some weakness.
Major Trend - Down Trend
As there is a BoS of the previous market cycle.
Minor Trend - Sideway to range bound.
The market tends to retest the swing low in the coming month.
Stock has taken a strong resistance from 20 & 50 EMAs. Weekly close is below 100 EMA.
If the stock follow through the downside movement, entry for a sell trade is there with a 1:2 R:R ratio.
Entry :- 270
Stop Loss :- 279
Target :- 259
Last week the index too has supported the fall. If the index remains negative, full quantities can be punched around 270, in case of a retest half quantities can be sold around the retest and the price action near resistance levels while remaining quantity to be entered once the price action is in our favor.
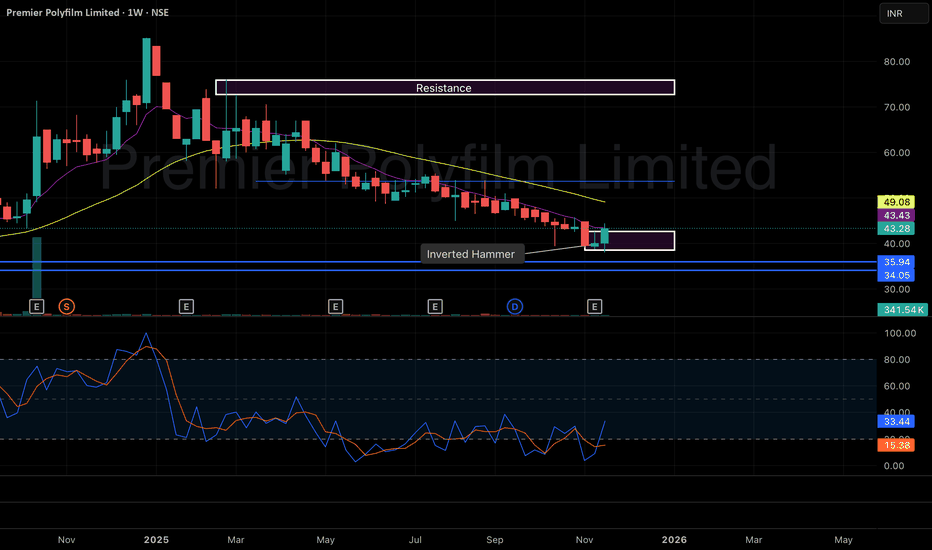
Premier Polyfilm Ltd – Inverted Hammer Reversal at Key SupportStrong Bullish Candle After Multi-Month Downtrend
Premier Polyfilm has printed a bullish Inverted Hammer at a major support zone after a prolonged decline — a classic early reversal signal on the weekly timeframe. The stock has been falling consistently for months, and this week’s sharp +12% bounce shows strong buying interest returning near the demand zone of ₹34–₹36.
Price is now closing above the minor resistance zone (₹40–₹43). If sustained, the stock may attempt a short-term trend reversal.
RSI also shows a bullish uptick from oversold territory, supporting the possibility of a relief rally.
🎯 Key Technical Levels
CMP: ₹43.00 (+12.33%)
Immediate Resistance: ₹49–₹52
Major Resistance Zone: ₹73–₹80
Support Zone: ₹34–₹36
Major Support: ₹30
Swing SL: Close below ₹35 (weekly basis)
📈 Technical View
A clean Inverted Hammer candle formed exactly at support → early reversal signal.
RSI bouncing sharply from oversold (14–20 range).
Price reclaiming the small demand zone around ₹40–₹43.
Trend is still down, but first signs of exhaustion are visible.
Sustaining above ₹43 could lead to a move toward the 20-week EMA and the ₹49–₹52 area.
🧠 View
Premier Polyfilm has shown its first strong bullish candle after several months of selling pressure. The combination of Inverted Hammer + support + RSI reversal makes this an early-stage reversal watch. A weekly close above ₹43 strengthens the case for upside toward ₹49–₹52, and potentially ₹70+ on a medium-term basis.
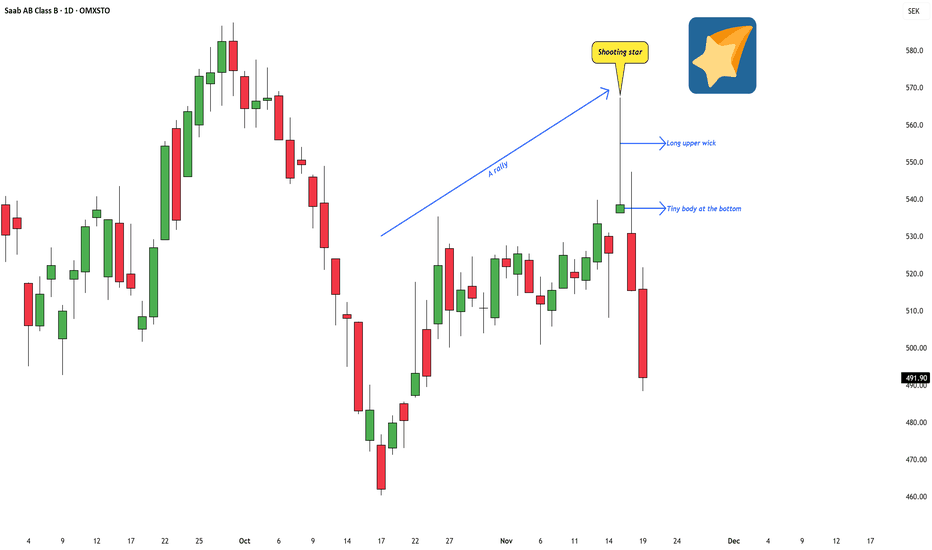
Identifying a Shooting Star Pattern on the ChartI was tracking a Swedish stock recently, and a very clean candlestick pattern popped up — a textbook shooting star.
The stock is Saab AB, a major Swedish company involved in military defense, commercial aviation, and civil security. Their operations span aircraft development, missile systems, naval platforms, surveillance systems, and a wide range of high-tech engineering services. In short, it’s one of Sweden’s core defense and aerospace names.
While going through the chart, this particular candle stood out because it matched the classic structure described in Japanese candlestick literature:
a tiny real body near the bottom,
a long upper wick,
and it formed after a short-term rally.
These are the key ingredients that define a shooting star.
From an educational perspective, the psychology behind this pattern is simple but powerful: the market pushed sharply higher during the session, could not sustain those higher levels, and slipped back toward the open. The candle itself captures that shift in momentum.
In classical candlestick theory, when a shooting star forms after an upswing , it often suggests that bullish strength may be fading and that the trend could be losing momentum. It doesn’t guarantee a reversal, but it does act as a visual warning sign — a moment where the advance pauses, hesitates, or becomes more vulnerable.
This post is simply to highlight how a shooting star looks on a real chart and what it typically represents in terms of market behaviour. No forecasts or trade ideas — just a clean educational example of the pattern in context.
$NVDA – Weekly Bearish Signal Triggering?CMP: $184
NVDA has formed a Bearish Engulfing on the weekly chart and is currently trading inside the engulfed candle.
A WCB / sustained break below $178.91 will confirm the pattern → likely dragging price toward $164 and the major $153–$148 breakout-retest zone . 🔻
A WCB above the ATH $212.19 will invalidate the pattern and signal a fresh uptrend. 🚀
📌 Note: Q3 earnings to be announced post-market. 🕒
Bias: Short-term bearish, HTF bullish if $148–$153 holds. 💚
#USMarket #NVDA #Stocks #TechnicalAnalysis #PriceAction #BearishEngulfing
📌 #Disclaimer: This analysis is shared for educational purposes only. It is not a buy/sell recommendation. Please do your own research before making any trading decisions.