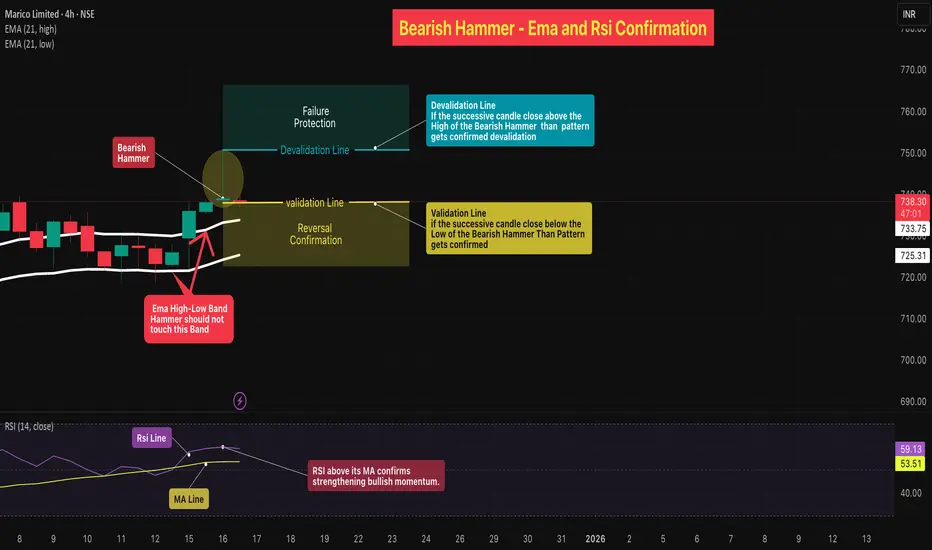
Bearish Hammer - Ema and Rsi Confirmation🔎 Overview
The Bearish Hammer with EMA and RSI Confirmation is a structure-based reversal setup that focuses on price rejection at higher levels, supported by EMA positioning and RSI behavior. This setup helps filter weak candles and highlights situations where selling pressure begins to emerge after an upward move.
────────────────────────────
📘 EMA & RSI
EMA (Exponential Moving Average)
• EMA represents short-term price balance and dynamic support/resistance.
• The EMA High–Low Band d
Candlestick Analysis
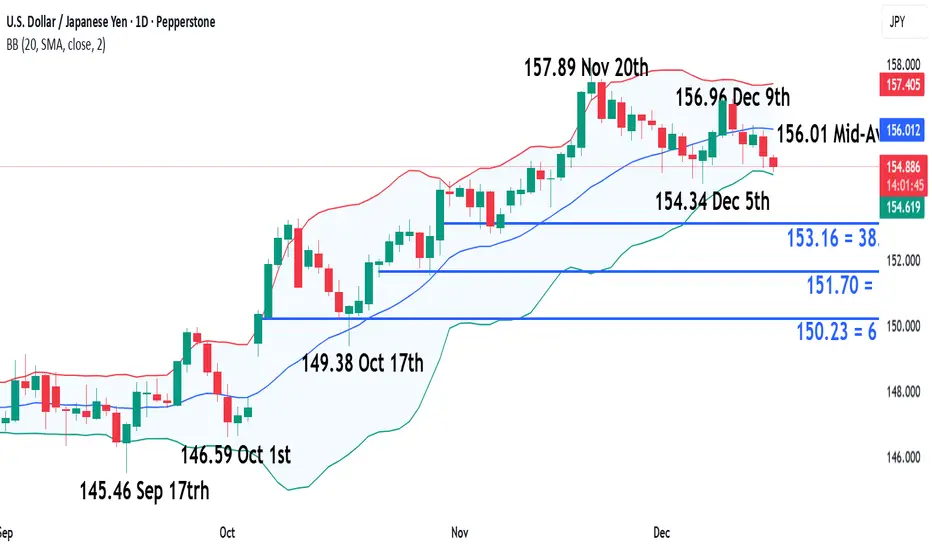
USDJPY – Potential for a Volatile End to the WeekIt’s the last full trading week of the year before the Christmas break but that doesn’t necessarily mean that FX markets will be quiet. The calendar is still packed full of important risk events, and when combined with the possibility for decreasing levels of liquidity into Friday’s close it could be a recipe for volatility.
Take USDJPY for example. It has already been the biggest mover in the G7 currency space with its fall from opening levels at 155.80 on Monday down to a low of 154.68 so fa
US 500 – Next Moves on a Knife EdgeIt’s often said that fear and greed underpin moves across financial markets and that was certainly the case for US indices at the end of last week.
Focusing on the US 500, prices first reacted positively to a Federal Reserve interest rate cut which was accompanied by a more dovish outlook than many traders had anticipated from Chairman Jerome Powell in the press conference. This added fuel to hopes for a Santa rally to end 2025, briefly taking the US 500 index up to its previous record highs o
Bank Nifty: Hanging Man Confirmed Despite Fed CutLast week, Bank Nifty printed a valid Hanging Man at the Wave (5) zone, signaling potential trend exhaustion near a key Fibonacci cluster. The setup was deliberately framed as a warning, with confirmation dependent on a close below the candle’s real body.
That condition has now been met.
This week delivered a weekly close below the Hanging Man’s real body , providing bearish confirmation per classical candlestick principles. Notably, this occurred despite supportive macro developments , incl
#ADANIPOWER – Double Top Danger Zone!📉⚡ #ADANIPOWER 🚨
ADANIPOWER has formed a monthly double top 🔝 near the 179–183 (ATH) zone and is now slipping toward its rising trendline 📉
Price is also trading inside the September monthly candle (182.70–120.00). MCB or sustained close below 120 will signal major weakness ⚠️👇
If selling continues, price may head toward 112.50–124, 92–96 , and the breakout retest supports at 83–87 .
Bulls must defend the trendline to avoid a deeper correction 🛡️🔥
Resistances: 151.20 / 179–183 (
What coming for Nifty weekly Expiry??Today nifty clearly was supported by the 20 EMA on the daily charts while it tested its 60 minutes 200 EMA.
Though both the moving averages has given support to the index on intraday basis. Still a fall is being seen in the market as the index closed 225 points lower.
Head & Shoulder pattern formation on the charts is there which seem to take support from the neckline. If the market remains beaarish and tend to breach the lower levels a clear support is around 25700-50 levels.
While a rising
Nifty 50 Price Structure Analysis [08/12/2025: Monday]Top-Down Nifty 50 Price Structure Analysis for 08th December 2025. The day is Monday.
(1) Monthly Time Frame:
Red paper umbrella candle. The body is smaller compared to the lower wick. So far, it is an indecisive market. The main trend is bullish, but the present scenario is indecisive. The major support zone is at 26100 and 26000. Major resistance is at 26300. The view is bullish to indecision.
(2) Weekly Time Frame:
Red paper umbrella candle. The body is smaller compared to the lower
Wave (5) Meets a Hanging Man: Trend Fatigue in Bank NiftyBank Nifty has printed a valid Hanging Man at the Wave (5) zone, right inside the 1–1.618 Fibonacci cluster. RSI is flattening near overbought, and the RBI’s Friday rate cut failed to extend the rally. This points to visible trend fatigue.
A reversal, however, will only be confirmed if next week closes below the Hanging Man’s real body.
Disclaimer: This analysis is for educational purposes only and does not constitute investment advice. Please do your own research (DYOR).
Rejection. Divergence. Confirmation? A Short Setup EmergingFeature, Detail
Price Signal: Shooting Star at the peak, showing clear rejection of higher prices and buyer exhaustion
Momentum Signal: Bearish RSI divergence — price made a higher high while RSI formed a lower peak
Consensus: Reversal candle + momentum divergence creates a high-probability pullback setup
Current Price: Trading near the 52-week high of ₹2,011, making the rejection zone psychologically significant
Bias: Short-term correction favored
Action: Enter only after confirmat
GSLSU: Trend Reversal Signals The stock of GSLSU has been in a sustained downtrend since May, revisiting its discount zone multiple times. However, recent price action suggests a possible shift in sentiment. On Friday, October 17, the daily chart printed an inverted hammer candlestick, a pattern often interpreted by technical analysts as a potential bullish reversal signal—especially when supported by volume and other indicators.
The inverted hammer on the daily timeframe may indicate buying interest at lower levels. This
RELIANCE AT A CRITICAL ZONEBeautiful Chart of Reliance in weekly timeframe and is at an interesting level from where it can go either side.
At weekly levels symmetrical formation of a rally for 3 weeks followed by a bearish engulfing and then crash.
Breakout
If Reliance breaks the high of 1580 the trend will be bullish and 2085 is in horizon in couple of months
Breakdown
If reliance breaks the level of 1535 and further breaks 1485 then it will go down again to the 1120 levels.
Time is of essence.
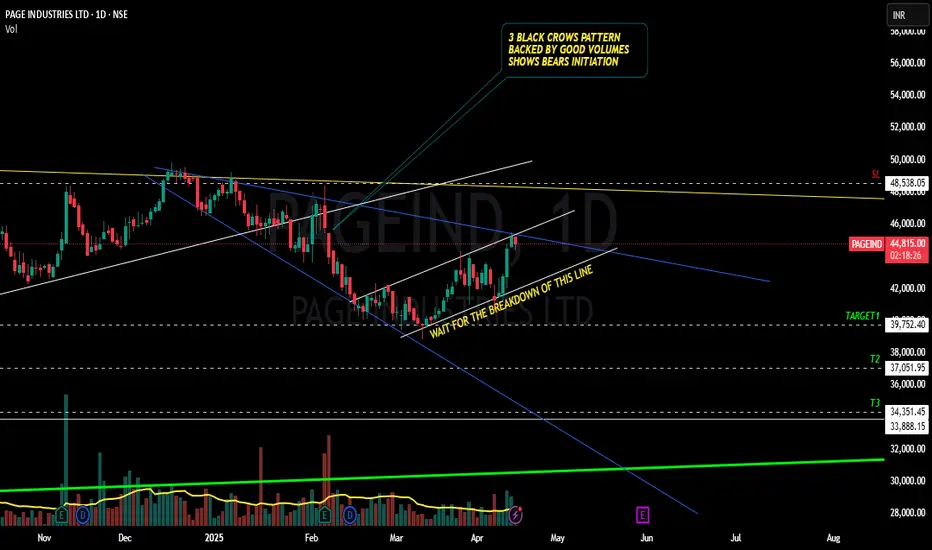
PAGEIND - BEARS READY TO TEAR JOCKEY DOWN TO 20% FALL???YES!!!!! Chart patterns made me think of the above titled opinion.
REASONS FOR MY IDEA
1.MONTHLY CANDLE BREAKDOWN WITH GOOD VOLUME
2. OCT 2022 Highs not tested even during 2024 bullish phase shows weakness
3. Weekly candle too shows a voluminous breakdown as shown below
4. 3 BLACK CROWS pattern in the daily time frame recently adds to the woes
5. I will mostly wait for the white trendline break for the entry.(though it is now at the resistance trendline , recent bullish candles may delay the
IIFL Finance - Double Bottom & Head & Shoulder PatternIIFL is read to rock by 70%-80% rise from current price on account of following:
1. 52% increase in QnQ profits
2. Double Bottom Pattern on Weekly Time Frame
3. Inverted Head & Shoulder Pattern on Weekly Time Frame
4. Weekly Breakout is already done - see last weeks candle
5. Volumes are steady
Keep following @Cleaneasycharts as we provide Right Stock at Right Time at Right Price.
Cheers!!!
#UNIVPHOTO: Reversal Alert at Falling Channel Midline!CMP: 286
UnivPhoto found support ✅ & bounced strongly off the mid-line of the falling channel (245–266 zone), forming a textbook Morning Star on the weekly chart — a classic bullish reversal! ⭐️🔥
Now testing key resistance 310–337 + downtrend line. A breakout could fuel a rally to 484 → 747/818 → 988 (ATH) 🚀🚀
Could this be the end of the multi-year downtrend? Watch closely! 👀✨
#UNIVPHOTO #MorningStar #CandleStickPattern #PriceAction #LongTerm #Investing
📌 #Disclaimer: This analys
This week could be very decisive!!As we can see NIFTY couldn’t close itself and faced multiple rejections from 26000 levels which was both an important supply zone and psychological level. Hence if this weekly candle couldn’t close itself above 26000 level then we may see a sharp fall in NIFFTY so one should start getting cautious and only make new positions following the closing of this week’s candle so plan your trades accordingly.