NIFTY heading towards 25500!!As we can see NIFTY started showing rejection exactly from 26000 level which is also a psychological level and had been falling unidirectionally ever since. Further we can't see any eminent SUPPORT but minor supports can be seen on previous swings around 25700 hence despite being weak, we may see temporary green candles for few trading sessions before finally falling towards 25500 levels which is its next psychological level and important SUPPORT and any signs of REVERSAL from this zone can sho
Candlestick Analysis
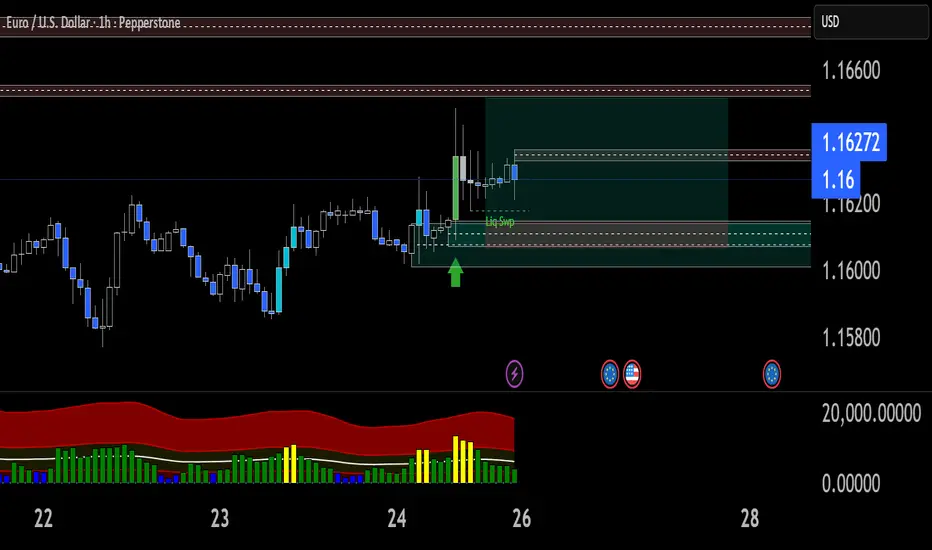
EUR/USD Bullish Setup – Liquidity Sweep & Break of StructureI’m sharing a long trade setup on EUR/USD based on a liquidity sweep and bullish market structure shift.
Price swept liquidity below the recent swing low and immediately showed strong bullish reaction, indicating absorption of sell-side liquidity. Following the sweep, price broke above short-term structure and retested the demand zone, confirming bullish intent.
I entered long at the retest of the demand area, with my stop-loss placed just below the liquidity sweep low to protect against inval
BTC USDTBitcoin is generating sell side liquidity. There is sign of rejections from top. Wait for Price to get into the supply zone and starting showing rejections in 4H, followed by 1H. Can take a deep retracement into supply. So I will wait till we have favourable sell conditions.
- Safe Entry. Wait for Daily rejection. Then wait fro 4H retracement. 4H rejection and we enter.
ICICI BANK ( 1D ) 🎯 TRADING PLAN 🎯
✔ Price Action shows strong support
At the 78.60% Fibonacci Retracement
With a Bullish Harami Candlestick
Pattern.
✔ RSI being Oversold adds weight to
The setup.
💡 Success in trading doesn't come from
Predicting the future ; it's come from
Disciplined decision making.
Disclaimer : All information is for
Educational & Informational
Purpose Only. Not a buy / se
XAUUSD LongFriday ending session setting the Directional bias for next week. Monday it can start with retracement to the demand zone and then continue to push up to target the external liquidity, which is Daily high or prevision trading day as well as day before that. Since both previous day made Equal high.
1. Daily closing with Big price rejection.
2. We have change of character in 1min, Leaving behind imbalance as well as Equal low.
TITAN - Bullish Reversal & Long-Term Growth StoryTITAN | Bullish Reversal & Long-Term Growth Story
Stock: Titan Company Ltd (NSE: TITAN)
Timeframe: Daily Chart
Pattern: Bullish Reversal from Key Support(Bullish Engulfing)
🏷️ Stock Intro
Titan is India’s leading lifestyle & jewellery retailer with brands like Tanishq, CaratLane and Fastrack. Strong brand equity and robust consumer demand keep Titan a long-term structural growth story.
🔎 Price Action
Current Price: ₹3,401.20
After a sharp fall from the 3,740 zone, Titan bounced off the bottom
Whirlpool (W) - A Bullish Reversal Faces Its First Major testAfter a significant downtrend, Whirlpool of India is now exhibiting strong signs of a bullish reversal, highlighted by a classic candlestick pattern and a powerful weekly surge. However, it has now arrived at a formidable resistance level that will determine if this new momentum can be sustained.
The Bullish Reversal Signals
The foundation for this potential turnaround has been building systematically:
- Higher Lows: The stock has begun forming a pattern of Higher Lows , indicating that
Silver: Bearish Engulfing – Is the Top In?#Silver View:
Just like Gold, Silver has formed a strong Bearish Engulfing pattern on the daily chart, potentially signaling a temporary top in the current trend. While it’s still early to confirm a full reversal, the price action suggests caution for bulls.
✅ Confirmation:
A daily close below 143,900
(today's low), especially with increased volume, would confirm the pattern and likely trigger further downside momentum.
❌ Negation:
If Silver manages to close above 153,388 (today
Gold: Bearish Engulfing – Is the Top In?Gold View:
Potential temporary top may be forming in Gold, marked by a strong Bearish Engulfing pattern on the daily chart. While it’s still early to confirm a full reversal, price action suggests caution for bulls.
✅ Confirmation:
A daily close below today's low 120,218 , especially with increased volume, would confirm the pattern and likely trigger further downside momentum.
❌ Negation:
If Gold manages to close above 123,677 (today’s high), the bearish structure will be invalida
TITAN COMPANY LIMITED ( 1D ) 🎯 TRADING PLAN 🎯
✔ Price Action shows strong
Resistance at the 61.80% Fibonacci
Retracement with a Bearish Harami
Candlestick Pattern.
✔ RSI being Overbought adds weight to
The setup.
💡 Trade your plan not your emotion.
Disclaimer : All information is for
Educational & Informational
Purpose only. Not a buy / sell
Recommendation. You are
Solel