Inside Bar Ignites a Clean Breakout🟢 Simple Breakout Structure | Supply-Demand Flip
✅ Strong demand zone formed after multiple rejections
🔻 Previous supply zone clearly respected
📉 One active counter-trendline broken
🔍 Breakout of mother candle with an inside bar setup
📈 Volume expansion on breakout
🟠 Also broke a hidden resistance line, adding confluence
🧭 Chart structure remains smooth and clear, respecting zones well
No predictions. Just structure.
Candlestick Analysis
We Might See 25000 Level Testing in Nifty Today's price action in NSE:NIFTY formed a classic Supply Candle—indicating strong seller dominance with hardly any buying interest throughout the session.
Heading into tomorrow, we are likely to witness one of two potential scenarios:
Scenario 1:
We may open with a gap-down, driven by the pressure of today’s supply. If that happens, expect the opening to be below 25285.
In this case, avoid buying the dip. Instead, look to sell on any intraday bounce near 25333.
Scenario 2:
Alternatively
EMAMI LTD – Strong Bullish Breakout | Volume Spike________________________________________________________________________________
📈 EMAMI LTD – Strong Bullish Breakout | Volume Spike | Structure-Based Trade Idea
🕒 Chart Type: Daily Chart
📆 Date: July 9, 2025
________________________________________________________________________________
📌 Price Action:
EMAMI LTD has delivered a decisive breakout from its recent compression phase after trading sideways between 570–585 for several sessions. On July 9, the stock posted a wide-range bullish candl
PG ELECTROPLAST – Volume Breakout from Tight Base________________________________________________________________________________
📈 PG ELECTROPLAST – Volume Breakout from Tight Base | Bullish Momentum Brewing
🕒 Chart Type: Daily Chart
📆 Date: July 9, 2025
________________________________________________________________________________
📌 Price Action:
PG ELECTROPLAST LTD has shown an impressive breakout from a tight base, rising from the 735–755 congestion zone with a wide-range bullish candle on July 9. The candle had an open = low structure,
TARC: Swing Pick (Breakout Candidate)#Tarc #swingtrade #threewhitesoldiers #fvg #fairvaluegaps #trendingstock #breakoutstock
TARC : Breakout Candidate
>> Up-trending stock
>> TWS Visible
>> Bounce back from FVG
>> Trending setup
>> Good Volume & Strength
>> Risk Reward Favorable
Swing Traders can lock profit at 10% and keep Trailing
Please Boost, comment and follow us for more Learnings.
Disc : Charts shared are for learning purpose only, not a Trade recommendation. Do your own research and consult your financial advisor before
BRITANNIA INDUSTRIES LTD. – TECHNICAL INSIGHT________________________________________________________________________________
📊 BRITANNIA INDUSTRIES LTD. – TECHNICAL INSIGHT
📆 Date: July 8, 2025 | 🕒 Daily Chart
📍 Symbol: NSE: BRITANNIA
💡 Educational Breakdown – For Study & Learning Only
________________________________________________________________________________
🔹 Price Action Overview:
Britannia closed at ₹5,884.00, up by +1.95%, forming an “Above the Stomach” bullish continuation pattern just below a key resistance zone.
____________
XAUUSD | Expected Swing Movement 07/07/2025Hi,
I am sharing my view on XAUUSD swing movement. After series of consolidation at current level. If gold breaks 3315 and retest the 3306 to 3308 with pullback, it can show sharp upside move upto 3336 to 3338 level where major we can see major supply.
Disclaimer: This is only for educational purpose.
Thanks
UNITED BREWERIES LTD. (UBL) – Bullish Setup from Demand Zone📈 UNITED BREWERIES LTD. (UBL) – Bullish Setup from Demand Zone | Price Action + Volume Analysis
🕒 Chart Type: Daily
📆 Date: July 3, 2025
🔍 What’s Catching Our Eye:
UBL has printed a strong bullish engulfing candle from the bottom range of ₹1,848, a zone that has historically acted as demand support. This move is happening after multiple tight sessions, suggesting potential breakout energy. While the candle shows strength, volume is unusually low, indicating the need for confirmation before high
Marubozu Candlestick Pattern.....The Marubozu is a unique and powerful single candlestick pattern that signals strong momentum in the market.
📌 What is a Marubozu?
A Marubozu candlestick has "no wicks or small wicks" — just a full body from open to close. This shows that the buyers or sellers were in complete control during that period.
🔵 Bullish Marubozu
A Bullish Marubozu opens at the low and closes at the high, showing strong buying pressure. It often appears at the beginning of a bullish move or during a breakout.
Gallantt Ispat Ltd - Up Flag PatternGallantt Ispat Ltd. displays a strong bullish setup with multiple confluences suggesting potential upside:
📊 Technical Analysis Summary:
✅ 1. Bullish Flag / Pennant Pattern
After a strong uptrend (flagpole), the price is consolidating in a tight descending channel, forming a bullish pennant.
These patterns are continuation setups, and a breakout above the upper trendline usually signals a resumption of the uptrend.
✅ 2. Volume Spike
There is a clear increase in volume, confirming institutiona
Precision Meets Patience | SAKSOFT Chart WTF🔻 A clean Control Trendline (CT) drawn from the all-time peak (🔺) on the Weekly Time Frame (WTF) shows a long-term price memory resistance finally getting tested.
📏 Overlapping that is a hidden horizontal resistance (⚪ dotted white line), representing the final hurdle before the stock can challenge the supply zone.
🟧 Mother Candle Structure: A powerful consolidation candle has now been broken with strength, giving us structure + intent in one move.
🔊 Volume speaks! We’ve seen two separate clu
ITC will start going downwards soonTECHNICAL INDICATORS -
DOUBLE TOP PATTERN :
Recently NSE:ITC has formed a double top pattern indicating strong bearish potential for the stock
Double top is formed when 2 consecutive peaks are formed with a dip or low between them
HANGING MAN CANDLESTICK :
The stock has also formed a hanging man candlestick which denotes reversal of upward trend to downward trend
Hanging man is formed when a candlestick has long lower shadow and small upper body at the top
STRONG SUPPORT-R
HAVELLS | Pleasant set up - INHS & RSI divergenceHAVELLS | Pleasant set up - INHS & RSI divergence
Strong RSI divergence in daily time frame
Inverted Head & Shoulder setup also in visual
A small dip may be possible for 8-10% in this stock , as market (NIFTY) is over heated. But we can consider that as opportunity to scale up the position
CMP : 1550 (Dip : 1480)
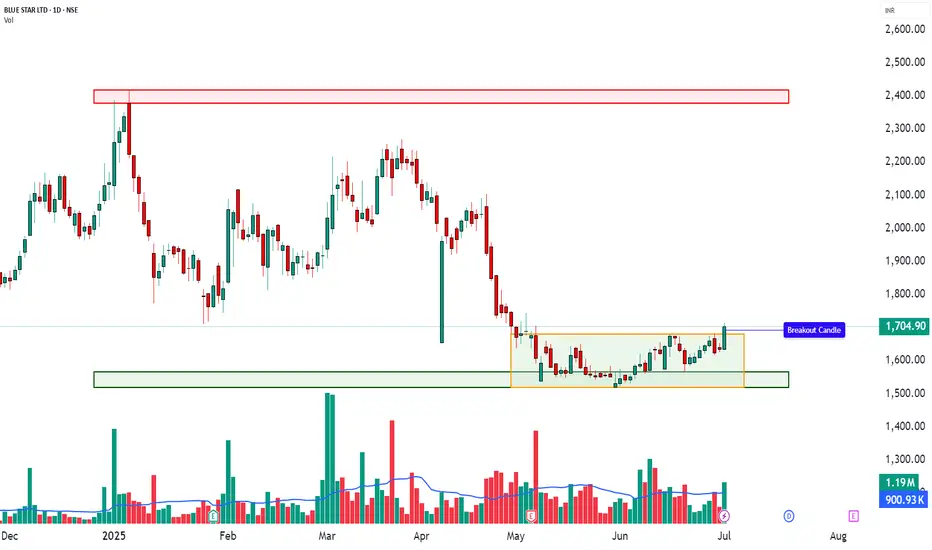
BLUE STAR LTD. – TECHNICAL ANALYSIS📈 BLUE STAR LTD. – TECHNICAL ANALYSIS
📆 Date: July 1, 2025 | ⏱ Timeframe: Daily Chart
🔍 Educational Breakdown – For Learning & Study Use Only
________________________________________________________________________________
🔹 Price Action Zones
• 🔴 Top Range (Resistance): 2417
• 🟢 Bottom Range (Support): 1521
________________________________________________________________________________
🔹 Chart Pattern: ✅
Rectangle/Box Consolidation Breakout – Price was range-bound in a tight zone and has given
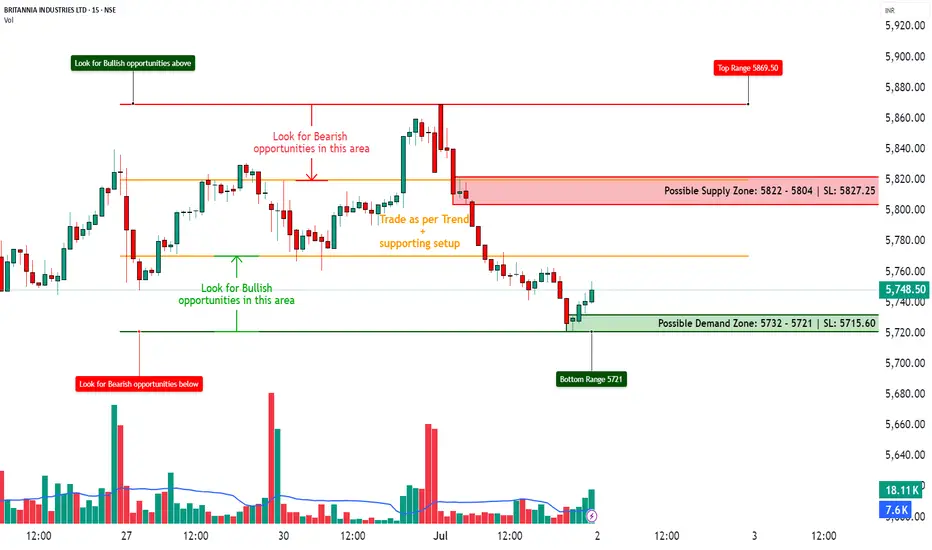
BRITANNIA INDUSTRIES LTD. – INTRADAY ZONE ANALYSIS📈 BRITANNIA INDUSTRIES LTD. – INTRADAY ZONE ANALYSIS
📆 Date: July 1, 2025 | ⏱ Timeframe: 15-Minute Chart
🔍 Educational Breakdown – For Learning & Study Use Only
________________________________________
🔹 Price Action Zones
🔴 Top Range (Resistance): ₹5869.50
🟢 Bottom Range (Support): ₹5721
⚪ Neutral Zone: Between ₹5732 – ₹5804 (No clear directional bias until breakout from either zone)
________________________________________
🧩 Chart Pattern: No
There’s no prominent chart pattern (e.g., flag, wed
Tweezer Top and Tweezer Bottom Candlestick PatternsTweezer Top and Tweezer Bottom are powerful reversal candlestick patterns often spotted at the end of trends.
🔻 Tweezer Top
Appears at the top of an uptrend. It consists of two consecutive candles with similar highs. The first candle is usually bullish, followed by a bearish candle of almost the same high, signaling a potential bearish reversal.
🔺 Tweezer Bottom
Appears at the bottom of a downtrend. It consists of two candles with matching lows. The first candle is bearish, followed by a bull
MEDIASSIST | High probable setup - Looks good for 30%MEDIASSIST | High probable setup - Looks good for 30%
Technically, the stock is strong and recent news—like the Star Health deal—is positive. The coming lock-in expiry, however, could trigger volatility. With solid digital expansion but elevated valuation, it's likely attractively positioned yet not without risk.
CMP : 532 (Dip : 500)
SL : 470
Engulfing Candlestick Pattern Explainedthe engulfing candlestick pattern is a powerful price action signal used by traders to identify potential reversals in the market. it consists of two candles:
🟢 bullish engulfing
* occurs during a downtrend
* the first candle is bearish (red)
* the second candle is bullish (green) and completely engulfs the body of the first candle
* it signals a potential reversal to the upside
🔴 bearish engulfing
* occurs during an uptrend
* the first candle is bullish (green)
* the second candle is bearish