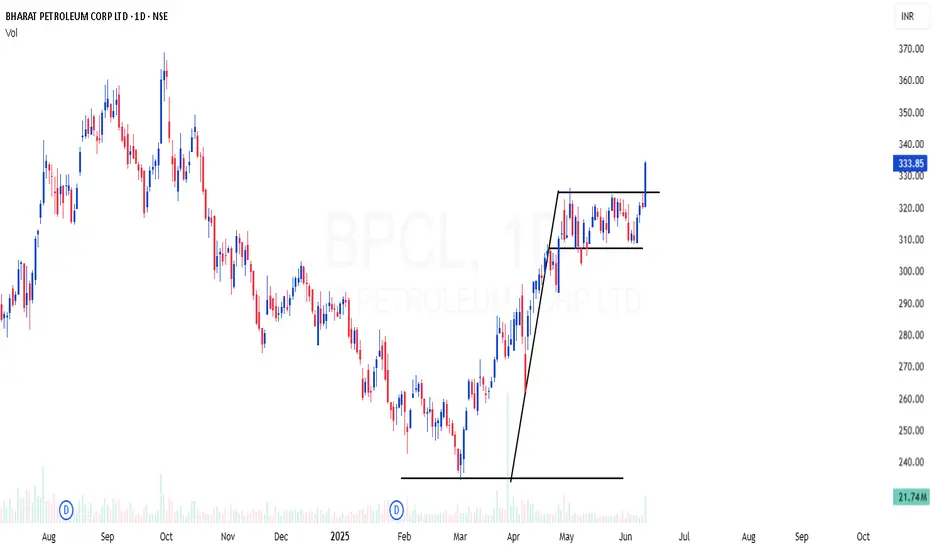
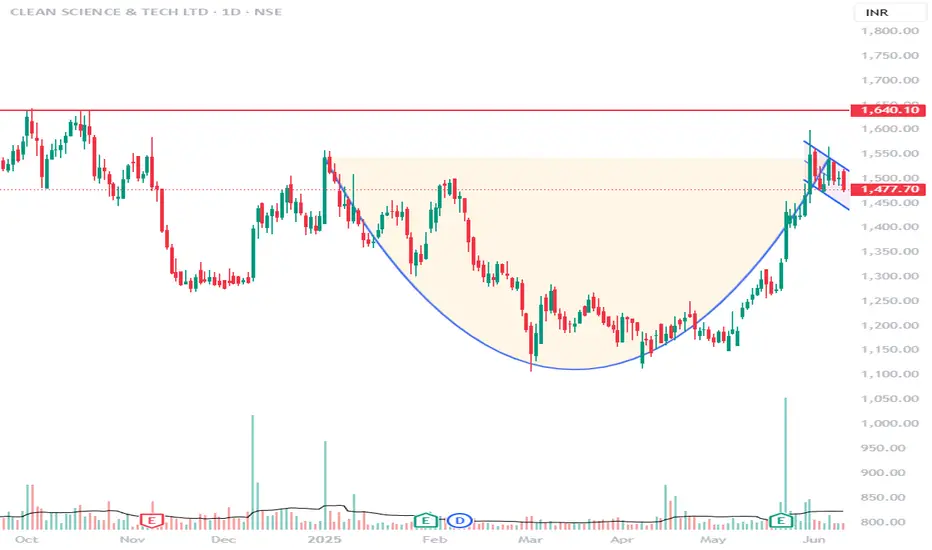
Bullish and Bearish harami candlestick patternthe harami pattern is a two-candle reversal formation seen on candlestick charts. it reflects indecision and a possible shift in momentum, making it useful for spotting early signs of a trend change.
🔵 bullish harami
this pattern forms during a downtrend. the first candle is a large bearish one, followed by a smaller bullish candle that fits completely within the body of the first candle. this shows that selling pressure is weakening and a potential upward reversal may occur.
🔴 bearish har
Candlestick Analysis
Weekly CT Breakout + 200EMA Flip | GALAXYSURF Structure📉 Main CT Line (Dotted White)
A well-defined counter-trendline finally gave way after weeks of price compression. The breakout was clean, with a strong bullish candle closing decisively above it.
📊 Volume Confirmation
Breakout candle posted a solid spike in volume — the highest weekly volume in months. 💥
📈 200 EMA Broken (Blue Line)
Price has also cleared the 200-week EMA, a key dynamic resistance, now potentially flipping to support. 📉
🟧 Higher Timeframe Supply (Orange Line) / ⚪ (White Lines
BCHUSD Trendline Breakdown and RetestBCHUSD has broken its trendline on the 1-hour timeframe and has retested with a large doji and a subsequent inside candle.
This is a great bearish signal with the SL of the high of the Retest/Doji candle.
My target will be at the 222-225 level which is second trendline point.
Bandhan Bank June Futures at a crucial zone.Bandhan Bank is at a crucial zone for continued upward momentum after a steep fall towards the support zone. The bullish momentum today has been pretty strong, although the price is coming at a halt near the 178-179 range, upon the break of 179.5 and upwards, I expect the price to continue upto 183, 188 in the coming 2 weeks, and 200, 212 (upon extreme optimism and market’s current momentum).
Buy trade executed at 173.5.
Simplified Approach to read Candlesticks -Easy Candles ~ Part 1MARKETSCOM:OIL
Introduction
⦿ Candles form the basis of chart creation and analysis.
⦿ A weak foundation can destabilise your entire structure. This thread will clarify and simplify your understanding of price candles.
I use two types of candles on charts:
1. Momentum/trending candles
2. Ranging/trading candles
Understanding these eliminates the need to memorize complex candle names (e.g., Marubozu, Harami bullish) cause every candlestick pattern is formed with combination of these 2 can
OEducation
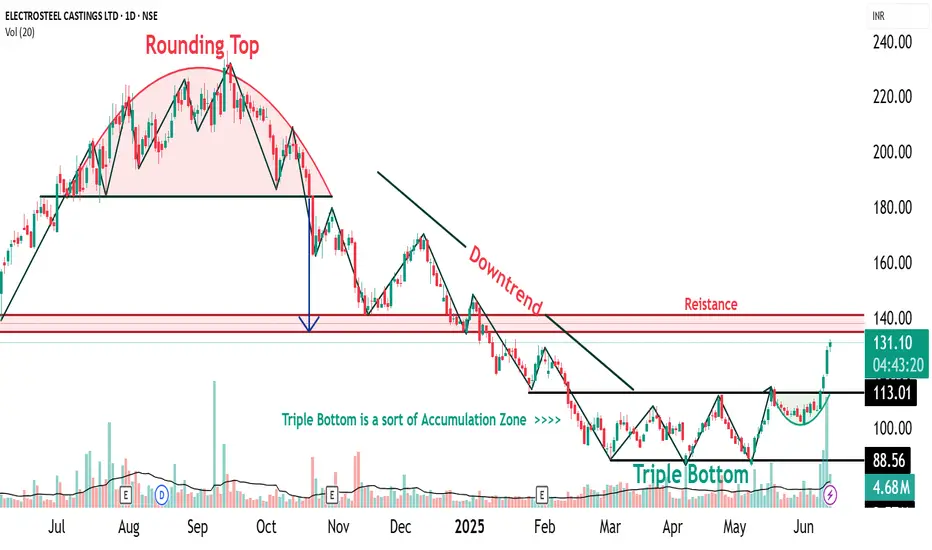
ELECTCAST Triple Bottom Pattern🔍 1. Understanding the Triple Bottom
The Triple Bottom is a classic bullish reversal pattern that typically forms after a prolonged downtrend or consolidation phase. It signifies strong buying interest at a consistent support level, leading to three distinct price lows (or “bottoms”) occurring near the same price zone.
📌 Key Characteristics:
Formation Time: Typically spans 2–6 months
Touchpoints: Three distinct lows formed at or near the same support level
Pattern Zone (for ELECTCAST):
ETH Traders — Late Long Setup Might Be Here
We're currently inside a descending channel on the 15-minute chart. What's interesting is:
The number of touches to the channel top is significantly higher than the bottom.
In the most recent move, price reacted strongly to the midline without even touching the channel bottom — suggesting buying pressure is stepping in early.
As price moved back toward the top of the channel, volume increased, which is a bullish sign.
This could be a good late-entry long setup for those who missed the earli
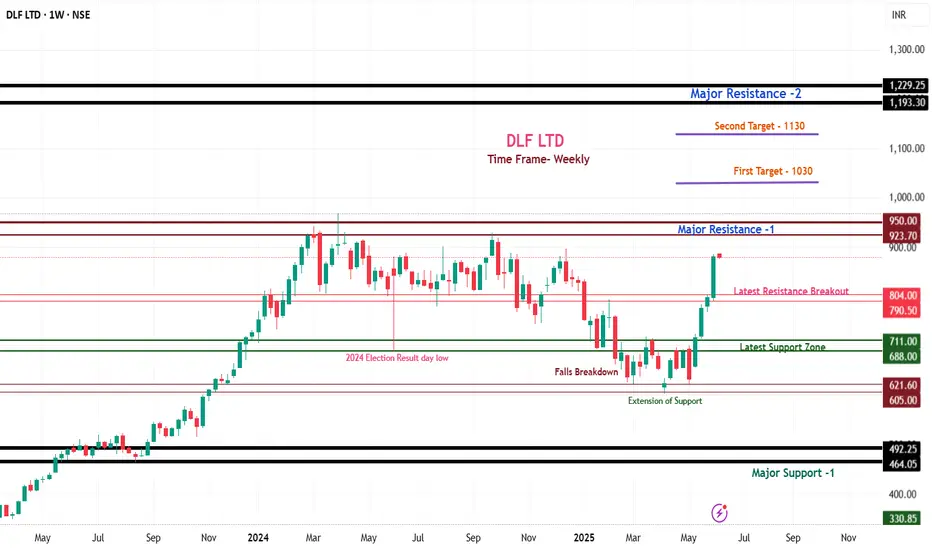
DLF Limited Technical Analysis & Trading Strategy DLF Limited – Weekly Chart Analysis (Technical View)
Company Background:
Founded in 1946, DLF Limited is India’s largest real estate developer, renowned for its premium residential and commercial projects.
With iconic developments and vast land holdings across Delhi-NCR, Mumbai, and Bengaluru, DLF is a dominant player in high-end real estate.
Core Business Segments
Commercial Properties: IT Parks, retail malls (e.g., DLF CyberHub, DLF Emporio), Grade-A offices.
Godrej Properties Chart Analysis: Bullish or Bearish Move Ahead? Godrej Properties – Chart Analysis & Trading Strategy
Company Background:
Godrej Properties, a branch of the renowned Godrej Group, began its journey in the real estate sector in 1990.
The company has gained recognition for its focus on innovative and sustainable construction methods.
It actively develops eco-friendly housing and commercial infrastructure projects, especially in the mid-income segment.
Core Business Areas
Residential Projects: Offers a wide range
Btc about to break all time high After hitting 1,12,000 BTC has shown some weakness and give low of 1,00,370 however in 4H and 1D time frame we can see Bull flag patterns and as i said in previous post it has also created inverse head and shoulder pattern in Daily time frame (target of 1,50,000). And now created bullish flag in that head and shoulder (Target of 1,35,000).
GOLD NEW HIGH!!!! BULLISH As per my view , today or tomorrow is the last chance for price to take off.
If the price takes off ,then in one or two weeks , it will reach new all time high.
If today or tomorrow is firm bearish means then, it will fall for sometime.
Former is likely to happen. I am going to a trade in XAUUSD today( buy).
take a trade in 1 hour timeframe and do a big swing trade today.
I feel a opportunity to swing gold.
Comment your thoughts and like if you likes.
BTC Just Chose Its Side - The Silent Confirmation....The structure has shifted.
Price didn’t shout — it whispered.
It crossed the threshold silently… a confirmation only visible to those who understand structure without indicators, without noise.
This isn't a pump.
It's alignment.
The mark I’ve drawn is not support — it’s the echo of decision.
A place where buyers proved their intent without needing volume to scream.
Now, above that line — the bias is bullish.
Not because of emotion, not because of hope —
but because price has shown commitment
LT Foods - All Time High Break OutLT Foods has given a all time high BO and is looking great. Factors which make this stock promising:
1. On weekly time frame made 3 White Shoulder Pattern - which is a bullish pattern
2. Breakout after a long consolidation - consolidating from 11 odd months
3. Volume is increasing / steady
4. A rectangular pattern BO as well
5. Fundamentally, LT Foods has lots of opportunities as they have gone beyond India
6. LT Food has ventured in organic food as well with recent 17% acquisition of Nature