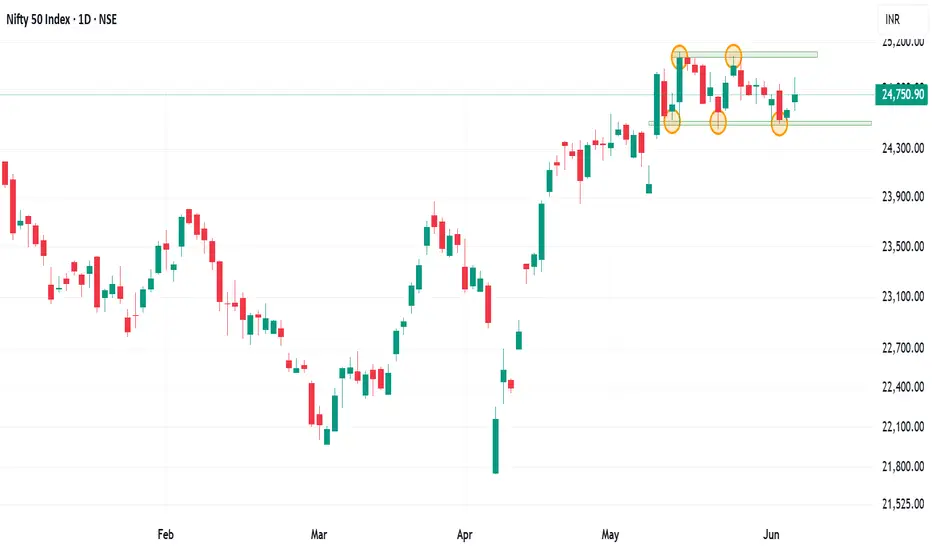
Outlook on nifty 50 for the next week. Is it going trending?Nifty 50 on the daily chart is trading in a range and has respected the zone quite effectively.
Index has remained sideways since a 3.82% move on 12th may. Market trade in cycle and after a sideways cycle, a trending market is predicted.
Either side movement can be seen in the index as 18 bars or 24 days it has remained in the range.
Major Resistance :- 25125, 25500
Major support :- 24500, 23930
This 600 range and change into same range of trending market.
Even the moving averages are coi
Candlestick Analysis
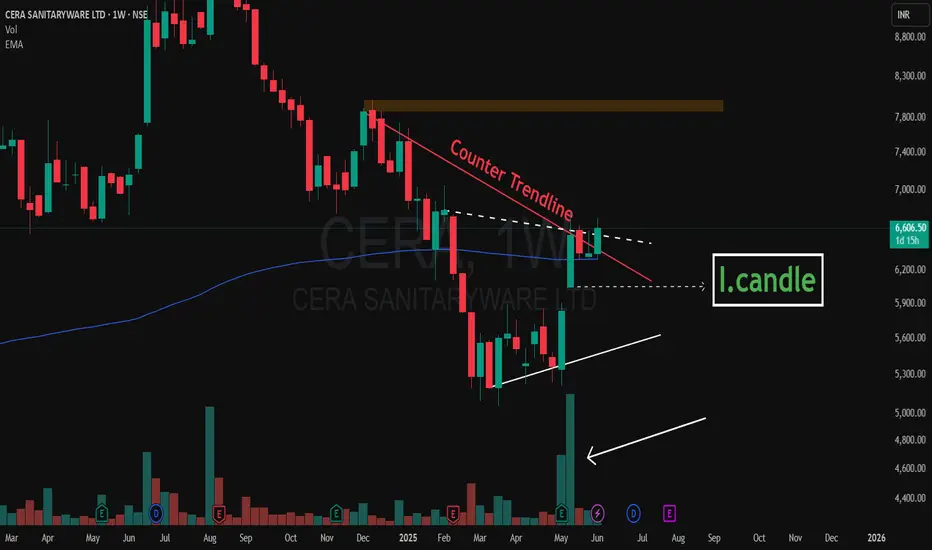
Inside Bars After High Volume – CERA Setting Up Near Key CT📌 Timeframe: Weekly (WTF)
📌 Type: Technical Observation / Swing Structure
📌 Concept: Counter Trendline Breakout Setup
CERA is currently navigating a highly constructive zone from a swing trading lens. Here's what's developing technically:
🔹 Higher Low Formation:
The stock has established a higher low structure, with the white internal trendline offering visible support across recent weeks. Interestingly, this aligns perfectly with the 200-period EMA on the weekly timeframe, enhancing its signi
Radico Khaitan at a Crossroads: Support, Resistance & MomentumThe stock is in a bullish trend and is forming a box consolidation and break outs.
On the weekly charts the stock is trading around the resistance zone and there are chance of either breaking out or retesting to the lower levels.
Stock seems strong bullish on the charts but indicators are suggesting a bearish move as the stock is around the resistance zone.
Short sell can be initiated in the stock with a strict SL.
On the bullish side the stock is respecting the monthly 20 EMA and has retes
MOL | Breakout Above Supply Zone | Flag + 200 EMA ConfluenceMOL | Strong Breakout Above Supply Zone | Flag + 200 EMA Confluence
Previously shared around the ₹70 level — now showing clear strength with a decisive breakout above the supply zone, backed by strong volume.
✅ Breakout Confirmation: Price has convincingly breached previous resistance, which now acts as support. The volume accompanying this move adds weight to the breakout.
📈 Flag Formation (Daily Timeframe): A clean bull flag is visible on the daily chart — a classic continuation pattern ind
SBIN : Swing Trade#SBIN #swingtrade #threewhitesoldier #trendingsetup #breakoutstock #momentumstock
SBIN : Swing Trade
>> TWS Visible
>> Trending setup
>> Cup and Handle formation
>> Breakout Candidate
>> Good Strength & Volume
>> Good Risk Reward Trade
Swing Traders can lock profit at 10% and keep trailing
Disc : Charts shared are for Learning purpose not a Trade recommendation.
Consult a SEBI Registered Advisor before taking position in it.
CHALET Hotels : Swing pick#CHALET #swingtrade #breakout #threewhitesoldiers #trendingstock
CHALET : Swing Trade
>> TWS Visible
>> Trending Setup
>> Good Strength in Stock
>> Volumes Dried up, Expansion imminent
>> Quick 10-15% upside potential
Swing Traders can lock profit at 10% & Keep Trailing
Disc : Charts shared are for Learning purpose and not a Trade recommendation. Consult a SEBI Registered Advisor before taking position in it.
NetApp Inc shows bullish candlestick in larger timeframeNASDAQ:NTAP price action shows bullish candlestick pattern in the Monthly Chart. As well as in Weekly chart, it shows steady rejection and showing a sideways consolidating trend.
Lets analyze first weekly timeframe:
We can see during April'25 (Tariff Trauma weeks) the price made a low of $74, breaching down the $80 mark.
But within one week it again regains back the strong, historical demand zone of $80 and continue it's upsurge towards $100. It made a recent weekly high of $102.
ABB India Ltd (NSE: ABB) LONG**ABB India Ltd (NSE: ABB)**:
**Chart Analysis**
* **Trendline Support:** The stock has been respecting a long-term rising trendline since mid-2020.
* **Recent Reversal:** A bullish engulfing candle has formed near this trendline support in the latest month (May 2025), closing at ₹5,960 with a **+7.92% gain**.
* **Correction Phase:** The stock has corrected significantly from the all-time high around ₹9,179 (marked with a dashed blue line).
* **Support Held:** The recent low aligns well with
Chambal Fertilizers – High RR Trade Setup FormingChambal Fertilizers price has dropped sharply and is now reacting from a strong demand zone between ₹570–₹579, which earlier acted as a base for a major rally. This area has been respected in the past and shows signs of absorption.
Today’s candle shows a pause in selling, hinting at a possible reversal.
Entry is taken near ₹594 with tight risk below ₹570 (marked invalidation zone).
If demand steps in upside targets are minor resistance around 630,
TGT 1: ₹633 – major supply zone
TGT 2: ₹706
Cycle Conflict in BTC — Long Bias Despite Bearish Price Action📊 Cycle Structure:
⬆️ HWC (Higher Wave Cycle): Bullish
⬆️ MWC (Middle Wave Cycle): Bullish
🔁 LWC (Lower Wave Cycle): Ranging (Neutral, no clear direction)
📌 Always keep cycles in mind — they are key tools to understand both long-term and short-term trends and help us manage risk better.
📉 Price Action Inside the Channel:
Price is moving inside a defined channel.
We’ve seen about 6 touches to the channel bottom, but the 5th and 6th touches were weak and didn’t even reach the mid-channel line.