Candlestick Analysis
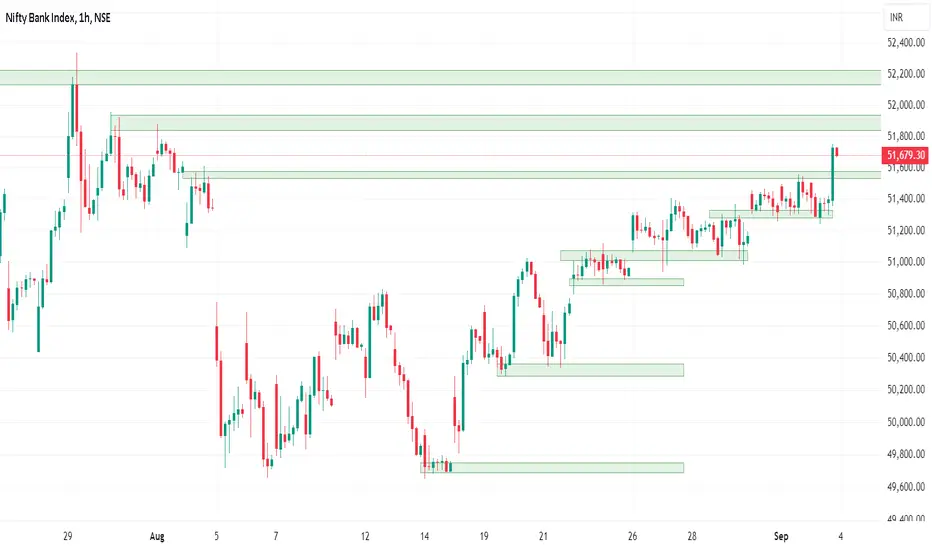
STRUCTURE vs DATA, who will win..?as we can see despite the break of rising wedge pattern, BANKNIFTY hasn't shown any significant downside move as we were expecting and remained sideways throughout the day after opening weak. Following the structure we can still expect bearishness for coming trading sessions but the DATA( option chain) shows huge OI build in OTM strike prices i.e 51500-52000 respectively which shows bullish bias largely hence unless the zones are breached, BANKNIFTY might remain bullish so plan your trades accor
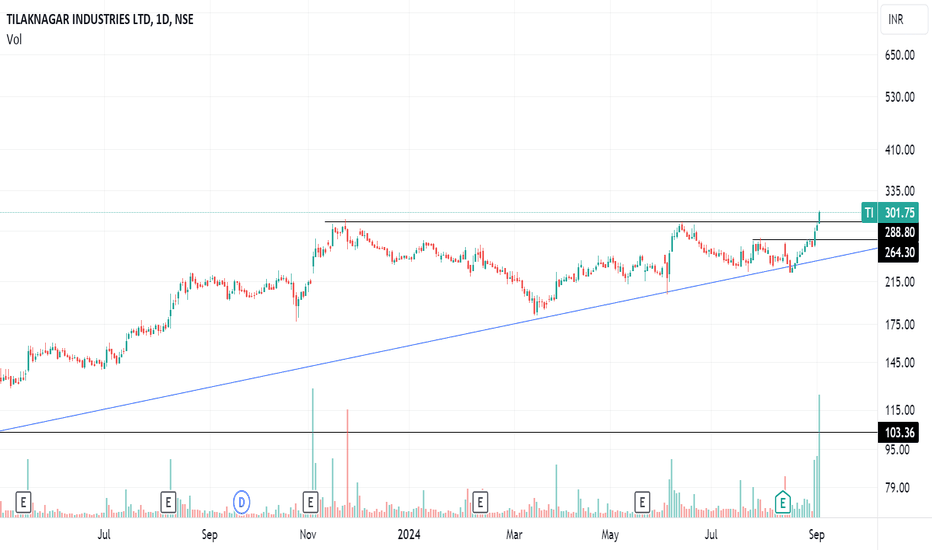
Tilaknagar IndustriesTI
Classical Ascending Triangle Pattern Breakout
Stock breaks the resistance at 290 levels and gave a close above 300 in daily timeframe today
Can be bought if it retraces to 285 - 295 levels in future for a better risk reward
Interesting Buying volumes can be seen from last two weeks
Banknifty weekly expiry analysis for 04/09/2024.Banknifty has been lagging behind and is still 1500-1700 points lower from its all time high.
The market in the final hour has given a nice upside rally and closed above the round number levels and the resistance zone.
An engulfing candle is formed on the daily charts and tomorrow is weekly expiry in the index. If there is a gap up opening there are chances of it giving a nice upside rally.
In case of a flat to slight gap down opening, a slaggishness can be seen as the makret is behaving now
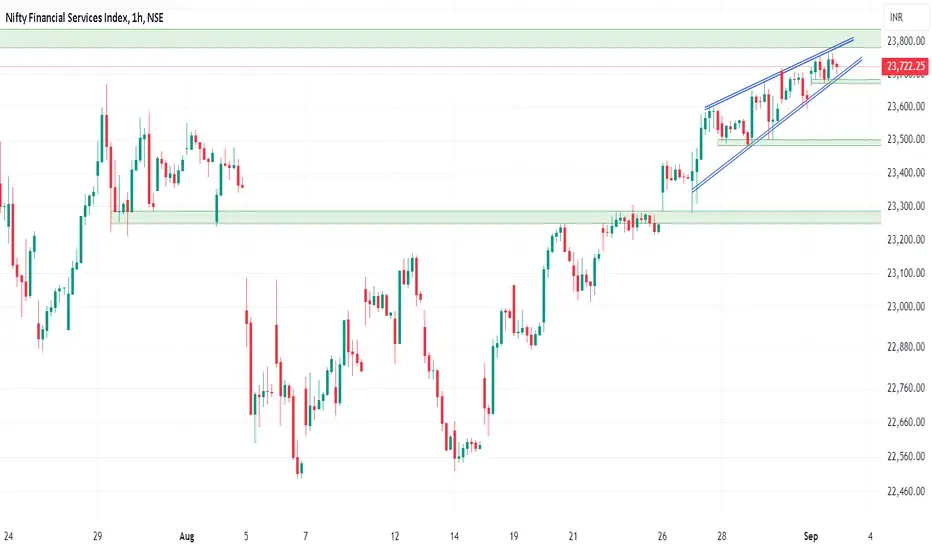
FinNifty weekly expiry analysis for 03/09/2024.Finnifty has been trading in a rising wedge pattern and is trading around the resistance zone of 23800.
For a while the market is being good for option seller and hitting option buyer hard. If the trend changes and market starts trading below 23680, a bearish trade can be entered with previous supports as targets.
In case the market give a break out of the resistance zone above, a small quantity trade can be initiated.
Major support zone is around 23280 and a quality bearish trade can be ente
Tour d'horizon paires Forex: GBPJPY/GBPCAD/EURCAD/USDCAD/USDCHFBonjour à toutes et à tous,
Petit tour d'horizon des paires forex citées dans le titre.
Horizon: swing moyen terme.
Le but de cette vidéo est de partager ma vision sur ces paires forex et d'obtenir vos retours constructifs.
Je ne fais pas la météo de la veille en disant: "il aurait fallu...".
Merci par avance de vos retours constructifs.
Que diriez vous d'échanger en live sur un créneau en fin de journée?
NB: Il ne s'agit en aucun cas de conseils en investissements.
Merci pour vos retours et
Nifty50 -15mins -Spinning top
Spinning Top Candlesticks
A spinning top occurring at the peak of an uptrend can signify that the bullish is losing track and the trend is about to reverse. However, when a spinning top is at the base of a downtrend, it is a sign that the bearish is losing control, and the bullish may take control
Did BANKNIFTY turn bullish..?As we can see slowly and steadily BANKNIFTY can be seen moving in uptrend, also has broken the trendline but can be seen in consolidation and indecisiveness which shows the breakout is not strong enough or buyers are not confident enough to make market move upwards hence till the zone is broken either side, the trend cannot be identified so plan your trades accordingly.
RELIANCE Levels // 4 HOURHello Everyone 👋
Employee Stock Option Plans (ESOPs): Ahead of its anticipated initial public offering (IPO), Reliance Retail granted ESOPs worth ₹351 crore to 15 senior executives during the last financial year. The company issued 4.417 million shares at ₹796.5 per share to top-level employees, demonstrating its commitment to retaining and rewarding key leadership.
Reliance Retail, owned by Mukesh Ambani, is India’s largest retailer, serving 304 million registered customers and welcoming over
Reliance Industry - Elliot Wave SetupSpotted a Elliot wave setup in Reliance Industry on a daily chart.
Currently the Point B is being active, today's AGM has a positive effect on the share price, making a green candle.
The target price for point C has been identified with fibonacci setup which is also in a perfect state covering point 4, 5, A, B, and C
A short position can be taken movement price start moving towards point C with target of around 2836 with stop loss at 3129
We can expect a bullish movement from the point of 3
XAUUSD Next Move Probability Lets See next week Gold analysis.
if the GOLD has sustained above the 2500 USD Support since printing its ATH last week.
if GOLD maintain an upward momentum, the price may expand upward, heading to the next psychological resistance at 2600 USD.
Conversely, failure to hold above 2500 USD could suggest a sideways continuation within the 2400-2500 USD.
ICICIBANK Levels For Intraday or swing TradingChart Overview:
Current Price: ₹1,226.351.
Recent Performance:
1 day: +1.08%
5 days: +4.19%
1 month: +3.05%
6 months: +17.57%
Year to date: +23.68%
1 year: +26.43%
5 years: +199.18%
Support and Resistance Levels:
Pivot Points:
Resistance 1 (R1): ₹1,245.82
Resistance 2 (R2): ₹1,259.55
Resistance 3 (R3): ₹1,273.28
Pivot Point: ₹1,234.98
Support 1 (S1): ₹1,221.25
Support 2 (S2): ₹1,207.52
Support 3 (S3): ₹1,193.79
SENSEX Levels For Intraday or swing TradingSupport & Resistance Levels:
Buy Above: 81,100 (SENSEX Spot Levels)
Targets: 81,225, 81,343, and 81,5551.
Sell Below: 81,000 (SENSEX Spot Levels)
Targets: 80,900, 80,729, and 80,5551.
Recent Analysis (August 22, 2024):
Sensex made an all-time high at 82,129.49 on August 1, 2024, at the open of the day.
It corrected one cycle down near the level of 77,968 and found support near the lowest vibration above the cycle level (actual low: 78,295.86).
The fall was swift and completed within 16 bar
IZMO : Breakout CandidateSwing Setup
IZMO : Risky Trade but worth it
>> Huge TWS Visible on the Left Side
>> Price currently near Bottom of TWS, Spike Expected
>> W pattern also visible which can breakout
>> Inside Bar forming at the Bottom of W pattern
>> Highlighted supply zone : Almost 12% till there
>> If Breaks Supply zone, Another 12% on cards
>> Trendline Breakout also coinciding with W pattern Breakout
>> SL u can consider 380 levels
Risky Trade but so much Learnings, Chart filled with lot of concepts..
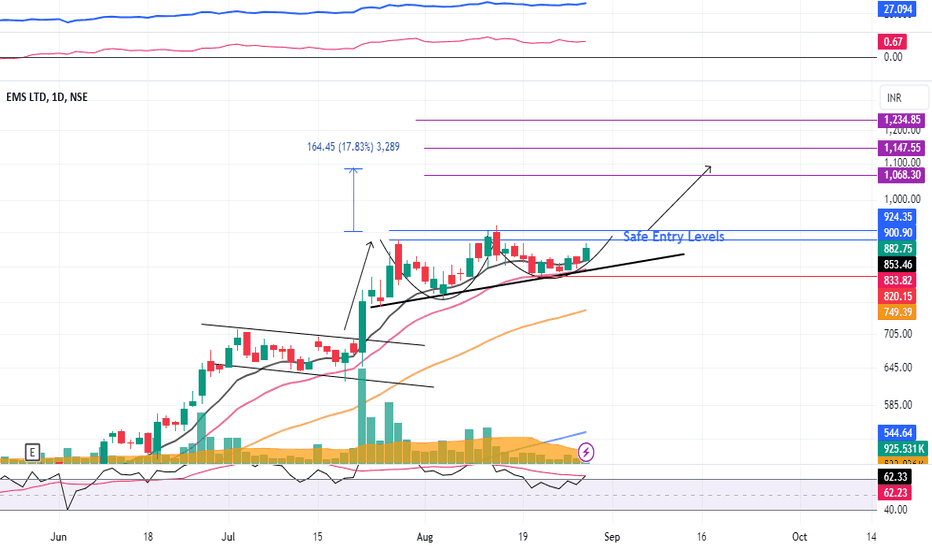
EMS Limited : Breakout Candidate#EMSLIMITED #breakoutstock #breakouttrading #vcppattern #asymmetricaltriangle #chartpatterns #TWS
EMS Ltd : Breakout Candidate
>> Ascending Triangle Pattern
>> VCP Pattern Visible
>> Good Strength & Volume may Expand in coming Days
>> Moving Avg Tending Setup
>> Low Risk High Reward Trade
As per the Setup it shud give a minimum upside of 15-17%.
Swing Traders can lock 10% profit & keep trailing
Please give a Boost or comment if u r Liking the analysis & Learning from it. Keep showing ur Lov