 Long
Long
 Long
Long
 Long
Long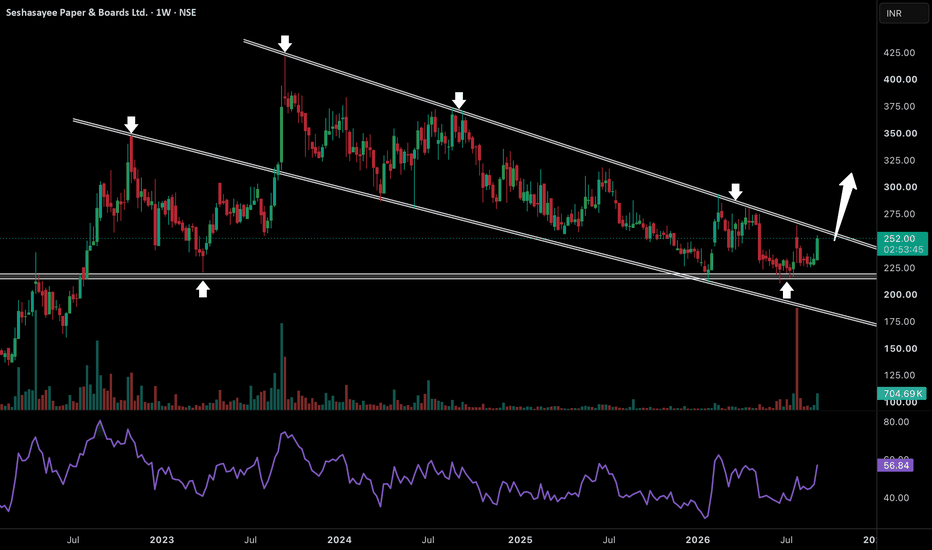
 Long
Long
 Long
Long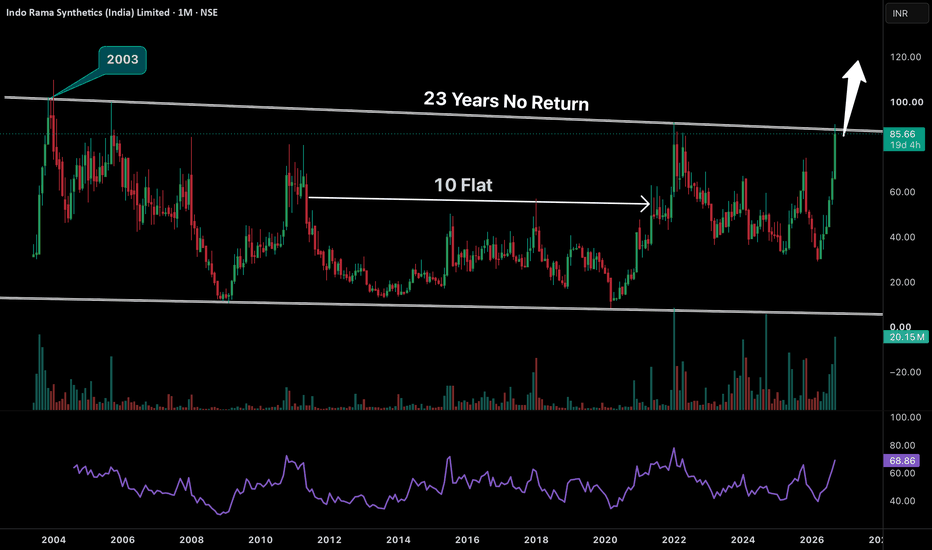
BTCUSDT: Buyers Are Defending the Bigger PictureBTCUSDT has already delivered a strong expansion higher. Now, instead of chasing the move, the market appears to be building a base before deciding on its next direction.
What catches my attention is where this consolidation is happening. Price is holding around a previous breakout area while the broader ascending channel remains intact. So far, sellers have managed to create a pullback, but they have not done enough to damage the bullish structure.
This makes the current support zone particularly important. If buyers continue absorbing selling pressure here, Bitcoin could regain momentum and begin pushing toward the upper side of the channel.
In that scenario, 83,000 becomes the next area I would watch, rather than simply a random upside target.
The idea remains straightforward: support holds, bullish structure survives, and buyers get another opportunity to take control. A decisive break below this base would be the first reason to question that outlook.  Long
Long
 Long
Long
 Short
Short
ELANTAS Technical Analysis & Setup
Symbol: ELANTAS (ELANTAS Beck India Limited) — Daily Timeframe (NSE)
Current Price: ₹14,428.00 (+0.76% intraday move)
Market Structure: Following a strong accumulation phase above the ₹11,500 base level, the stock printed a sharp bullish breakout candle to clear local consolidation resistance, maintaining strong momentum along the primary trend.
Key Technical Trade Levels
Entry Zone: ~₹14,313.00 – ₹14,431.00 (Breakout continuation level)
Stop Loss (SL): ₹13,181.00 (Defined risk level below the recent consolidation base support)
Immediate Target 1: ₹14,769.00 (Swing high level)
Intermediate Target 2: ₹17,735.00 (Horizontal projection level)
Macro Target 3: ₹18,815.00 (Upper green target channel projection)
Structural Base Low: ₹9,016.50
Trade Bias & Summary
The stock exhibits solid bullish expansion out of a high-tight consolidation structure. Holding support above the ₹13,181.00 level on daily closes keeps the setup favorable for downside-protected upside expansion toward testing intermediate resistance at ₹17,735.00 and extending toward the ₹18,815.00 macro target.
Disclaimer: This post is for educational and technical analysis purposes only and does not constitute financial or investment advice. Always manage your position sizing and risk control parameters responsibly.  Long
Long
This Resistance Has Survived Twice - The Third Attack Looks WeakRaymond is once again attacking the 750–780 major resistance zone, but this attempt looks much stronger. This same area rejected price sharply in both 2024 and 2025, creating a clear ceiling where sellers previously dominated. This time price has rallied from the 330–350 major support zone with a clean series of higher highs and higher lows, and it has reached resistance with strong momentum instead of showing immediate weakness. The latest expansion is also backed by a noticeable jump in volume, while RSI near 73 reflects the strength behind the move. Repeated testing of the same resistance can slowly absorb available supply, and liquidity sitting above these previous highs makes this zone even more important.
A clean breakout and sustain above 780 can change the entire structure. Once these equal major highs are taken out, sellers positioned around this resistance can get trapped, stop-loss liquidity above the highs can be triggered, and breakout buyers can add another layer of demand. After the breakout 750–780 can potentially flip from a multi-year resistance into support, with any successful retest making the structure even stronger. Above this zone there is much less visible historical resistance, giving price room for expansion toward the 1100–1150 zone, which is roughly 50%+ upside from current levels. Two previous attempts were rejected here if buyers finally absorb this supply, the third attack can unlock the biggest leg of the entire structure.  Long
Long
 Long
Long
Long

Long 
Short 
Long 
BTCUSD – Ascending Channel Holds, Buyers Eye Another Push Higher🔍 Market Overview
BTCUSD continues to trade inside a well-defined ascending channel on the 2H timeframe, keeping the broader recovery structure intact. The latest pullback has brought price back toward the lower half of the channel, where buyers have previously shown interest.
Despite the recent weakness, there is no clear structural breakdown yet. As long as the lower channel boundary continues to hold, the current decline can still be viewed as a pullback within a broader bullish structure rather than the start of a deeper reversal.
📈 Market Structure Details
Short-Term Trend: Bullish
Momentum: Recovering
Current Phase: Pullback → Support Test → Potential Continuation
The ascending channel remains the most important technical structure on the chart. Price has repeatedly rotated between its boundaries, with buyers stepping in near the lower portion of the range.
If demand returns during the current pullback, BTCUSD could begin another rotation toward the upper side of the channel.
🚀 Trading Scenarios
✅ Bullish Scenario — Preferred Setup
Conditions to watch:
The ascending channel remains intact.
Buyers continue to defend the lower channel structure.
The current pullback begins to lose bearish momentum.
Price starts rebuilding higher lows.
Trading Plan:
Look for buying opportunities after bullish confirmation near the lower channel area rather than chasing short-term rebounds. A strong reaction from this structure would support another move toward the upper channel boundary.
🎯 Main Target: 82,000–82,300
A sustained recovery through the middle of the channel would strengthen the bullish continuation scenario.
❌ Bullish Invalidation Conditions
Price decisively breaks below the ascending channel.
Buyers fail to defend the current pullback.
The recent market structure shifts into lower lows.
Selling momentum accelerates below channel support.
A confirmed breakdown below the channel would weaken the bullish thesis and increase the risk of a deeper correction.
📍 Key Levels to Watch
🟢 Main Target: 82,000–82,300
🔴 Key Area: Lower ascending channel support
⚠️ Trading Outlook
The current BTCUSD structure still favors buyers while price remains inside the ascending channel. The recent decline has weakened short-term momentum, but it has not yet damaged the broader structure.
For now, I favor a bullish recovery toward the upper channel area, provided buyers successfully defend the lower boundary.
The better approach is to wait for confirmation around support rather than trying to predict the exact bottom.
🧠 Professional Assessment
BTCUSD 2H – Ascending Channel Holds, Buyers Eye Another Push Higher
🔍 Market Overview
BTCUSD continues to trade inside a well-defined ascending channel on the 2H timeframe, keeping the broader recovery structure intact. The latest pullback has brought price back toward the lower half of the channel, where buyers have previously shown interest.
Despite the recent weakness, there is no clear structural breakdown yet. As long as the lower channel boundary continues to hold, the current decline can still be viewed as a pullback within a broader bullish structure rather than the start of a deeper reversal.
📈 Market Structure Details
Short-Term Trend: Bullish
Momentum: Recovering
Current Phase: Pullback → Support Test → Potential Continuation
The ascending channel remains the most important technical structure on the chart. Price has repeatedly rotated between its boundaries, with buyers stepping in near the lower portion of the range.
If demand returns during the current pullback, BTCUSD could begin another rotation toward the upper side of the channel.
🚀 Trading Scenarios
✅ Bullish Scenario — Preferred Setup
Conditions to watch:
The ascending channel remains intact.
Buyers continue to defend the lower channel structure.
The current pullback begins to lose bearish momentum.
Price starts rebuilding higher lows.
Trading Plan:
Look for buying opportunities after bullish confirmation near the lower channel area rather than chasing short-term rebounds. A strong reaction from this structure would support another move toward the upper channel boundary.
🎯 Main Target: 82,000–82,300
A sustained recovery through the middle of the channel would strengthen the bullish continuation scenario.
❌ Bullish Invalidation Conditions
Price decisively breaks below the ascending channel.
Buyers fail to defend the current pullback.
The recent market structure shifts into lower lows.
Selling momentum accelerates below channel support.
A confirmed breakdown below the channel would weaken the bullish thesis and increase the risk of a deeper correction.
📍 Key Levels to Watch
🟢 Main Target: 82,000–82,300
🔴 Key Area: Lower ascending channel support
⚠️ Trading Outlook
The current BTCUSD structure still favors buyers while price remains inside the ascending channel. The recent decline has weakened short-term momentum, but it has not yet damaged the broader structure.
For now, I favor a bullish recovery toward the upper channel area, provided buyers successfully defend the lower boundary.
The better approach is to wait for confirmation around support rather than trying to predict the exact bottom.
🧠 Professional Assessment
This setup is supported by:
Ascending channel remains intact.
Price is approaching a structurally important area.
The broader sequence still favors recovery.
Current weakness remains contained within the channel.
Upper channel resistance provides a clear upside objective.
Preferred approach: Wait for buyers to show clear strength around channel support before considering continuation opportunities.
🛡️ Risk Management
Risk only 1–2% of trading capital per position.
Define invalidation before entering.
Do not maintain the bullish thesis after a confirmed channel breakdown.
Avoid excessive leverage during volatile Bitcoin sessions.
Wait for confirmation instead of anticipating the reversal.
Disclaimer: This market analysis is provided for educational purposes only and should not be considered financial or investment advice.
This setup is supported by:
Ascending channel remains intact.
Price is approaching a structurally important area.
The broader sequence still favors recovery.
Current weakness remains contained within the channel.
Upper channel resistance provides a clear upside objective.
Preferred approach: Wait for buyers to show clear strength around channel support before considering continuation opportunities.
🛡️ Risk Management
Risk only 1–2% of trading capital per position.
Define invalidation before entering.
Do not maintain the bullish thesis after a confirmed channel breakdown.
Avoid excessive leverage during volatile Bitcoin sessions.
Wait for confirmation instead of anticipating the reversal.
Disclaimer: This market analysis is provided for educational purposes only and should not be considered financial or investment advice. Long 
BSE Ltd. (NSE: BSE) — Nearing Buy Zone: 1:10 Setup1. Technical Perspective
Timeframe Analysis (Daily - 1D): BSE continues to trade inside an expansive, multi-month primary ascending parallel channel. After facing rejection at the upper channel boundary (~₹4,400), the stock has retraced inside an orderly corrective falling wedge / channel.
Moving Averages & Key S/R: The price is actively entering the primary confluence demand zone (₹3,035 – ₹3,314):
Horizontal Breakout Retest: Prior major resistance shelf (~₹3,035) serves as structural support (Role Reversal).
Dynamic Trendline Base: The lower ascending channel boundary provides strong dynamic base support right under the current price action.
Volume Dynamics: Impulsive legs higher have been backed by significant volume surges, whereas this prolonged downward drift shows contracting, drying volume (1.74M), indicating healthy corrective absorption rather than aggressive institutional distribution.
2. Opportunity
Setup Classification: At Low of Correction / Channel Support Retest (Pre-Breakout)
Trade Rationale: Accumulating at the lower boundary of an established upward channel before the falling wedge breaks out provides an asymmetric risk-to-reward entry. Risk is tightly capped just below structural horizontal support.
3. Fundamental Perspective
NSE IPO Valuation Re-Rating Catalyst: The anticipated mega-listing of the National Stock Exchange (NSE) acts as a valuation benchmark for the Indian exchange landscape. BSE, as the prime listed market infrastructure proxy, stands to benefit from sector-wide multiple re-rating and institutional liquidity allocation.
Derivatives Volume & Market Share Growth: Continued traction in Sensex and Bankex weekly contracts expands BSE's high-margin index options market share.
Operating Leverage & Capital Market Tailwinds: Record retail demat accounts, expanding mutual fund SIP inflows, and active IPO listing pipelines create sustained revenue tailwinds with high operating margins.
4. Sector Index State
Sector Index: Nifty Financial Services / Capital Market Infrastructure
Index Health & Momentum: Capital market infrastructure businesses (exchanges, depositories, AMCs, RTAs) remain in a multi-year secular uptrend, seeing steady institutional accumulation during broader market pullbacks.
5. Trade Setup (TP & SL)
Buy Zone: ₹3,035.4 – ₹3,314.4 (Active zone / Look for reversal confirmation)
Stop Loss (SL): ₹2,981.2 (Daily close below horizontal structure; ~4.7% risk)
Target / Take Profit (TP): ₹4,599.3 (Upper channel boundary / Prior swing peak extension; ~47% upside)
Risk-to-Reward Ratio (R:R): ~1 : 10
 Long
Long
 Long
Long
#NIFTY Intraday Support and Resistance Levels - 11/09/2026Nifty 50 is expected to open flat, with the index around 23,389. The broader short-term structure remains bearish, as the index continues to trade below the important 23450–23500 resistance zone and is holding near the lower end of the recent range.
The immediate resistance is placed around 23,450–23,500. If Nifty manages to reclaim and sustain above 23,500, buying momentum can improve and the index may move toward 23,650, 23,700 and 23,750. A sustained move above 23,750 would indicate a stronger recovery.
On the bearish side, a failure to cross 23,450–23,500 can keep selling pressure active. A decisive break below 23,400 can lead to further weakness toward 23,350 and 23,300, followed by the major support near 23,250.
Overall, 23,400–23,500 is the key decision zone for today's session. With a flat opening, traders should wait for a clear breakout or breakdown rather than entering in the middle of the range. Sustaining above 23,500 can trigger a recovery, while a break below 23,400 can resume the downside momentum. #BANKNIFTY Intraday PE & CE Levels(11/09/2026)Bank Nifty is expected to open with a gap down, with the index currently around 56,472. The opening weakness comes after the index struggled to sustain above the 56,550 resistance zone, keeping the short-term structure cautious.
The immediate support is placed around 56550, which is an important level for the session. If Bank Nifty sustains below 56450, selling pressure can increase and the index may move toward 56250, 56150 and 56050. A decisive breakdown below 56,050 could open further downside toward 55,950 and lower levels.
On the bullish side, the index needs to reclaim 56550 with sustained strength. A successful breakout above this level can improve sentiment and trigger a recovery toward 56750, 56850 and 56950. The 56950 level remains a major resistance zone.
Overall, the 56,450–56,550 range is the key decision zone. With a gap-down opening, traders should avoid chasing the initial move and wait for confirmation. Sustaining below 56450 keeps the bearish setup active, while a strong recovery above 56550 can shift momentum toward the upside. Nifty Intraday Outlook for 11-09-2026📊 **NIFTY 15-Min: Strong Gap-Down Expected in a Bearish Structure**
NIFTY remains inside a clear downtrend with lower highs, lower lows and continued rejection from the descending trendline and moving-average structure.
GIFT Nifty indicates a sharp gap-down, which may take price directly below the 23,380 support and close to the first downside target.
That means chasing PE immediately at the opening may offer poor risk-reward.
---
📌 **Important Levels**
Resistance:
• 23,430
• 23,470
Upside Targets:
• 23,520
• 23,570
• 23,640
Support:
• 23,320
Downside Targets:
• 23,280
• 23,220
• 23,130
---
📉 **Bearish Plan**
If NIFTY opens below 23,380:
• Do not chase PE immediately
• Prefer a pullback toward 23,380–23,430 followed by bearish rejection
• Targets: 23,320 / 23,280 / 23,220
Below 23,320:
• Stronger bearish continuation
• Prefer breakdown + failed reclaim
• Targets: 23,280 / 23,220 / 23,130
Do not chase PE after an extended candle directly into the first downside target.
---
📈 **Bullish Plan**
If NIFTY quickly reclaims and sustains above 23,380:
• Short-covering recovery can develop
• Targets: 23,420 / 23,470
Safer CE confirmation comes only above 23,470.
Targets:
• 23,520
• 23,570
• 23,640
A bounce from lower levels alone is not enough — buyers need to reclaim the broken structure.
---
🌍 **Market Context**
GIFT Nifty indicates a sharp negative opening.
Brent crude has surged above $108 as the Middle East conflict intensifies and shipping risks increase across both the Strait of Hormuz and Red Sea.
Asian equities are trading sharply lower, while global bond yields have risen as higher oil prices revive inflation and rate-hike concerns.
Higher crude remains a major risk for India through inflation, import costs, corporate margins and rupee pressure.
---
✅ **Final View**
Below 23,380 → sellers retain control
Below 23,320 → bearish continuation
Below 23,220 → downside momentum can accelerate
Reclaim 23,380 → short-covering bounce possible
Above 23,470 → recovery becomes stronger
Opening directly near 23,320 → DO NOT CHASE PE
Educational analysis only. Trade with confirmation and disciplined risk management.


