 Long
Long
BTCUSDT: Hits Sell Zone, 76.5K Back to AimBTCUSDT is trading around 79,250 USDT, having just retraced into the 79,200–79,700 sell zone. This area is significant as it aligns with the upper boundary of a descending channel and a cluster of EMAs; meanwhile, the price structure from the 82,315 peak down to 80,604 continues to show a series of lower highs.
If BTC faces continued rejection below the 79,500–79,700 range, I lean towards a scenario where the price drops to 78,000 and subsequently extends down to 76,500–76,800 USDT. The fact that the price is testing resistance while within a descending channel suggests the current rebound is more of a retest than a trend reversal.
Macro factors also lend slight support to a correction scenario. Brent crude is approaching $100 per barrel, fueling inflation concerns and keeping the probability of a Fed rate hike high; additionally, Reuters notes that Bitcoin remains below 80K amidst cautious "risk-on" sentiment.
The bearish scenario would lose momentum if BTC breaks out of the channel and holds firmly above the 79,700–80,000 level.
Will the sell zone continue to cap BTC, or do the bulls have enough strength to reclaim the 80K mark?  Short
Short
Market Breadth NIFTYMIDSMALL400The Path to Trading Mastery: Research and Pattern Recognition By Qullamaggie
1. Step-by-Step Market Research
The easiest way to start is to research the markets thoroughly. First, get a platform like TC2000 and set your charts to the monthly timeframe. Create a watchlist of all US stocks and filter them by dollar volume instead of just share volume. Aim for liquid names—those with at least $1 billion to $10 billion in monthly dollar volume—to avoid "super thin" or illiquid stocks.
2. Identifying the Big Movers
Go through the entire database (roughly 5,000 stocks) and identify the outliers. Look for stocks that:
At least doubled in price within six months.
Increased 200–300% within a single year.
Gained 400–500% over three to four years.
Create a separate watchlist for every single stock that has made these massive moves. You will likely end up with a few hundred highly liquid, historical winners.
3. Studying Chart Patterns
Go back as far as the 80s or 90s and study their chart patterns. Stocks move in very specific ways. These same patterns occur over and over again—there is nothing truly new in the markets. While there are variations, the patterns that worked in the 90s are the same ones you see today.
Focus primarily on price action. You can add a few indicators if you wish—I recommend moving averages—but don't use too many. "Too many indicators is for suckers." Study how these big winners acted during pullbacks:
Which moving averages did the best stocks respect or "obey"?
How did they behave before the breakout?
How did they act once the move was underway?
4. Building Your Mental Database (The 2,000-Hour Rule)
Your goal is to build a database in your head. Spend 1,000 hours doing exactly this: printing out charts, studying them, and saving them. (I personally use Evernote to store tens of thousands of these charts).
Once you understand the price action, spend another 1,000 hours researching the fundamentals and the news behind those moves. What was driving them? What made a stock go up 500% in a year?
If you put in those 2,000 hours of deep research, I promise you: before you know it, you’re going to have ten million dollars in your account. H2 Bullish Reclaim Toward Major Supply
XAUUSD is trading around 4,413 after recovering from the recent 4,350 area and compressing between the descending resistance trendline and rising short-term support. Price is now approaching the first resistance zone, making the next reclaim especially important.
Gold gained more than 1% on Wednesday as the U.S. dollar remained soft, while escalating Middle East tensions pushed Brent above $100. However, the U.S. 10-year Treasury yield climbed toward 4.84%, and markets are pricing roughly a 60% probability of a Fed hike next week, keeping the macro backdrop highly sensitive to inflation data.
The next catalysts are U.S. PPI today, September 10, at 8:30 a.m. ET, followed by CPI on September 11 at 8:30 a.m. ET. Both releases could materially shift Fed expectations and create sharp volatility in XAUUSD.
Technical View
The broader structure remains below the descending resistance line, but short-term price action is showing signs of recovery.
The immediate decision area is 4,415–4,445 Resistance. A clean reclaim and successful retest of this zone would strengthen the bullish structure and support continuation toward the next supply.
The first major upside objective sits around 4,490–4,515 Supply Zone.
If buyers maintain momentum above that area, the larger target becomes the 4,600–4,635 Major Resistance / Supply Zone.
Below current price, the 4,285–4,310 Demand Zone / Strong Support remains the major structural support on the chart.
Key Zones
Current Price: 4,412.820
Resistance / Reclaim: 4,415–4,445
Supply Zone: 4,490–4,515
Major Resistance / Supply: 4,600–4,635
Major Demand / Strong Support: 4,285–4,310
Trading Plan
Buy Priority: confirmed reclaim of 4,415–4,445
Condition: wait for price to break above resistance and confirm the zone as support through a retest, bullish rejection or higher-low formation.
TP1: 4,490–4,515
TP2: 4,600–4,635
Invalidation: failure to hold the reclaimed resistance structure would weaken the immediate bullish continuation setup.
Important Note
PPI and CPI are the main short-term risks. With oil above $100 and Treasury yields elevated, hotter inflation could quickly strengthen Fed-hike expectations and pressure gold.
Avoid chasing a breakout during the first reaction to the data. Confirmation after the liquidity sweep remains more important than the initial candle.
Buy View
The preferred scenario is not to buy directly below resistance.
A confirmed breakout above 4,415–4,445, followed by a controlled retest, would provide the cleaner bullish setup. If buyers establish acceptance above this area, 4,490–4,515 becomes the next liquidity objective.
Final View
Gold is attempting to transition from consolidation into a stronger recovery phase, but 4,415–4,445 remains the key gate.
The main scenario is a bullish reclaim and retest of resistance, followed by expansion toward 4,490–4,515 and potentially 4,600–4,635.
Can gold reclaim 4,445 before PPI and CPI trigger the next major expansion?  Long
Long
Don’t Rush to Sell BTCUSD – Buyers Are Defending the ChannelBTCUSD is currently leaning toward a short-term BULLISH recovery, as buyers continue to defend the broader rising structure despite a challenging macro backdrop. Oil prices near $100 and uncertainty around the Fed are keeping risk sentiment cautious, but the weaker U.S. dollar is offering some relief to Bitcoin. For now, the macro picture remains mixed rather than strongly bearish, giving BTC room to recover if technical support continues to hold.
On the H2 chart, after the recent rejection from the $81,000–$82,000 area, Bitcoin has entered a corrective phase and moved back toward the lower boundary of its rising price channel. This may look like the beginning of a deeper decline, but so far the bullish channel has not been broken. Previous tests of this lower trendline have attracted buyers, making the current pullback an important area to watch for another reaction.
The $77,900–$78,000 area stands out as the key support zone, where horizontal support and the lower channel boundary come together. If buyers defend this area again, I expect BTCUSD to recover toward $79,000–$80,000 first. A stronger breakout above this region could then open the way toward the upper part of the channel around $82,000.
As long as $77,900 holds, I see the current weakness as a correction within the broader rising structure rather than a confirmed bearish reversal. Long 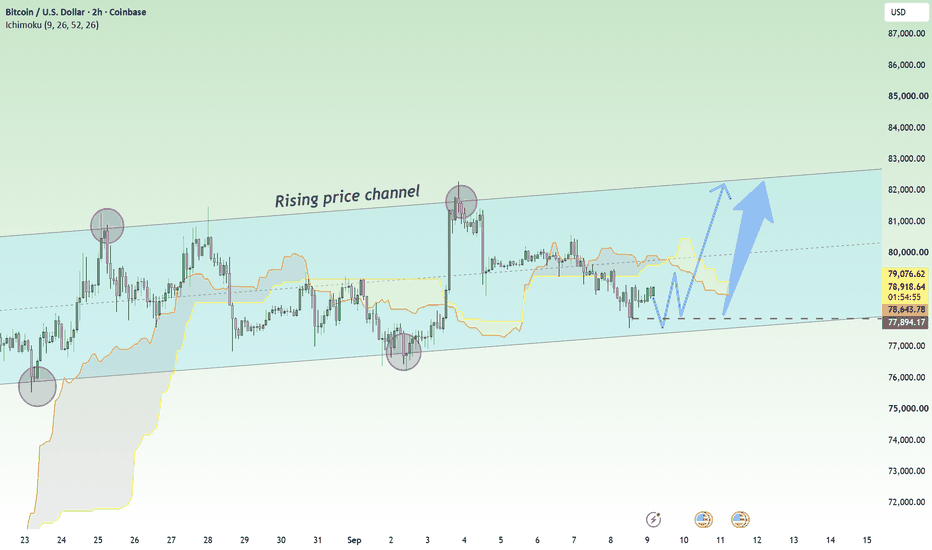
 Long
Long
WaveTalks -COMEX GOLD: The Sharp Fall 4479 to 4355's- What Next?Comex Gold
1:42 am / 11th Sep 2026 (Indian Standard Time)
Last @ $4364
"Is Gold teasing before a deep dive? Well, only the next few candles will tell. Did you get the red candles? Like there was no floor... This is exactly what unfolded and is called a Thrust (Deep Dive)."The quote above highlights the real-time breakdown flagged earlier on the WaveTalks social media channels at 11:29 am on 10th September 2026.
Already completed 1st Bigger Impulse
$3963 to $4755 & Fall from $4755 to $4329 - Discussed via Social Media Handle.. This analysis continuation from $4329 lows.
⚠️ DISCLAIMER:
This analysis is for educational purposes only. No solicitation to buy or sell.
Primary Wave Scenario - ABC
( Wave-A Blue Color Done at $4329.2...Wave-B Blue Color unfolding as Smaller Wave - abc in black...Once Wave-B completes on top close to $4590-4600... Expect Fall in Wave-C Blue Color )
Alternate Wave Scenario- ???
Gold futures are currently completing a sharp thrust lower in a complex Wave-B correction down to the $4,350-4355 area before embarking on a bullish reversal toward the $4,600 region as a possible scenario.
🟢 1. CURRENT ELLIOTT WAVE STRUCTURE 🟢
• The initial impulsive rally from the $4,329 bottom completed Wave- (A) Black at the $4,558 peak.
• Since that top, price action has been carving out a choppy and messy complex Wave-B structure - which is ongoing ...current low is 4355's ( 12:54 pm /11th Sep 2026 / Indian Standard Time )
• This corrective wave featured a connecting contracting triangle pattern labeled sub-waves a through e.
• The sudden drop from the $4,479 sub-wave e peak represents a classic post-triangle thrust.
• This floorless decline is rapidly flushing out weak longs to finalize the corrective phase.
🟢 2. PROJECTED UPSIDE TRAJECTORY 🟢
• Once the current downward thrust concludes near the $4,350-4365 support zone, a bullish reversal is expected next.
• This upcoming advance will develop as a major impulsive Wave-C leg to the upside.
• The multi-session bullish recovery will officially trigger once price decisively breaks back above the $4,410-$4,420 trigger zone.
• The primary upside targets reside at the previous structural high of $4,479 - 4,489 zone and the major resistance cluster between $4,550 and $4,560.
• Extending the wave relationships suggests the rally could ultimately reach a peak within the $4,590-$4,600 terminal window.
🟢 3. RISK MANAGEMENT AND KEY LEVELS 🟢
Trading this layout requires strict adherence to defined risk parameters at every major pivot zone.
• Immediate Downside Support: $4,350-4365 zone
• Bullish Breakout Confirmation: $4,410-$4,420
• Intermediate Resistance Targets: $4,479 - 4489
• Major Supply Cluster: $4,550-$4,560
• Terminal Target Zone: $4,590-$4,600
🟢 4. NEXT WEEK HORIZON 🟢
• As the broader blue Wave-B peak nears completion close to the $4,600 level next week, buyers must aggressively secure profits.
• A major structural top is anticipated to form inside that high-altitude supply zone.
• Reaching this terminal zone will complete the larger-degree corrective bounce and set the stage for a bearish reversal.
• Traders must exercise extreme caution at those highs of $4590-4600 zone (If unfolds) because the subsequent leg will unfold as a deep, aggressive liquidation phase in blue Wave-C.
WaveTalks
Market Whispers! Can you hear them?
Long 
XAUUSD: Supply Zone Rejection & Bearish Setup Target ?Market Structure & Technical Breakdown
Asset / Timeframe: XAU/USD (Gold) — 1-Hour Chart (1h)
Trend & Context: Following an earlier Break of Structure (BOS) and subsequent Market Structure Shift (MSS) off the local Pivot Point (~4,310–4,320), price expanded aggressively to sweep Buy-Side Liquidity (BSL) around 4,510–4,520.
Current Setup: Price has dropped into a substantial Supply Zone (4,440 – 4,490) and is showing signs of exhaustion and lower-timeframe distribution.
Trade Strategy & Levels
Bias: Bearish / Short from Supply Zone
Entry Area: Continuous rejections inside the 4,440 – 4,460 Supply Zone boundary.
Take Profit (Target): 4,340 (Testing key liquidity/swing low demand).
Stop Loss (Risk Management): Above the Supply Zone high (~4,495 – 4,510), depending on individual risk tolerance.
Execution Plan
Look for price to retest the lower edge of the 1H Supply Zone before distributing lower toward the main target at 4,340. Exercise proper risk management and wait for confirmation on lower timeframes (e.g., 5m/15m MSS) before taking entries. Short 
GOLD JUST GAVE US A WARNING — MOST TRADERS WILL IGNORE IT.There is no doubt that buyers tried to push the market higher on Thursday, but eventually they failed.
Why?
Because the breakout we were waiting for never actually confirmed.
Price did break above $4417, but remember one thing: a breakout itself is only the first reaction. What I wanted to see next was a strong bullish displacement and, more importantly, price sustaining above $4417 and the previous day’s high.
That would have shown me that buyers were actually taking control and that the liquidity sitting higher could become the next target.
But that never happened.
We had the trendline structure, we had the breakout attempt, but there was no real follow-through. That tells me buyers tried to take control but failed. Once that happened, price moved aggressively in the opposite direction and trapped the buyers who entered during the Wednesday-to-Thursday recovery.
So right now, I believe a lot of buyers are trapped at higher prices, while sellers are slowly trying to regain control.
That is why I don’t want to trade with a fixed bullish or bearish mindset here. The market has been playing both sides throughout this week, so I would rather work with probabilities and let price confirm the next move.
Now my attention is shifting towards the $4312–$4300 area.
This area acted as strong support multiple times during August. Then, at the beginning of September, price swept an important low and gave us a strong upside move.
Think about the psychology behind that.
When traders see a major liquidity sweep and reversal right at the beginning of a new month, many start treating it as confirmation for the entire month. They become bullish, start buying dips and sometimes even try to hold those positions for a much bigger move.
Now those same buyers can become liquidity.
That is why I believe this current downside move could potentially be designed to attack that bullish positioning and bring price back towards $4300.
For me, $4417 remains extremely important. $4450 is another major level above it. If price eventually gives me a strong bullish displacement above $4417 and starts sustaining there, then I will have a reason to reconsider the bullish side.
Until that happens, I am not interested in assuming that every dip is a buying opportunity.
On the downside, $4324 is also interesting because this area previously acted as support around August 19. So there is a possibility that price revisits this zone, gives an initial bullish reaction and creates the impression that another recovery is starting.
And this is where things could get interesting.
This week, traders have repeatedly seen lows getting swept followed by recoveries. So if price reacts bullishly again, many traders may automatically expect the same pattern to repeat.
But the real trap could be that this time the recovery fails.
If sellers remain in control, CPI volatility could potentially push price towards $4300, and if $4300 loses acceptance as support, we could even see a proper breakdown below it.
So my plan is simple:
I’m not predicting. I’m watching how price reacts.
Above $4417 with strong displacement and acceptance, I respect the buyers again.
Below that, especially if another recovery attempt fails, my attention remains on $4324 and ultimately the $4300 area.
This is a probability game now. Let price show us who actually has control.
One Chart. Six Tools. Multiple PatternsEducational price-action Post. No forecast or trade recommendation. Price Action used is older than 3 months
Here’s how I’ve mapped this chart from A to F 👇
A — Fibonacci Retracement 📐
The Fibonacci tool is drawn from the swing low to the swing high. Price breaks below my marked Golden Retracement level. While many traders interpret this as a sign of bearish continuation, my setup looks at what happens after the breakdown. If price recovers back above the level, I consider the possibility that the breakdown was a trap rather than assuming the original move will continue.
B + C — Parallel Channel ↔️
Individually, these are two lines. Together, they create a parallel channel, giving us a broader view of how price is moving within the structure.
D — Supply Zone 🔴
A supply zone is marked where price previously showed rejection. It becomes another important area to observe when studying the overall structure.
E — Monthly Rejection + Broadening Structure 📈
Line E represents a rejection line visible on the Monthly timeframe. When combined with line B, it creates another structure — a broadening pattern, where price is forming progressively higher highs and lower lows.
F — Trendline 📏
Simple logic: a trendline helps identify areas where price has repeatedly found support. No complicated theory — just observing how price reacts around the line.
One stock does not necessarily mean one chart pattern.
You can have a channel, supply zone, Fibonacci structure, broadening pattern and trendline developing within the same chart. Long 
XAUUSD 1H — HL Support, Bullish Reversal SetupGold is currently testing a key 1H support area around 4,350–4,370 after completing a sharp bearish leg from the 4,425–4,435 HH zone. The latest structure has printed a clear Higher Low (HL) near 4,325, suggesting that buyers are defending the lower range rather than allowing a continuation of the broader decline.
Price is now sitting around the 0.382 Fibonacci retracement/support area, while the recent sell-off has already reached the lower liquidity zone. This creates an important reaction area for a potential bullish recovery.
📌 Bullish Scenario
The preferred setup is a support reaction followed by a reclaim of 4,375–4,400. If buyers regain this area and hold above it, momentum could shift back towards the nearby FVG and previous swing highs.
Potential Entry Zone: 4,350–4,375
Confirmation: Reclaim/hold above 4,375–4,400
SL / Invalidation: Below 4,325
TP1: 4,400–4,415
TP2: 4,430–4,450
TP3: 4,460–4,470
🔎 Key Resistance
The 4,430–4,465 FVG remains the major supply zone. A clean 1H breakout and close above this area would significantly strengthen the bullish reversal and potentially expose the 4,500–4,510 region.
⚠️ Bearish Invalidation
If price loses 4,325 with a decisive 1H close below the HL, the bullish structure would be invalidated and the market could resume its downside expansion.
Market Bias: Bullish recovery above 4,325, with 4,430–4,465 as the major resistance and 4,460+ as the key upside objective. Long 
USOIL — Approaching the 2008 Bubble Resistance!!! 300 Post!!There are charts that deserve to be studied on a daily timeframe. And then there are charts that deserve to be zoomed out for 20 years. This is one of them.
On the 3-month USOIL chart, I’ve marked a long-term descending resistance that originates from the 2008 oil-price peak, when WTI reached around $147.
What makes this interesting is that this isn’t simply a resistance line drawn from two random points. It represents a structural ceiling that has remained relevant across multiple market cycles.
Today, oil is once again moving toward that long-term zone.
And the macro backdrop makes this even more interesting.
WTI has moved back above $100, while Brent has also crossed $100 as escalating Middle East tensions, attacks on energy infrastructure and disruptions around key shipping routes have increased the geopolitical risk premium in crude.
But here is where I think we need to look beyond the obvious.
Oil at $100+ isn’t just an oil story.
If higher crude prices persist, they can feed directly into transportation, manufacturing, chemicals, energy and consumer costs. That can push inflation higher, keep bond yields elevated and make the job of central banks significantly harder.
And for India, this matters even more.
India imports the vast majority of its crude requirements, so a sustained rise in oil prices can pressure the import bill, inflation, currency and current-account dynamics.
Now comes the interesting part of the chart.
What happens when USOIL reaches this long-term resistance?
I don’t want to predict the answer. I want to watch the reaction.
Scenario 1 — Rejection:
If price reaches the long-term trendline and gets rejected, we could potentially see another major correction in crude.
Scenario 2 — Breakout:
If price breaks through this multi-year resistance and, more importantly, sustains above it, the entire long-term structure could change.
Scenario 3 — False Breakout:
Price could push above the resistance, create euphoria, attract momentum traders and then fall back below the structure.
So I’m not looking at this chart and saying, “Oil is going to crash.”
And I’m definitely not saying, “Oil is going to $150.”
I’m saying something much simpler:
We are approaching a level where history, price action and macroeconomics could collide.
The 2008 peak was created in a completely different macro environment. Today’s market is different.
But markets have a funny way of remembering important price zones.
And that’s why I love zooming out.
Sometimes the daily chart tells you what is happening.
But the 20-year chart tells you why you should care.
For me, the next major question isn’t whether oil can move another 5% or 10%.
It’s this:
When USOIL finally meets this long-term resistance, will history repeat — or will price finally break the structure that has been holding for nearly two decades?
That reaction could be far more important than the move we are seeing today.  Long
Long
Short 
XAU/USD 45-Minute — Market Structure & Liquidity Analysis1. Market Structure
• Price has formed a sequence of lower highs and lower lows from the 4,500 area.\
• Multiple MSB (Market Structure Break) signals confirm the broader bearish structure.\
• The recent rejection from the 4,420–4,440 region reinforces seller dominance.\
• The latest sharp downside move indicates that bearish momentum remains active.
2. Key Support / Liquidity Zones
4,340–4,325 is the key immediate downside liquidity zone.
• The large lower wick around 4,325 indicates aggressive buying and liquidity absorption.\
• A revisit of this area could create a sell-side liquidity sweep before a corrective recovery.
3. Resistance Zones
• 4,380–4,400 — Immediate recovery resistance\
• 4,415–4,425 — Major structural resistance\
• 4,440 — Critical resistance and previous swing area
A sustained 45-minute close above 4,420–4,440 would significantly weaken the bearish structure.
4. Expected Price Scenario
Primary scenario:
Price sweeps the 4,340–4,325 liquidity zone first, then attempts a bullish retracement toward 4,390–4,420.
This aligns with the projection drawn on the chart:
Sell-side liquidity sweep → bullish displacement → market structure shift → recovery → take profit around 4,400+.
Alternative scenario:
If price decisively breaks and closes below 4,325, bearish continuation becomes more likely, with the market searching for lower support and liquidity.
Trade Bias
Overall trend: Bearish\
Short-term momentum: Bearish\
Immediate support: 4,340–4,325\
Immediate resistance: 4,380–4,400\
Major resistance: 4,420–4,440\
Reversal confirmation: Liquidity sweep + bullish MSB\
Current outlook: Bearish until reversal confirmation
Professional Setup Concept
The higher-probability approach is to avoid chasing the current decline.
Wait for:
Sell-side liquidity sweep around 4,340–4,325 → bullish displacement → bullish MSB → retracement entry → targets 4,380 / 4,400 / 4,420.
If price closes decisively below 4,325, invalidate the bullish reversal thesis and reassess for bearish continuation.
Suggested title:
XAU/USD 45M — Bearish Market Structure with Sell-Side Liquidity Sweep & Reversal Setup Long 
NIFTY Trading Plan | 11-Sep-2026 | Recovery Attempt?NIFTY : Recovery Attempt or Support Breakdown?
Educational price-action analysis based on the attached 15-minute chart.
Market Structure & Working Bias
NIFTY continues to show a declining structure with lower highs and lower lows. The displayed reference price is 23,389.40 , inside the chart’s marked 23,288–23,457 potential reversal zone .
This zone is an area to monitor for buying confirmation—not proof that a reversal has started.
• Inside 23,288–23,457: Watch for stabilisation, range formation or a fresh breakdown.
• Above 23,457 with acceptance: A recovery toward 23,531 and 23,632 becomes possible.
• Above 23,632 with a successful retest: The recovery structure improves; 23,829 becomes an extension reference.
• Below 23,288 with acceptance: Downside risk increases.
In this plan, “acceptance” means a 15-minute close beyond a level followed by a hold or successful retest. A brief wick is not sufficient confirmation. All prices refer to the underlying NIFTY index, not option premiums.
Key Levels With Trading Tips
1. 23,829 | Upper Recovery Extension
This is the highest marked upside reference. It becomes relevant only if price first reclaims 23,457, 23,531 and 23,632.
Trading tip: Treat this as a conditional extension, not a compulsory same-day target. Protect profits if the recovery loses momentum before reaching it.
2. 23,632 | Major Recovery Checkpoint
The chart highlights this area as a possible location for a pullback or consolidation during a recovery. How price behaves after reaching it matters more than the first touch.
Trading tip: Consider partial profit-taking on bullish positions. A higher low after a pullback supports recovery; repeated rejection calls for caution. Do not assume a touch confirms a broader trend reversal.
3. 23,531 | Marked Intraday Resistance
This is the first marked resistance above 23,457. A recovery may stall here unless buyers establish acceptance above it.
Trading tip: Avoid initiating a late bullish trade directly beneath resistance. Prefer either a pullback entry with sufficient room or a confirmed breakout and retest.
4. 23,457 | Upper Decision Boundary / Reclaim Trigger
Although labelled as important daily support on the chart, this level is above the displayed price. Until reclaimed, it can act as resistance.
Trading tip: A move above 23,457 needs a hold and higher low to become convincing. If the reclaim fails, watch for sellers defending the level from underneath.
5. 23,389.40 | Displayed Reference Price
This is the reference used for the opening-gap calculations below, not an independent entry trigger.
Trading tip: Verify the official previous-session close before calculating the gap. The displayed intraday candle close may differ from the official closing value.
6. 23,288 | Lower Decision Boundary / Critical Support
This is the marked intraday support and the lower edge of the potential reversal zone. A failed breakdown could support a recovery; sustained trading below it would weaken the buying case.
Trading tip: Avoid buying the first touch or selling the first wick below. Wait for either a confirmed defence and higher low, or a breakdown followed by a failed reclaim.
7. 22,734–22,599 | Broader Conditional Downside Zone
The chart plots 22,734 and mentions 22,599 in its downside annotation. This is a broader risk reference if the support failure develops on the daily timeframe—not a routine intraday target for 11 September.
Trading tip: A 15-minute breakdown does not confirm a daily breakdown. Verify the daily chart separately and use fresh intraday supports for trade management rather than holding blindly for this distant zone.
Scenario 1: Gap-Up Opening by 100+ Points
Indicative opening threshold: 23,489.40 or higher, using the displayed reference.
A gap up of exactly 100 points would place NIFTY above 23,457 but only about 42 points below 23,531. Entry location therefore matters.
A. Opening Above 23,457 but Below 23,531
• Let the first 15-minute opening range form.
• Watch for a pullback that holds 23,457 and forms a higher low.
• A break of the pullback’s local high can confirm a bullish setup.
• Upside references: 23,531, followed by 23,632 after a confirmed reclaim.
• Invalidation: Loss of the retest swing low and failure to hold the reclaimed level.
Trading tip: Do not chase the opening jump into 23,531. If the first resistance leaves insufficient reward relative to the stop, skip the entry.
B. Opening Above 23,531
• A successful retest of 23,531 can support continuation toward 23,632.
• Above 23,632 with acceptance, monitor 23,829 as an extension.
• Invalidation: Loss of the relevant retest swing low.
• If the gap already opens beyond a marked objective, reassess using the next level and fresh structure.
Trading tip: A large gap does not automatically justify a short. Trade whether the reclaimed level holds, not whether the opening “looks too high.”
C. Gap Up Fails
• Rejection at 23,531 or 23,632, followed by a break of the rejection swing low, can support a pullback setup.
• Downside references are the next lower marked levels: 23,531 where applicable, then 23,457.
• If 23,457 breaks and fails on a retest, 23,288 becomes the next marked support.
• Invalidation: Reclaim of the rejection swing high.
Trading tip: A failed gap need not fill completely. Consider protecting bearish profits at each support rather than assuming uninterrupted downside.
Scenario 2: Gap-Down Opening by 100+ Points
Indicative opening threshold: 23,289.40 or lower, using the displayed reference.
A gap down of exactly 100 points would open almost directly at 23,288. A slightly larger gap would open below it.
A. Opening Near 23,288 and Support Holds
• Avoid immediately shorting into the marked support.
• Watch for a base, a higher low and a break of the local recovery high.
• Recovery reference: 23,457, while managing around any fresh intraday resistance.
• Invalidation: Loss of the reversal swing low.
Trading tip: This is a countertrend recovery setup. Reduce expectations if the rebound lacks follow-through; support holding once does not establish a new uptrend.
B. Opening Below 23,288 With a Failed Reclaim
• Allow the initial opening volatility to settle.
• Prefer a rebound toward 23,288 that fails, followed by a lower low.
• Invalidation: Reclaim of the level and the failed-retest swing high.
• Manage exits at fresh intraday supports and trail only while lower highs continue.
• The distant 22,734–22,599 zone remains a broader conditional reference.
Trading tip: The supplied chart does not mark nearby support below 23,288. Establish a realistic exit and reward-to-risk before entering; do not use the distant downside zone simply to justify the trade.
C. False Breakdown and Reclaim
• If price opens below 23,288 but quickly reclaims it, wait for a successful retest.
• A higher low can support a recovery toward 23,457.
• Only a confirmed reclaim of 23,457 brings 23,531 into focus.
• Invalidation: Loss of the failed-breakdown swing low.
Trading tip: A single strong green candle can still fail. Let the reclaimed support prove itself before considering a recovery trade.
Scenario 3: Flat Opening
Working definition: Within approximately 30 points of 23,389.40. Actual location relative to the marked levels takes priority.
A. Opening Inside 23,288–23,457
• Avoid assigning direction solely from the first candle.
• Watch whether price develops higher lows toward 23,457 or lower highs toward 23,288.
• Prefer confirmed setups near the boundaries over entries in the middle of the zone.
Trading tip: This is a 169-point decision area, not a guaranteed sideways range. Let actual opening structure define the trade.
B. Breakout Above 23,457
• Look for a 15-minute close above the boundary and a successful retest.
• Upside references: 23,531, then 23,632.
• Above 23,632 with acceptance: 23,829 becomes relevant.
• Invalidation: Loss of the retest swing low.
Trading tip: The first resistance is only 74 points above 23,457. A large breakout candle can consume most of the available opportunity.
C. Breakdown Below 23,288
• Look for a close below support and a failed reclaim.
• Use fresh intraday structure to identify intermediate exits.
• Invalidation: Reclaim of 23,288 and the retest swing high.
• Do not interpret this alone as confirmation of the chart’s broader daily downside projection.
Trading tip: Skip an extended breakdown if no sensible stop and exit are available. Being directionally right is not enough to make an entry worthwhile.
D. Rejection at a Boundary Without a Breakout
• A confirmed defence of 23,288 can support a recovery attempt.
• Rejection of 23,457 can support a pullback within the decision zone.
• Place invalidation beyond the relevant reversal swing.
• Treat the opposite boundary as a possible objective, not a guaranteed destination.
Trading tip: Range-style setups lose validity when price starts accepting outside the zone. Do not keep fading a confirmed breakout.
For openings between approximately 30 and 100 points from the reference, apply the same level-based rules rather than forcing a gap classification.
Trading Tips
• Use the 15-minute chart for structure; a 5-minute chart may refine entries after confirmation.
• Treat the projected chart arrows as possible paths, not forecasts or timing promises.
• A support label does not guarantee buying, and a resistance label does not guarantee selling.
• After a failed setup, wait for fresh structure instead of immediately reversing direction.
• Reassess levels after major news or an unusually large opening gap.
• No confirmation or insufficient reward-to-risk means no trade.
Risk Management Tips
• As a conservative educational example, limit risk per setup to 0.25%–0.50% of trading capital.
• Consider stopping after two full-stop losses or a predefined daily loss cap, such as 1%, whichever occurs first.
• Prefer at least 1:2 planned reward-to-risk to a realistic exit after estimated costs.
• Size positions using the permitted rupee loss and estimated loss per lot at the stop. If the minimum lot exceeds the risk budget, skip the trade.
• Place stops beyond structural invalidation. Reduce quantity for a wider stop; never widen it simply to avoid accepting a loss.
• Do not average into losing positions or increase size to recover earlier losses.
• For options, define both the underlying invalidation and maximum rupee loss. Index-point stops do not translate directly into premium stops.
• Account for time decay, implied volatility, spreads and the contract’s own expiry. A correct index view does not guarantee an option profit.
• Stops can suffer slippage. Avoid excessive leverage and unhedged option selling.
• Do not turn an unsuccessful intraday trade into an unplanned overnight or weekend position.
Quick Session Roadmap
Above 23,457: Monitor 23,531.
Above 23,531: Monitor 23,632.
Above 23,632 with acceptance: Monitor 23,829.
Inside 23,288–23,457: Wait for clear boundary-based confirmation.
Below 23,288: Monitor continuation using fresh intraday supports; keep the broader downside projection separate.
Educational analysis only, not personalised investment advice or an assurance of returns. Levels are taken from the supplied chart. Verify live prices, the official previous close and the daily timeframe before applying the plan.  Long
Long
Capri Global Capital Ltd — Strong Growth Setup for LT & STCapri Global Capital is showing an interesting combination of strong fundamental growth and improving technical momentum.
📈 Key Observations
PAT is increasing at a fast pace, indicating strong improvement in profitability.
The recent five-month trend shows consistently strong and increasing volume, supporting the price move and suggesting growing market participation.
The latest months have witnessed a significant volume expansion, which adds strength to the ongoing momentum.
From a fundamental perspective, short-term loans have reportedly doubled in the latest quarter. If this capital is deployed efficiently, it could potentially contribute to a significant increase in interest income in the upcoming quarterly results.
🎯 Short-Term Opportunity
With the September quarterly results approaching, the stock could also be an interesting short-term momentum candidate.
The expectation is for a strong quarterly performance, and if the market continues to price in improving earnings growth, there could be potential for approximately 20% upside over the coming month. However, this is a market expectation and not a guarantee.
🛑 Risk Management / Stop Loss
Exit the position if any monthly candle closes below the previous month's low/close level based on your chosen risk structure.
This is a relatively high-risk trade, but the combination of:
✅ Rapid PAT growth
✅ Rising interest-income potential
✅ Strong monthly volume expansion
✅ Positive price momentum
makes it an interesting setup with a potentially favorable probability profile.
Disclosure: This analysis is for educational purposes only and should not be considered financial advice. Please do your own research before investing.  Long
Long
XAUUSD — Bearish Trendline Retest, Lower Support in FocusMarket Pulse
Gold is getting some safe-haven support as Middle East tensions intensify and Brent crude approaches $100. Gold was up around 0.7% earlier today, but higher energy prices are also increasing inflation concerns and keeping global bond yields elevated.
The market is now waiting for fresh U.S. inflation data. PPI is due Thursday and CPI Friday, and stronger inflation could reinforce expectations for another Fed rate hike, which would remain a headwind for Gold.
What the Chart Says
XAUUSD remains bearish on H1.
Price is still trading below the descending trendline, and the latest recovery has reached the 4,407–4,413 OB + liquidity zone without creating a clear bullish structure shift.
For now, this looks like a retest inside the bearish trend.
If sellers continue to defend this area, price could move back toward the 4,376–4,383 OB + Flip zone. A break below that support would expose the deeper 4,350–4,356 support area.
A stronger recovery would need to break the current OB and descending trendline first. Above that, liquidity around 4,422–4,424 becomes the next level to watch, followed by the 4,436–4,442 rejection zone.
Levels That Matter
4,436–4,442 — Major rejection
4,422–4,424 — Liquidity
4,407–4,413 — OB + liquidity / main resistance
4,376–4,383 — OB + Flip
4,350–4,356 — Main support
My Main Plan
The main plan remains bearish.
I prefer waiting for another reaction around 4,407–4,413. If sellers defend this zone and bearish confirmation appears, Gold could rotate toward 4,376–4,383 first.
A clean break below that area may extend the move toward 4,350–4,356.
What I Need to See
I want price to remain below the descending trendline and fail to hold above 4,413.
A sustained H1 breakout above the trendline and 4,424 would weaken the immediate bearish setup and could allow a deeper recovery toward 4,436–4,442.
Final Read
The H1 picture still favors sellers. Gold is recovering, but the rebound is currently testing resistance rather than confirming a new uptrend.
For now, I prefer selling the rebound with confirmation, while keeping 4,376–4,383 and 4,350–4,356 as the main downside areas.
I can also track the PPI/CPI reaction and flag if the Gold bias changes. Short 
 Short
Short


