XAU/USD 45-Minute Professional Technical Analysis 1. Market Structure
The chart shows a broad bullish recovery structure after the sharp decline toward the 4,340–4,350 area.
The important sequence is:
4,340 → 4,435 → pullback → potential continuation
Recent price action has produced a series of higher lows, keeping the short-term structure constructive.
The latest move shows rejection from approximately 4,430–4,440, followed by a strong bearish candle. This indicates a short-term retracement rather than a confirmed bearish trend reversal.
2. Key Support & Resistance
Major Resistance: 4,430–4,440
This is the immediate supply zone. Price recently rejected this area aggressively.
A decisive 45-minute close above 4,440 would strengthen the bullish continuation setup.
Above 4,440 → next target 4,460.
Immediate Support: 4,380–4,390
This is the first important demand area to monitor.
If buyers defend this zone, the bullish structure remains valid.
Major Support: 4,340–4,350
This is the key structural swing-low area.
A decisive break below this zone would significantly weaken the bullish setup.
3. Market Structure Break
The chart contains several MSB points.
The recent bearish MSB around 4,390–4,400 indicates that short-term momentum temporarily shifted bearish.
However, the subsequent recovery toward 4,430\+ shows that sellers have not yet established full control.
Current structure:
Bullish higher-timeframe structure + short-term bearish retracement.
4. Bullish Scenario
Preferred scenario:
Price retraces toward 4,380–4,390 → buyers defend the zone → bullish reversal → break above 4,430–4,440.
Potential targets:
TP1: 4,420\
TP2: 4,440\
TP3: 4,460\
Extended target: 4,480+
A confirmed 45-minute close above 4,440 would provide stronger bullish confirmation.
5. Bearish Scenario
If price fails to hold 4,380, the correction could extend lower.
Potential downside levels:
4,380 → 4,360 → 4,340
A decisive break below 4,340–4,350 would invalidate the immediate bullish structure and increase the probability of a deeper correction.
6. Trade Bias
Current Bias: Moderately Bullish
I would avoid chasing price around 4,398–4,400 after the rejection from the highs.
The better risk/reward area is around:
BUY ZONE: 4,380–4,390
Look for confirmation such as:
• Bullish rejection candle\
• Bullish engulfing candle\
• Formation of a higher low\
• Bullish MSB\
• Strong momentum expansion
If confirmation appears, the first objective is 4,430–4,440, followed by 4,460.
7. Professional Trade Plan
BUY ZONE: 4,380–4,390\
INVALIDATION: Sustained break below 4,340–4,350\
TP1: 4,420\
TP2: 4,440\
TP3: 4,460
Alternative breakout setup:
BUY after a confirmed 45-minute close above 4,440.
Targets: 4,460 → 4,480
Final Assessment
XAU/USD remains structurally bullish, but the market is currently experiencing a short-term correction after rejection from 4,430–4,440.
The key level is 4,380.
Above 4,380: bullish structure remains intact, with potential targets at 4,440 and 4,460.
Below 4,340: bullish structure becomes invalid and a deeper correction becomes more likely.
Best approach: wait for price to reach a key level and confirm the reaction rather than entering in the middle of the range.  Long
Long
MCX Crude Oil: Will it BREAKOUT ?Crude Oil is currently sitting at a very important technical hurdle, with price approaching the upper boundary of a consolidation pattern that has been developing since the sharp rally seen during March–April 2026.
The interesting part is that this consolidation resembles a Bullish Pennant formation.
📊 What does the chart show?
Crude Oil witnessed a sharp impulsive move higher earlier in 2026, followed by a period of consolidation.
Since the April–June period, price has broadly formed:
🔹 Lower highs — indicating that sellers have been capping rallies.
🔹 Higher lows — indicating that buyers are stepping in at progressively higher levels.
This has resulted in a contracting triangular structure, which is characteristic of a pennant/triangle-type consolidation.
The important question now is:
Will this consolidation resolve on the upside?
🚨 THE BIG HURDLE
The upper trendline has been tested multiple times, particularly around the April–June 2026 highs.
Every previous attempt to move through this zone has encountered selling pressure.
However, the latest price action is different.
Crude has gradually moved higher from the July lows and is now approaching the upper resistance trendline around ₹9,100–₹9,200 on the chart.
The September 9 candle closed around ₹9,129, putting price directly at this crucial zone.
A decisive breakout and daily close above the trendline would therefore be technically significant.
📈 WHAT IF THE BREAKOUT HAPPENS?
If Crude Oil convincingly breaks above the upper trendline with strong price action and volume, it could signal that the multi-month consolidation has ended.
The first indication would be:
₹9,200+ → Breakout confirmation
After that, traders could watch for the previous swing-high zones and potential measured-move targets.
The height of the broader pennant can also be used to estimate a potential breakout objective, although such targets should be treated as projections rather than guaranteed levels.  Long
Long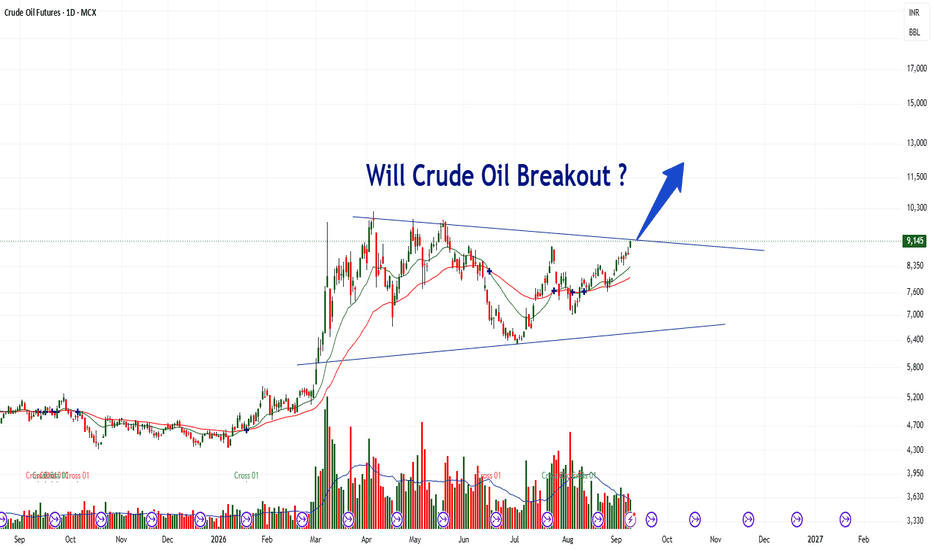
 Long
Long
 Education
 Long
Long
H1 Bearish Retest Below Trendline
Market Pulse
Gold is trading cautiously as markets wait for fresh U.S. inflation data. Strong August jobs data pushed the probability of a September Fed rate hike back to around 60%, which remains a headwind for Gold. At the same time, a softer U.S. dollar is giving price some support.
Oil prices are also near multi-week highs, adding inflation risk. The next key signals will come from U.S. PPI on Thursday and CPI on Friday, ahead of the Fed meeting next week.
What the Chart Says
XAUUSD remains bearish on H1.
Price is still trading below the descending trendline after the strong decline from the 4,500–4,512 area. The recent recovery failed to change the main structure, so sellers still have the short-term advantage.
Gold is currently reacting around the 4,385–4,400 OB + liquidity zone. This support may create a temporary rebound.
The key area above is 4,433–4,457, where the 0.50–0.618 Fibonacci retracement meets the descending trendline and nearby liquidity.
For me, this is the cleaner area to watch for the next bearish reaction.
Levels That Matter
4,500–4,512 — Major rejection
4,475–4,486 — Higher liquidity
4,435–4,450 — Liquidity + trendline
4,433–4,457 — Fibonacci resistance
4,385–4,400 — OB + liquidity
4,356–4,368 — Support + liquidity
My Main Plan
The main plan remains bearish.
I prefer waiting for a rebound toward 4,433–4,457 rather than selling directly near support.
If price reaches this area and sellers return with clear confirmation, Gold could move back toward 4,385–4,400 first.
A clean break below this zone may then expose 4,356–4,368.
What I Need to See
I want to see price stay below the descending trendline and form another lower high around the Fibonacci resistance area.
A sustained H1 move above 4,457 would weaken the immediate sell setup, while a break above 4,486 would suggest a stronger recovery.
Final Read
The H1 trend still favors sellers, but Gold is currently sitting near support. I prefer waiting for the rebound and selling from a better resistance area, rather than chasing the move lower.
Inflation data later this week could bring stronger volatility, so confirmation remains important. XAUUSD | 4H BULLISH PROJECTION
Gold recovered above 4,390 support after a breakdown—suggesting a possible bear trap. Price is now testing the descending trendline.
🔍 Confirmation needed: A 4H breakout above 4,410–4,417, followed by a successful retest.
📍 Projected retest zone: 4,410–4,417
🎯 Resistance 1: 4,426
🎯 Resistance 2: 4,444–4,445
🎯 Resistance 3: 4,474–4,475
❌ Invalidation area: Below 4,390
⚠️ Breakout remains unconfirmed. Trendline rejection could weaken the recovery; losing 4,390 could expose 4,360–4,340 again.
TAMIL TRADING EDUCATION
Educational only | Not SEBI registered | No buy/sell recommendation | Trading carries risk. Trade wisely. Long 
Trendline Rejection Keeps Bears in Control
Fundamental Analysis
Gold remains cautious after strong U.S. jobs data lifted expectations for a September Fed hike to around 60%. Oil near $100 is adding inflation risk, while a softer dollar provides some support. Markets now focus on PPI Thursday and CPI Friday.
Technical Analysis
On H1, Gold rejected the descending trendline and the 4,435–4,442 liquidity zone, then moved back toward 4,400.
The structure remains bearish below this resistance after the recent CHoCH. Volume Profile also shows strong activity around the upper 4,430 area, making any rebound important.
The next downside liquidity sits near 4,380, followed by 4,365 SSL.
Important Key Levels
4,485–4,495 — BSL / Major Resistance
4,435–4,442 — Liquidity / Trendline Resistance
4,380 — Liquidity
4,365 — SSL
Trading Scenario
Sell priority remains on a weak rebound into 4,435–4,442 followed by bearish confirmation.
Target: 4,380 first, then 4,365 SSL.
Invalidation: H1 acceptance above the liquidity zone and descending trendline.
Overall View
The H1 bias remains bearish below the trendline. Rather than chase the current drop, the cleaner setup is to wait for a rebound and follow the next bearish wave.
Will Gold retest 4,440 first, or sweep 4,380 directly? Short 
XAUUSD — Sell the H1 Fibonacci Retest
Fundamental Analysis
Gold remains cautious as stronger August U.S. payrolls keep the probability of a September Fed hike near 60%. Rising oil prices are adding inflation risk, while the softer U.S. dollar provides some support. Markets now turn to Thursday’s PPI and Friday’s CPI, which could materially shift Fed expectations and XAUUSD volatility.
Technical Analysis
On the H1 chart, XAUUSD is trading near 4,399 after rejecting from the 4,438–4,440 area and compressing between descending resistance and rising support. The preferred sell zone is 4,438–4,455, where Fibonacci resistance, the marked supply area, and the descending trendline converge. If price rebounds into this zone and fails to reclaim it, sellers may target 4,410 first, followed by the 4,365–4,380 demand/liquidity area.
Important Key Levels
Current price: 4,399.21
Main sell zone: 4,438–4,455
Short-term support: 4,380–4,395
Short-term resistance: 4,420–4,440
Liquidity area: 4,365–4,380
Main target: 4,365–4,370
Invalidation: above 4,465
Trading Scenario
Main Sell Setup
Entry: 4,438–4,455
Stop Loss: 4,468
Take Profit 1: 4,410
Take Profit 2: 4,380
Take Profit 3: 4,365–4,370
Sell Condition
Wait for price to recover into the sell zone and show bearish confirmation. A long upper wick, bearish engulfing candle, failed trendline reclaim, or H1 close back below 4,438 may confirm renewed seller pressure. If price breaks and holds above 4,465, the bearish setup is no longer valid.
Overall View
The H1 structure remains corrective bearish while price stays below the descending resistance and Fibonacci value area. The preferred plan is not to chase shorts near current support, but to wait for a recovery into 4,438–4,455. A confirmed rejection could reopen 4,410 and then the 4,365–4,380 demand zone. Hot PPI or CPI data could reinforce the bearish case, while softer inflation may support a stronger recovery.
Do you expect gold to retest 4,438–4,455 before moving back toward 4,365? Short 
 Long
Long
 Long
Long
Long 
MAXHEALTH Looks Interesting After This Breakout + Retest SetupMax Healthcare: Breakout Done. Now The Real Test Begins!
I've been watching MAXHEALTH for quite some time, and the recent price action finally got my attention.
The stock has already broken above its long term falling resistance trendline. After the breakout, price moved higher and now we are seeing a pullback towards the breakout area.
For me, this is the important part now 👇
Breakout is already done , now we need to see if buyers can defend the retest.
Price is coming back towards the 1015–953 buying zone .
If this zone holds and buyers step in again, the next move can be interesting.
Above the nearby resistance, the chart opens towards 1080 → 1135 , with a positional target around 1315 .
I'm not expecting a straight line move from here. A healthy retest or some consolidation is completely fine.
The key question is simple, will buyers defend the breakout?
For all important levels, entry zone and invalidation, check the chart above.
What do you think about MAXHEALTH?
Is this retest an opportunity or do you expect more downside first?
If you like this analysis, don't forget to Boost, comment and Follow for more setups.
Disclaimer: This is only my personal technical view for educational purposes. Please do your own research and manage risk before taking any trade or investment decision.
— @TraderRahulPal
SCA Registered Financial Influencer (Dubai, UAE)
 Long
Long
◈ XAUUSD — Elliott Wave Recovery Above 4,350 ◈ XAUUSD — Elliott Wave Recovery Above 4,350
Gold is recovering again after bouncing from the one-week low area near 4,350. From Kelly’s view, the chart suggests that XAUUSD may be building a short-term bullish Elliott Wave structure, but buyers still need confirmation because price remains inside a larger descending channel.
The key idea is simple: geopolitical tension can continue to support safe-haven demand for gold, but the technical structure still needs a clean break above short-term resistance before the bullish wave becomes stronger.
⟡ Market structure
Gold is currently trading around 4,394, after reacting from the lower support area near 4,350–4,360. This reaction shows that buyers are trying to defend the correction low.
The current price is sitting near a short-term decision zone around 4,385–4,405. If gold holds above this area, the next bullish push may target 4,440–4,450 first, then the stronger resistance zone near 4,465–4,480.
The larger structure is still inside a descending channel, so the 4,465–4,480 area is very important. A clean breakout above this zone would support a stronger recovery toward 4,520–4,540.
➤ Key levels
◌ Current price area: 4,394
◌ Short-term buy zone: 4,385–4,405
◌ Key support: 4,350–4,360
◌ Deeper support: 4,320–4,330
◌ First resistance: 4,440–4,450
◌ Main breakout zone: 4,465–4,480
◌ Next upside target: 4,520–4,540
⌁ Elliott Wave view
The chart shows a possible bullish recovery after the previous bearish wave completed near 4,280.
Wave (1) may have formed from the lower support area.
Wave (2) corrected back toward 4,350–4,360 and found buyers.
If this low holds, wave (3) may push toward 4,440–4,450.
Wave (4) may create a short pullback near the current structure.
Wave (5) could extend toward 4,465–4,480, where the descending channel resistance is waiting.
If gold breaks above 4,480, the recovery structure becomes stronger and price may continue toward 4,520–4,540.
▸ Trading scenario
Preferred bullish scenario:
Entry: Buy around 4,385–4,405 if price gives bullish confirmation
Stop Loss: Below 4,350
Take Profit 1: 4,440–4,450
Take Profit 2: 4,465–4,480
Take Profit 3: 4,520–4,540
Alternative scenario:
If gold breaks below 4,350, the bullish wave setup becomes weaker. In that case, price may retest 4,320–4,330 before buyers try to rebuild the structure.
◌ Invalidation
The bullish view becomes weaker if gold loses 4,350 and fails to reclaim the current buy zone. A deeper break below 4,320 would shift short-term pressure back to the downside.
⌁ Kelly’s view
Kelly’s main view is cautiously bullish while gold holds above 4,350–4,360. The geopolitical background may continue to support gold, but the chart still needs confirmation above 4,440 and 4,480.
If buyers defend the current zone, gold may continue toward 4,465–4,480, then possibly 4,520–4,540.
Do you think gold will break the channel resistance, or retest 4,350 once more before the next rally?
Long 
H1 Bullish Reclaim Toward Upper Liquidity
XAUUSD is trading around 4,430 after recovering from the 4,360–4,375 Major Demand + POI and reclaiming the short-term resistance structure. The latest H1 price action is beginning to shift from bearish delivery into a recovery phase, although the market still faces important supply overhead.
The macro backdrop remains mixed. Friday’s strong U.S. payroll report pushed expectations for a September Fed hike to around 60%, but the U.S. dollar is currently subdued as markets wait for fresh inflation data. Meanwhile, Brent crude has moved above $97 as Middle East tensions intensify, keeping inflation risks elevated and adding another layer of volatility for gold.
The next major U.S. catalysts are PPI on September 10 and CPI on September 11, both released at 8:30 a.m. ET. These reports could materially shift Fed expectations ahead of the September policy meeting.
Technical View
The H1 chart shows a meaningful recovery after price reacted from the 4,355–4,375 Major Demand + POI and formed a higher low.
Price has now pushed back above the 4,400–4,420 Key Reclaim / Resistance area. Holding this reclaimed structure would support another expansion higher.
The first major upside objective sits at 4,470–4,490 Supply / Resistance. Above that, buy-side liquidity near 4,510 becomes the next target.
The broader bullish recovery remains constructive while Major Demand continues to hold.
Key Zones
Current Price: 4,429.700
Key Reclaim / Support: 4,400–4,420
Major Demand + POI: 4,355–4,375
Supply / Resistance: 4,470–4,490
Buy-Side Liquidity: around 4,510
Bullish OB / Major Demand: 4,285–4,305
Trading Plan
Buy Priority: 4,400–4,420
Condition: wait for an H1 pullback into the reclaimed structure followed by bullish rejection, liquidity-sweep reclaim or higher-low confirmation.
TP1: 4,445–4,450
TP2: 4,470–4,490
TP3: around 4,510 BSL
Important Note
Price is already trading above the reclaim zone, so chasing the current recovery offers weaker positioning.
A deeper correction into 4,355–4,375 would still preserve the recovery structure if buyers defend the Major Demand + POI. Sustained H1 acceptance below this demand would weaken the immediate bullish thesis.
PPI and CPI later this week may also create sharp liquidity sweeps before the next clean directional move.
Buy View
The preferred setup is a controlled retest of 4,400–4,420, followed by confirmed buyer response.
If this zone holds, the path toward 4,470–4,490 remains open. Acceptance above supply would then expose the buy-side liquidity resting near 4,510.
Final View
Gold is showing an improving H1 recovery structure after defending Major Demand and reclaiming short-term resistance.
The main scenario is a retest of 4,400–4,420 followed by bullish continuation, targeting 4,470–4,490 first and the 4,510 buy-side liquidity above.
Can buyers defend the reclaim zone before inflation data drives the next expansion? Long 
XAUUSD – H1 Bearish Reclaim Toward Lower Liquidity
XAUUSD is trading around 4,375 after reacting from the 4,340–4,355 liquidity zone. The rebound has not yet changed the broader H1 structure, with price still trading below the main reclaim area and overhead supply.
Gold remains under pressure ahead of this week’s U.S. inflation data. Strong August payrolls have lifted expectations for a September Fed hike to around 60%, while rising oil prices are adding fresh inflation concerns. Brent is trading near $98–99 after renewed Middle East escalation, creating a mixed environment where geopolitical demand supports gold but higher rate expectations limit upside.
Markets now focus on PPI on September 10 and CPI on September 11. These releases could materially shift expectations ahead of the September 15–16 Fed meeting.
Technical View
The H1 structure remains corrective bearish after price lost the previous recovery trendline and failed beneath dynamic resistance.
Gold recently swept into the 4,340–4,355 liquidity zone and produced a short-term bounce. However, the key technical area is now 4,405–4,420, marked as the Demand / Reclaim Zone on the chart.
Because price is currently trading below this area, it acts as resistance rather than confirmed support.
A controlled recovery into 4,405–4,420, followed by bearish rejection or a lower-high formation, would support another move toward the liquidity resting below.
Above this zone, 4,445–4,460 Intermediate Supply remains stronger resistance. A sustained H1 reclaim above that area would weaken the immediate bearish scenario.
Key Zones
Current Price: 4,375.230
Key Reclaim / Resistance: 4,392–4,403
Intermediate Supply: 4,445–4,460
Previous H2 High: 4,498–4,510
Liquidity Zone: 4,340–4,355
Bullish OB / Major Demand: 4,295–4,310
Trading Plan
Sell Priority: 4,392–4,403
Condition: wait for price to retest the reclaim zone and show bearish rejection, failed acceptance or lower-high confirmation.
TP1: 4,375–4,385
TP2: 4,340–4,355
TP3: 4,295–4,310
Invalidation: sustained H1 acceptance above 4,460.
Sell View
The cleaner setup is not to sell directly around 4,375 after price has already reacted from liquidity.
I prefer a recovery toward 4,405–4,420 first. If sellers defend that zone, the probability of another liquidity sweep toward 4,340–4,355 increases.
If price instead reclaims 4,445–4,460, the bearish structure weakens and the previous H2 high around 4,500 becomes relevant again.
Final View
H1 remains vulnerable while price trades below the reclaim and supply structure. The main scenario is a corrective bounce into 4,405–4,420 followed by bearish continuation toward 4,340–4,355.
With PPI and CPI approaching, liquidity sweeps may become more aggressive before direction becomes clear.
Will gold reclaim 4,420, or will sellers use the rebound to drive price back toward lower liquidity? Short 
XAUUSD – Gold Holds 4,381, Recovery Still Needs Proof XAUUSD – Gold Holds 4,381, Recovery Still Needs Proof
Gold is trying to recover after reacting from the one-week low near 4,350.
Price is now trading around 4,391, but it is still struggling below the 4,400 area. This tells me buyers are active from lower levels, yet the market has not fully confirmed a bullish reversal.
The main reason gold is getting some support comes from weaker USD pressure, especially as demand for the Japanese yen returns. At the same time, geopolitical risk around Iran can also keep safe-haven demand alive. But technically, gold was rejected below the 21-day SMA and is now trying to hold above the 50-day SMA, so this is still a sensitive area.
Technical view:
Gold recovered from the 4,350 support area.
Price is now holding near the 4,381 – 4,390 buy reaction zone.
This zone is important because it aligns with the short-term rising support line.
As long as gold holds above 4,381, buyers still have a chance to rebuild the recovery.
The first resistance is around 4,412.
If price breaks above 4,412, gold may move toward 4,437.
The stronger resistance is around 4,481, where Fibonacci resistance and previous supply are located.
If gold loses 4,381, the recovery becomes weaker and price may retest 4,350 again.
Key levels to watch:
Current price: 4,391
Buy reaction zone: 4,381 – 4,390
Short-term resistance: 4,412
Main resistance: 4,437
Strong Fibonacci resistance: 4,481
Key support: 4,350
Invalidation: below 4,350
Main scenario:
If gold holds above 4,381 and breaks back above 4,412, buyers may try to push price toward 4,437.
A clean breakout above 4,437 would confirm stronger recovery momentum and open the next target around 4,481.
Alternative scenario:
If gold fails to hold 4,381 and closes below the rising support line, the bullish recovery setup becomes weaker.
In that case, sellers may pull price back toward 4,350. If 4,350 breaks, gold may enter a deeper correction phase before buyers return.
Hannah’s view:
Gold is showing a possible recovery, but it is not strong enough to chase yet.
The chart is showing a simple message: buyers need to defend 4,381 and reclaim 4,412. Without that confirmation, gold can still remain under short-term pressure.
Main view: wait for confirmation around 4,381 – 4,412. Holding this area supports recovery toward 4,437 and 4,481. No confirmation means no trade.
Do you think gold will break above 4,412 today, or will sellers push price back to 4,350 first?
Long 
 Long
Long
BRIAN XAUUSD – GOLD STUCK UNDER 4,413, SELLERS STILL ACTIVE BRIAN XAUUSD – GOLD STUCK UNDER 4,413, SELLERS STILL ACTIVE
Gold is trading around 4,398 after another narrow-range session, and the chart is showing a very important message:
Gold is not collapsing yet, but buyers are still not strong enough to reclaim control.
The market remains supported by risk-off sentiment from Middle East tension, but at the same time, hawkish Fed expectations continue to pressure gold. If traders keep pricing in a possible Fed rate hike in September, the US dollar can stay firm and limit any upside attempt from XAU/USD.
This is why gold is moving in a tight range instead of breaking cleanly higher.
The current structure is a battle between short-term buyers defending the lower POC area and sellers waiting above 4,413 - 4,443.
Technical structure
On the 45-minute chart, gold is still trading inside a descending structure after losing momentum from the previous high area.
Price is currently near 4,396 - 4,400, sitting below the important area around 4,413. This level is the first decision point. If gold fails to reclaim 4,413, sellers can continue to pressure price lower.
The Buy POC zone around 4,370 - 4,380 is the nearest buyer reaction area. This is where price may attempt a short-term bounce if sellers push lower first.
Above current price, the 4,443 area is marked as a sell scalping zone. If gold rebounds into this level but cannot break higher, sellers may react again.
The main sell zone remains 4,469 - 4,482. This is the strongest upper resistance on the chart and also the area where a larger rejection can appear if price recovers too fast.
Important zones
Current price area: 4,396 - 4,400
Gold is consolidating in a weak recovery structure.
Important reaction level: 4,413
First level buyers need to reclaim to reduce short-term selling pressure.
Sell scalping zone: 4,440 - 4,445
Short-term rejection area if gold rebounds.
Sell zone: 4,469 - 4,482
Main upper resistance and seller control zone.
Buy POC: 4,370 - 4,380
First buyer reaction zone if price drops lower.
Lower trend support: 4,345 - 4,355
Next downside area if Buy POC fails.
Trading scenario
Priority view: sell reaction from 4,413 - 4,443
Entry:
Look for sell positions only if gold rebounds into 4,413 - 4,443 and shows clear rejection.
Stop Loss:
Above the rejection high or above the 4,443 sell scalping zone.
Take Profit:
TP1: 4,370 - 4,380
TP2: 4,345 - 4,355
TP3: trail lower only if bearish momentum expands
This setup follows the current short-term bearish pressure and the fact that gold is still trading below key resistance.
Alternative buy scenario
If gold drops into the Buy POC zone around 4,370 - 4,380 and shows strong bullish rejection, a short-term buy reaction can appear.
Entry:
Buy only after confirmation around 4,370 - 4,380.
Stop Loss:
Below the local sweep low or below the buyer reaction zone.
Take Profit:
TP1: 4,413
TP2: 4,443
TP3: 4,469 - 4,482 if buyers reclaim momentum
This is only a reaction-buy idea. I would not chase buy while gold is still below 4,413 without confirmation.
Final view
Gold is still moving inside a decision structure.
The market has risk-off support, but Fed rate-hike expectations and USD strength are still limiting the upside. Technically, gold needs to reclaim 4,413 first, then 4,443, before buyers can aim back toward 4,469 - 4,482.
For now, sellers still have the advantage below resistance.
The map is simple:
Below 4,413 = sellers keep short-term pressure.
Reject 4,443 = downside rotation can continue.
Hold 4,370 - 4,380 = buyers may create a reaction bounce.
Lose 4,370 = deeper move toward 4,345 is likely.
Break 4,482 = bullish recovery becomes stronger.
Gold is not weak enough to chase sells at the bottom, but it is also not strong enough to buy blindly.
The best plan is patience: wait for rejection at resistance, or wait for a clean buyer reaction from the POC zone.
Will gold reclaim 4,413 and push higher, or will sellers force one more move into the 4,370 Buy POC first?
Long 
Cochin Shipyard –Weekly Chart|Descending Trendline BreakoutCochin Shipyard is currently approaching a crucial long-term resistance zone on the weekly chart after a prolonged correction from its 2024 high.
The stock has been trading below a descending trendline for an extended period, creating a clear long-term downtrend structure. However, the recent price action shows signs of base formation near the ₹1,200 support zone, followed by a gradual recovery.
More importantly, the current price action appears to be forming a small consolidation/base near ₹1,500–₹1,550 , just below the long-term trendline.
The Important Trigger
The ₹1,550–₹1,600 zone is now a key decision area.
A decisive weekly breakout above ₹1,550–₹1,600 , accompanied by strong price action, could result in a breakout of the long-term descending trendline.
If this happens, it could indicate a potential trend-change attempt rather than just another short-term bounce.
The first important upside zone to watch would be around ₹1,650 followed by higher levels depending on momentum and market conditions.
Key Levels
Current Price: ₹1,554
Breakout Zone: ₹1,550–₹1,600
Immediate Upside Zone: ₹1,650-1950
Major Long-Term Support: ₹1,200
Major Resistance:Descending trendline
Risk to the Setup
A breakout should not be assumed merely because price is approaching resistance.
If the stock gets rejected from the ₹1,550–₹1,600 zone, another consolidation or pullback is possible.
A sustained breakdown below the broader ₹1,200 support would significantly weaken the current bullish structure.
Overall View
₹1,550–₹1,600 is the key zone to watch
Breakout + Weekly Close + Sustained Price Action above the descending trendline could provide a stronger confirmation of a potential long-term trend reversal.
For now, this is an interesting setup at a major decision point — Trendline Breakout or Another Rejection?
Disclaimer :This analysis is based purely on technical chart structure and is intended for educational and informational purposes only. The mentioned levels are technical observations and are not guaranteed targets or returns. This is not investment advice or a recommendation to buy or sell any security.
 Long
Long


