Weekly Analysis - GoldHi Friends, here is detailed weekly analysis.
### Monthly View
The previous monthly candle closed with a positive bias, breaking above the monthly bearish FVG and subsequently inverting it. The resulting iFVG is currently acting as support. On Friday, price reacted precisely from the **CE of the monthly FVG**, indicating strong technical confluence at this level.
Weekly View
Price has formed a Dragonfly candle right at the iFVG area, creating a Turtle Soup setup at the nearest swing level. This is a positive sign for Gold. If price breaks the previous week’s high with conviction, we may witness a strong bullish move.
Daily View
From Monday to Wednesday, price remained bearish, with rejection at the previous week’s low. Wednesday was a good reversal day, where price formed a Turtle Soup setup, followed by a strong upside move on Thursday and Friday.
The move also coincided with major news events, and it appears price was holding the level ahead of these events.
On the daily timeframe, price has now closed above the trendline. If price breaks the current high in the coming week, the breakout could push price toward the next Daily bearish FVG.
Please do follow me if you liked the idea💡...
Disclaimer ⚠️: This analysis is for educational purposes only and does not constitute investment advice. Please do your own research (DYOR) and check with your financial advisor before making any trading decisions. 📚💰
AVALON Fresh Breakout with Strong Volume🔥 Avalon Technologies: Fresh Breakout with Strong Volume
📊 MARKET STRUCTURE SNAPSHOT | NSE: AVALON | DAILY
Closing Price: 2,537.70
Core Trend: Uptrend
Market State: Bullish Structure / Strong Price Expansion
Chart Pattern: No confirmed chart pattern
Candlestick Pattern: None detected
Price Structure: Price is trading above VWAP and all major EMAs, with a strongly developed bullish structure. The session recorded a 13.80% rise and closed at 2,537.70 after reaching 2,618.00, accompanied by exceptionally high volume.
Technicals: Bullish
Volume: Exceptionally High Participation — 4.31M vs 681.52K average
Moving Average Structure: Bullish — Full Bull Stack
CPR & Market Structure: Bullish — NR4 Active
Next Session CPR: Wide — Pivot 2,458.00 | Top 2,497.80 | Base 2,418.20
Model Reference: 2,618.00
Observation References: 3,263.50 | 3,909.10
Resistance References: 2,697.70 | 2,857.70 | 3,097.40
Support References: 2,228.00 | 2,058.30 | 1,898.30
📚 STWP EDUCATIONAL OBSERVATION
Avalon Technologies is showing a strong expansion in its existing bullish structure, with price positioned above VWAP and all major moving averages. The full bullish EMA stack, strong relative strength and exceptionally high volume add significant strength to the current technical structure, with volume reaching approximately 6.33× the average. RSI at 67.45 reflects strong momentum, while Stochastic at 87.41 and CCI at 241.76 indicate that the price is technically extended. The current chart therefore combines strong trend structure, substantial volume expansion and elevated momentum, while the projected wide CPR zone for the next session provides an important reference area for observing subsequent price behaviour.
📚 STWP EDUCATIONAL NOTE
This content is provided strictly for educational and informational purposes only and is intended to help readers understand technical analysis, market structure, price behaviour and related market concepts. The technical levels, reference levels, indicators, support and resistance areas and other observations are for educational study only and should not be construed as investment advice, research advice, financial advice, or a recommendation to buy, sell or hold any security.
Technical analysis and historical price behaviour cannot guarantee future market performance. Market conditions can change due to company developments, corporate results, economic conditions, industry trends, liquidity and broader market sentiment. Readers should conduct their own independent research and consult an appropriately SEBI-registered investment professional where required.
STWP and the author make no representation or guarantee regarding future price movements, returns, performance or outcomes. Past performance is not indicative of future results.  Long
Long
XAUUSD — 4400 Is the Trap Zone XAUUSD — 4400 Is the Trap Zone
Gold gave us a messy week, but the story is actually pretty clear.
Earlier in the week, sellers were in control after price failed to hold the higher range. Every bounce was getting sold, and gold kept drifting lower toward the discount area. Then we saw the market defend the 4,235 - 4,280 zone, which created that short-term recovery into the end of the week.
But here is the part I don’t want to ignore.
This recovery is now pushing directly into a bearish mitigation area around 4,390 - 4,410. That is where trapped buyers from the previous breakdown may meet sellers again. Above that, the stronger HTF supply zone sits around 4,445 - 4,465. So even though gold bounced well from the lows, the bigger structure is still not fully repaired.
In simple SMC language: gold swept lower liquidity, bounced from discount, and is now retesting a zone where sellers may defend the trend.
The current price around 4,378 is sitting in the middle. Not cheap enough to buy. Not high enough to sell blindly. This is why patience matters here.
My main view is still bearish while gold stays below 4,410 - 4,465.
If price rejects from the bearish mitigation zone, I would expect a pullback toward the Bullish OB around 4,295 - 4,310. That zone is important. If buyers defend it, gold can build another bounce. But if price breaks below that OB, the next sell-side liquidity around 4,260 - 4,235 becomes exposed again.
For bulls to take real control, gold needs to break above 4,465 and hold. Without that, any move into supply still looks like a possible trap.
Key price zones to watch
Current price area: 4,378
Bearish mitigation zone: 4,390 - 4,410
HTF supply zone: 4,445 - 4,465
Main reaction support: 4,295 - 4,310
Lower sell-side liquidity: 4,260 - 4,235
Bullish confirmation: clean break above 4,465
Invalidation for bearish view: strong close above 4,465
For now, I’m reading this as a recovery into resistance, not a clean bullish reversal yet.
Do you think gold rejects from 4,400 first, or pushes into the HTF supply before dropping?
 Short
Short
Gift Nifty Wave Structure Day time Frame📊 GIFT Nifty Elliott Wave Structural Details
Minor Degree Wave A: Formed and completed in Red Colour.Minor Degree
Wave B Completion Structure:
Wave B develops internally as a Minuette Degree abc structure in Black Colour.
The internal wave c of this black structure forms an Ending Diagonal (Wedge).
The termination of this internal wave c officially completes the entire Minor Degree Wave B.
The Motive Impulse Breakout: A powerful impulse wave breaks out of the Ending Diagonal Wedge, which is labeled as the first sub-wave of the next trend:
Wave C Anticipation?
Minuette Degree Wave ((i)).The Blue Correction Phase: This Minuette Wave ((i)) then undergoes a counter-trend correction, developing as an abc Minuette Degree correction in Blue Colour.
The completion of this blue correction marks the end of Minuette Degree Wave ((ii)).
The Next Impulsive Blast: With the blue corrective phase ((ii)) successfully printing its bottom, the market structure sets the stage for an explosive, highly vertical sequence through Waves ((iii)), ((iv)), and ((v)).
This macro sequence will ultimately complete the larger Minor Degree Wave C.
⚠️ EDUCATIONAL DISCLAIMER & STRUCTURAL VALIDATION NOTEFor Educational Purposes Only:
This Elliott Wave analysis, structural breakdown (Minor, Minuette, and Sub-Minuette degree counts), and color-coded mapping are compiled strictly for educational and analytical purposes. It does not constitute, under any circumstances, direct financial, investment, or trading advice. Index derivatives (Futures and Options) involve extreme leverage, high volatility, and the risk of total capital loss. Any trading execution based on this structure is carried out at the user's independent discretion. Structural Validation Level Analysis (22,248.8):
In Elliott Wave Theory, rules are absolute. The horizontal price level marked at 22,248.8 serves as the line in the sand for the entire macro bullish projection. While above: As long as the market strictly holds above 22,248.8, the structure remains perfectly intact. The completion of the black ending diagonal (wave c of B) followed by the blue wave ((ii)) correction is mathematically valid, keeping the multi-month target toward the 26,200+ Target Area active.If Breached: If a daily candle closes below 22,248.8, the entire structural count is instantly invalidated. A breach means the underlying market structure has shifted, signaling that the corrective phase is not over and preventing any aggressive long configurations from being executed under this specific setup.  Long
Long
XAUUSD — 4,370 Retest Before 4,406?
Gold is trading around 4,386 after extending the M30 recovery above the rising trendline.
The short-term structure remains constructive, but price is now approaching an important resistance area.
The simple read
4,370 is the key breakout support.
If buyers defend this zone, Gold may continue toward 4,398–4,406.
A clean break above 4,406 could open the way toward the upper resistance around 4,437.
If 4,370 fails, the deeper structure support around 4,331 becomes the next important reaction area.
Key price zones
4,370 — breakout support
4,331 — key structure support
4,398–4,406 — major resistance
4,437 — upper resistance target
The M30 recovery is still healthy while price holds above the rising trendline.
But resistance is close.
Do not chase the candle.
Wait for the pullback.
Wait for reaction.
Can 4,370 hold and send Gold through 4,406? Long 
Weekly Outlook: Bullish Retest After Trendline Breakout
Gold enters next week after posting its first weekly gain in four weeks, supported by easing oil prices and the unwinding of bearish positions built ahead of the Fed meeting. The Fed raised rates by 25 bp this week, but traders are now pricing roughly a 55% chance of another hike in October. Meanwhile, the U.S. dollar remains near a seven-week high and the 10-year Treasury yield is hovering around the critical 5% area, so the macro environment is still mixed for Gold.
Next week, attention shifts toward Fed speakers, U.S. PMI data and broader inflation signals. Oil remains above $100 and Middle East tensions are still an important source of volatility, while markets will also monitor the Trump–Xi meeting for potential shifts in global risk sentiment.
SMC View
The H1 chart is showing a meaningful structural improvement.
Price has broken the descending trendline, printed a bullish MSS followed by BOS, and is now consolidating beneath the $4,390–$4,400 bullish BOS area. This suggests bearish delivery has weakened and short-term order flow is beginning to reprice higher.
The cleaner continuation setup is not to chase current price. The $4,320–$4,340 trendline retest / FVG rebalance area remains the strongest discount POI for a potential continuation move.
If buyers defend this area and produce fresh bullish displacement, external buy-side liquidity above becomes the next logical draw.
Main Trading Scenario
Buy Priority: $4,320–$4,340
Condition: Wait for a controlled retracement into the broken trendline / FVG rebalance zone. A liquidity sweep followed by bullish rejection and a lower-timeframe MSS or CHOCH would provide confirmation.
Entry: $4,320–$4,340 after bullish confirmation
SL: Below $4,300 and the confirmed reaction structure
TP1: $4,390–$4,400
TP2: $4,424–$4,440
TP3: $4,445–$4,460
Key Zones to Watch
$4,390–$4,400 — Bullish BOS / immediate resistance
$4,424.395 — Decision POI
$4,425–$4,440 — External BSL / secondary target
$4,445–$4,460 — Premium BSL / major upside draw
$4,320–$4,340 — Main trendline retest / FVG POI
$4,295–$4,310 — Discount Demand
Below $4,295 — Bullish continuation structure weakens
The weekly bias remains Buy, but the preferred approach is to wait for discount rather than chase price beneath resistance.
A retracement into $4,320–$4,340 followed by bullish confirmation would keep the breakout structure constructive and could reopen delivery toward $4,400, then the external liquidity around $4,425–$4,440. If bullish momentum persists, the $4,445–$4,460 Premium BSL remains the larger upside objective.
No confirmation, no trade. Long 
XAUUSD — Bullish Retest After Post-Fed RecoveryMarket Pulse
Gold is holding its post-Fed recovery as lower oil prices, a softer U.S. dollar and easing Treasury yields give buyers some breathing room.
However, the Fed has started tightening again and further rate hikes remain possible. This means Gold may stay volatile even while the short-term recovery continues.
What the Chart Says
XAUUSD is showing a stronger bullish H1 structure after the sharp recovery from the 4,260 area.
Price pushed through the previous CHoCH and reached the 4,390–4,400 main resistance area before starting the current pullback.
Gold is now trading around 4,369, close to the rising support trendline.
The first area I am watching is 4,348–4,358. This zone sits close to the previous breakout structure and could become the first place where buyers return.
If the correction becomes deeper, the 4,325–4,337 area is the stronger support zone below.
As long as these areas hold, the current move still looks like a bullish pullback rather than a full reversal.
Levels That Matter
4,398–4,410 — Main resistance
4,365–4,370 — Rising trendline / current structure
4,348–4,358 — First pullback zone
4,325–4,337 — Main support zone
4,260–4,270 — Post-Fed swing low
My Main Plan
The main plan remains bullish.
I prefer waiting for Gold to complete the pullback around 4,348–4,358.
If buyers defend this zone and bullish confirmation appears, price could recover toward 4,390–4,400 again.
A deeper move into 4,325–4,337 could still offer a valid continuation setup if support holds.
What I Need to See
I want the rising trend structure to remain intact and the pullback to create another higher low.
A sustained H1 break below 4,325 would weaken the immediate bullish setup and increase the risk of a deeper correction.
Final Read
The H1 structure still favors buyers after the strong post-Fed recovery, but Gold is now correcting from resistance.
For now, I prefer waiting for the pullback and bullish confirmation rather than chasing price higher, with 4,398–4,410 remaining the main upside area. Long 
XAUUSD — Bullish Fibonacci Retest After Post-Fed RecoveryFundamental Analysis
Gold is holding its post-Fed recovery as oil prices and U.S. Treasury yields cool from recent highs, reducing some of the immediate pressure on non-yielding assets. The U.S. 10-year yield has retreated toward 4.93% after briefly trading above 5%, while softer oil prices have eased part of the inflation concern that dominated markets earlier this week.
However, the broader macro backdrop remains restrictive. The Fed raised rates 25 bp to 3.75%–4.00% and signaled that additional tightening remains possible, while global central banks continue to lean hawkish as inflation risks persist. This should keep XAUUSD sensitive to changes in the dollar, yields and energy prices.
Technical Analysis
On H1, XAUUSD is trading near 4,380 after extending the bullish recovery and producing a BOS above the 4,377 structure level.
Price pushed toward 4,390–4,400 before beginning a controlled pullback. The cleaner continuation area now sits around 4,355–4,367, where the Fibonacci 0.618 level near 4,356 overlaps the marked buy zone and rising support structure.
If buyers defend this zone, price may rotate back toward 4,390, followed by the major 4,410 liquidity/high.
A deeper correction could reach the 4,323–4,342 H1 FVG, but this remains secondary support rather than the primary setup.
Important Key Levels
4,410 — Main bullish target / liquidity
4,389–4,400 — Immediate resistance
4,377 — Short-term pivot
4,355–4,367 — Main buy zone
4,342 — Fib 0.786 / support
4,323–4,342 — H1 FVG
Below 4,338 — Immediate bullish invalidation
Trading Scenario
Main Buy Setup
Entry: 4,355–4,367
Stop Loss: 4,338
Take Profit 1: 4,389
Take Profit 2: 4,400
Take Profit 3: 4,410
Buy Condition
Wait for a controlled retracement into 4,355–4,367 and clear bullish confirmation.
A liquidity sweep, long lower wick, bullish engulfing candle, or H1 reclaim above 4,367 may confirm renewed buyer pressure.
If price breaks and holds below 4,338–4,342, the immediate bullish continuation setup should be reassessed.
Overall View
The H1 structure has shifted toward bullish continuation after the post-Fed recovery and break above 4,377.
The preferred plan is not to chase price around current resistance. A pullback into 4,355–4,367 offers a cleaner location to look for continuation toward 4,389–4,400, with 4,410 as the main liquidity objective.
Lower oil and yields currently support the recovery, but the Fed’s hawkish policy stance still limits confidence in a one-way bullish move.
Do you expect 4,355–4,367 to hold before Gold attacks 4,410? Long 
Long 
Education 
 Long
Long
 Long
Long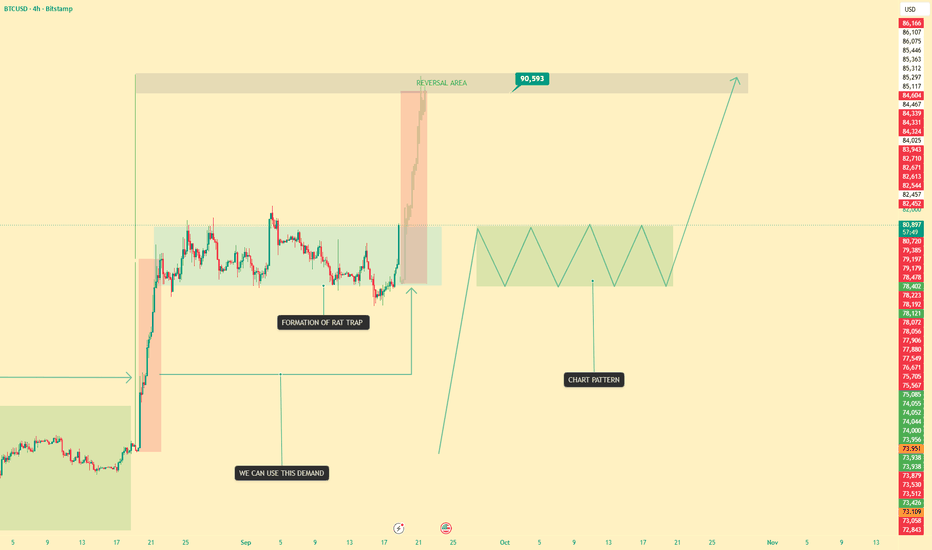
 Short
Short
BTCUSDBTC Levels to Watch
Key BTC levels for the upcoming sessions, based on the marked Demand & Supply zones on the chart.
🔴 Supply Zones
- 78,000 – 78,600
- 80,300 – 81,300
🟢 Demand Zones
- 75,000 – 75,700
- 72,200 – 73,200
These zones are marked as areas to monitor for potential price reaction, rejection, or breakout/retest.
Price action around these levels will be important for understanding the next move.
Educational purpose only — not financial advice.


