HTMEDIA | BUYING AT SUPPORT CONFLUENCEHTMEDIA is bouncing off the Support Trendline & Demand Zone. Stochastic RSI is in oversold Zone & given a crossover. A trade for a 1.5/1 RR can be taken, above 27.95, with a SL of 25.5 & for targets of 31.7.
Always take trades based on your risk appetite.
Happy Trading!
Demand Zone
HDFC life - longIn the past all M&A transactions have taken place at a price to embedded value of 3-3.5
embedded value post acquiring exide life insurance is around 32000.
when the market cap dips below 112000 cr start accumulating the company.
embedded value is the present value of all the future estimated profits on the policies currently written while accounting for the future policy payouts it is calculated by actuarians following the rules set up by IRDAI
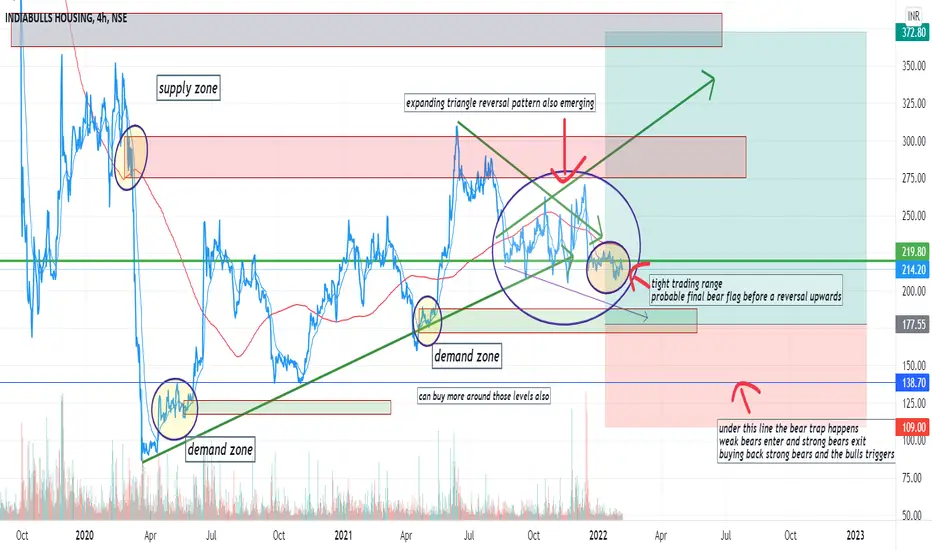
Indiabulls Housing Financecan they refocus only on generating economic profit
there has been a management change
look at the chart for more details
ILong
Astral buy above 2115Hello guys, last few days have been volatile so I was not giving many trades, seeing the market it is now better to take the trades on support rather than on breakout as most of them are failing.
Astral retraced 78.6% from last swing high.
Sitting above flip level
Near Demand/Supply conversion zone
Bounced from 200 MA cluster
Immediate resistance at 2095 - 2110
Buy above 2115
Targets mentioned in the chart above
Please LIKE, COMMENT and SHARE to motivate and support me. I'll keep on posting new ideas on Indices & Stocks. Be sure to follow so that you don't miss any good trades that might have been rewarding.
Any comments and critiques will be appreciated even if it's of opposite view as a trader can also be right so many times.
HDFC good buy at 2470 near aboutHDFC near it's weekly demand zone and according to demand zone good to buy at 2470 or near by price.
HLong
Only for study purpose ... Here is a zone where price takes rejection multiple times, the White line is 0.618 ratio of #Fib Retracement which is also important.
Take entry on breaking of a zone with strong green candle and .618 ratio with the SL of 690 as shown in the graph.
Targets are as shown in the graph if the price breaks all-time high then trail SL and hold the trade for higher targets.
All Targets are planned by Fib levels.
Also, Earning is there on month-end let see what will happen.
Tech Mahindra swing tradeOn a Daily time frame, Tech Mahindra is forming Higher High and Higher Low. Based on Demand and Supply power pattern, A buying zone has been formed known as FTR. Buying price as per zone - 1650.5 , Stop loss would be below the zone, i.e. - 1576 and the target would be new higher high. Safe trader can keep a target 1820 which is near its recent high as it can act as a resistance. Thus making a Risk reward of more than 1:6.
Phillips carbon forecastFundamental analysis :
In fundamental wise the current share price is trading 2.44 rupees below its PE valuation. According to Graham number valuation share is trading below 11.5% of its current share price 239.85. In last five years debt on company has reduced. Debt to equity ratio is 0.33 which is consider as good value and the current ratio is 1.39 which is also a good sign. Net income and revenue has grown well in last five years.
Technical analysis :
1. You can see inverted head and shoulder pattern has breakout and retested at 237.20
2. If market moves up from retest zone target will be 269.60
3. Stock price has possibility to move down to 232.05 and change its direction upside.
4. In case share price moves below its two retest zone.
Support 1 - 219.95
Support 2 - 207.45
CAUTION : I am not a SEBI registered financial advisor. This is only for educational purpose. Investment in stock market is highly risky. This is only for information purpose. It is very important to do your own analysis before you invest or trade in stock market.
PLong
USDINR looks attractive buyUSDINR formed a bullish hammer after entering the Daily Demand Zone. USDINR has been falling continuously for almost 10days.Looks attractive buy at around 74.48- 74.50 with stoploss of 74 for target of 75.00, 75.50, 76.00
ULong
CADILAHC in Daily, Weekly and Monthly Demand ZoneCADILAHC has been consolidating little above Daily time frame Demand Zone after entering the daily Demand Zone. It has also touched the Weekly and Monthly time frame Demand Zone. Looks a good buy candidate price will gain strength by closing above 475 on daily candle closing basis.
C
BankNifty might reach 20 EMA by increasing the priceAccording to a famous theory, the price usually comes to the 20 EMA, or the Moving Average comes to the price.
For this week in BankNifty, it looks like it is reacting from a Daily Demand Zone to reach a 75 Minutes Supply Zone, where effectively lies the 20 EMA. So, the price might move up to 35800, but it is not that strong a conviction since the Demand Zone is tested once, and so, I am putting this idea for Neutral.
If you are wondering why there are no gaps on my chart, they are due to a script I recently published. Check it out!
Have a nice day!!!