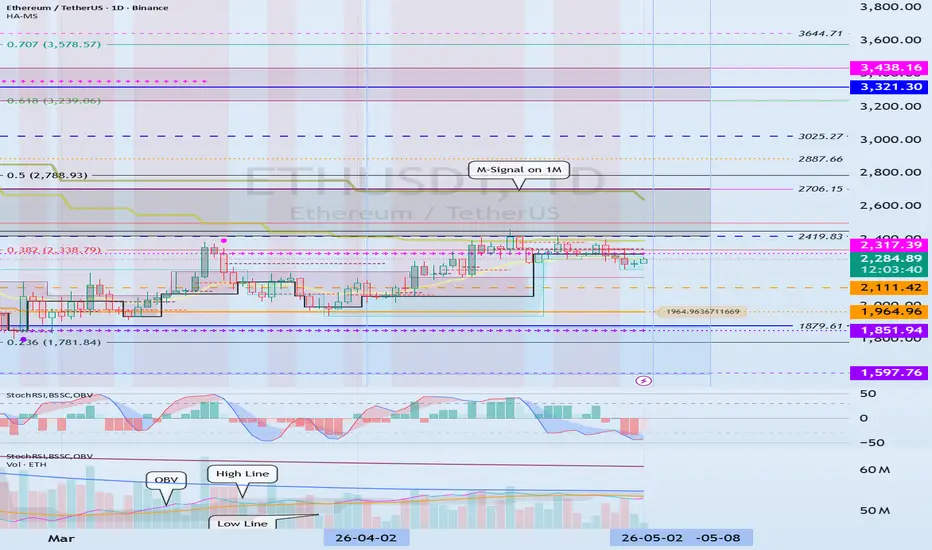
Volatility Period: Around May 2nd ~ Around May 8th
Hello?
Nice to meet you, fellow traders.
If you "follow" me, you can always get new information quickly.
Have a great day today.
------------------------------------
(ETHUSDT 1D Chart)
This volatility period is expected to continue until May 3rd.
However, since the next period of volatility is around May 8th, we should trade under the assumption that this current volatility will last from May 1st to 9th at most.
-
To sustain the uptrend in the mid-to-long term, the price must maintain a
Descending Channel
BTC/USDT 4H chart 🔻 1. Trend – still down
You have a clear descending channel:
• Lower highs
• Lower lows
• Price is bouncing between trend lines
➡️ You are currently closer to the middle/upper part of the channel, which usually means:
👉 Higher probability of rejection than breakout
⸻
📊 2. Key Levels
🟢 Resistance:
• 76,730 – 77,300 → first resistance zone (already tested)
• 78,500 → strong resistance + previous structure
• Upper channel line (approx. 77,500–78,000)
👉 If this doesn't break = declines resume
GOLD - The market is under pressure. Waiting for news...ICMARKETS:XAUUSD , following a decline, is consolidating within the 4555–4607 range. Traders are holding their breath in anticipation of the Fed’s interest rate decision, which will be announced later on Wednesday.
Oil prices and the dollar have resumed their upward trend due to the deadlock in U.S.-Iran negotiations, as well as the UAE’s decision to leave OPEC+. High oil prices are fueling inflation expectations and hawkish bets on the Fed. The market is pricing in a rate held in the 3.5–
Bearish Structure Holding Strong – Pullback Before Next Leg DownThe market is currently moving within a well-respected descending channel, clearly indicating a dominant bearish trend. Price action has consistently formed lower highs and lower lows, confirming that sellers remain in control. Recently, after a strong impulsive drop, the market entered a short-term consolidation phase near the mid-range, suggesting a temporary pause rather than a reversal.
The current price behavior hints at a potential corrective pullback toward the upper boundary of the chan
#UNI Could Be Minutes Away from Expansion – Wave C Setup Explain
Yello Paradisers! Are you prepared for what could be the most decisive phase in #UNIUSDT structure, or are you about to get caught on the wrong side of a deceptive corrective move?
💎#UNI appears to have completed a textbook corrective wave B within a broader downtrend. The descending channel structure that contained price action has now been broken, signaling a potential transition phase. More importantly, we have observed a clear change of character (CHoCH) in market structure, supported by a
GOLD - Technical AnalysisICMARKETS:XAUUSD bounced off the 4668 support level toward the end of Friday’s session following a long squeeze, thereby breaking the local bearish structure. The market’s next move depends on geopolitical developments.
The dollar closed Friday in the red, and technically, the index looks poised to continue its decline. Oil is stagnant. Gold, technically, is still under pressure from bears, but Friday’s session closed above Thursday’s close, which gives us positive signals, provided that
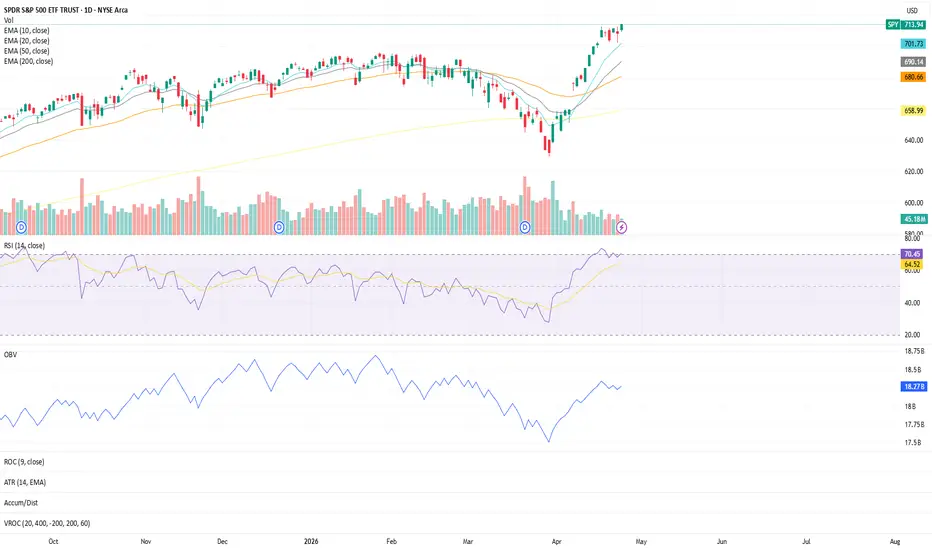
SPY Structure Update (Daily Chart)Price continues to respect short-term momentum structure as the trend rebuilds off the recent pullback.
The 10 & 20 EMAs are maintaining upward curvature, showing sustained short-term momentum
The 50 EMA has turned higher as well, though with a more gradual slope — indicating developing support rather than aggressive expansion
The 200 EMA continues its steady upward trajectory, keeping the broader structure intact
Since the March 30th pivot, both RSI and OBV have shown constructive behavior:
Next Volatility Period: Around May 2nd ~ Around May 8th
Hello?
Nice to meet you, fellow traders.
If you "follow" me, you can always get new information quickly.
Have a great day.
------------------------------------
This volatility period is expected to continue until April 23rd.
We need to see if the price can rise above the downtrend line (3) and maintain its position after the volatility period ends.
If the price fails to rise and falls,
1st: 74342.27
2nd: 67720.67 ~ 69978.65
You must check if it receives support near the 1st and 2nd levels
GOLD - Geopolitics and two scenarios... Gold, under downward pressure, is testing the 4,668 support level. However, technical factors are weak against the backdrop of fundamental and geopolitical developments. Iran may resume negotiations...
Gold remains under pressure due to a combination of strong U.S. data and geopolitical uncertainty, which is driving investors toward the dollar rather than gold. However, the second round of peace talks between the US and Iran is expected to begin today. If the talks take place, combined with
#XMR Just Flipped Structure — Is This the Trap?
Yello Paradisers! Are you ready for what could be the most misleading move on #XMR before the next major expansion phase begins?
💎#XMR has now completed its B/X corrective leg and confirmed a breakout from the descending channel, which is an early signal of a shift in market behavior. We are clearly seeing a change of character, as price is no longer forming lower lows and lower highs, but instead transitioning into a structure of higher highs and higher lows. This shift was supported by a cle
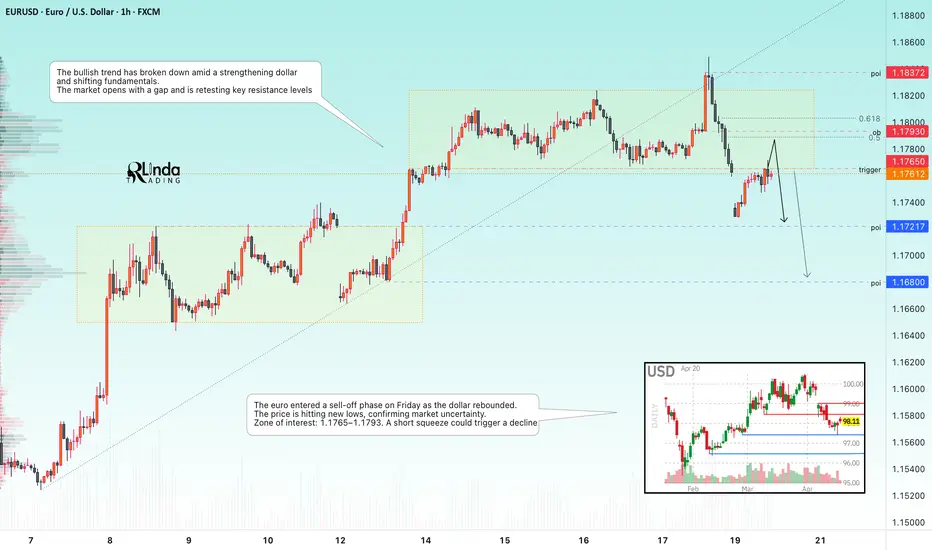
EURUSD - A short squeeze could trigger a drop to 1.168FX:EURUSD is shifting its market tone amid changing fundamentals. Negative sentiment is triggering a sell-off and causing the session to open with a gap.
The currency pair is breaking its bullish structure amid a strengthening dollar and shifting fundamentals. The market opens with a gap and is retesting key resistance levels.
The euro entered a sell-off phase on Friday amid a dollar rebound. The price is hitting new lows, confirming market doubts. Zone of interest: 1.1765 – 1.1793. A shor
GOLD - The market didn't trust Friday's positive newsICMARKETS:XAUUSD reacted positively to the de-escalation of the conflict in the Middle East on Friday; however, a couple of hours later, the market lost faith in the news and resumed selling...
Iran closed the Strait of Hormuz in response to the breakdown of the ceasefire in Lebanon. The geopolitical backdrop is deteriorating. The market may react aggressively to any escalation: the dollar and oil up, gold down.
Direct peace talks with the U.S. have been suspended until Washington changes
What a clean breakout setup looks likeOn the 1-hour timeframe, BULL is showing a textbook transition from compression into expansion, supported by alignment across structure, momentum, and participation.
Structure (EMA Alignment):
Price is now trading above the 10 / 20 / 50 EMAs, all stacked above the 200 EMA
This reflects short-term trend control with higher timeframe support building underneath
Prior consolidation phase created a tight base → now resolving higher
Momentum (RSI):
RSI holding in the upper range (~80+)
Indicates
#AAVE Fakeout Loading — Traders Beware
Yello Paradisers! Are you noticing how this #AAVE “bearish continuation” might actually be setting up a trap that most traders will fall right into?
💎#AAVE is showing a clear shift in momentum, and this is where the situation becomes very interesting. The recent swing low failed to retest the bottom of the larger descending channel, which already signals that the downside pressure is not as strong as before. At the same time, the RSI is printing a divergence, indicating that bearish momentum
Need to verify if a new high is forming
Hello?
Nice to meet you, fellow traders.
If you "follow" me, you can always get new information quickly.
Have a great day today.
------------------------------------
The key indicators are as follows:
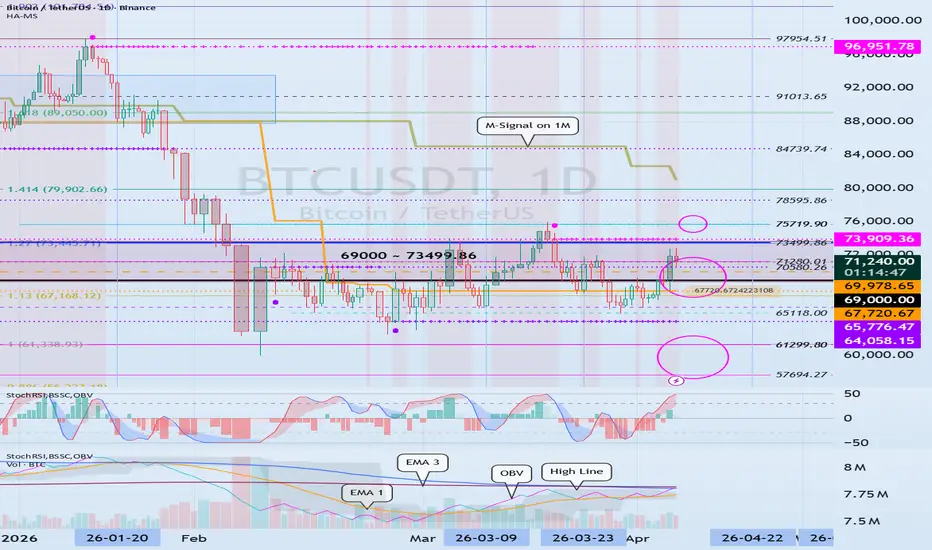
1. To sustain the uptrend in the medium to long term, the price must maintain a level above the M-Signal indicator on the 1M chart.
At this point, if the M-Signal on the 1D chart aligns in the order of M-Signal on the 1W chart > M-Signal on the 1M chart, it is highly likely that a full-fled
Confirming support around 69978.65
Hello?
Nice to meet you, fellow traders.
If you "follow" me, you can always get new information quickly.
Have a great day.
------------------------------------
As the price rises, the HA-Low indicator on the 1W chart is showing signs of forming at the 69978.65 point.
Accordingly, the key question is whether it can find support and rise in the range of 69978.65 to 71058.26.
However, since the StochRSI indicator is in the overbought zone and the OBV indicator is located near the EMA 3 line,
BITCOIN - A break below 70,000 will trigger a further decline BINANCE:BTCUSDT.P , once again under the guise of a local bull run, is reminded that the market is still bearish. The fundamental backdrop has shifted sentiment. The market may decline...
The main issue is geopolitics. Negotiations between the U.S. and Iran have collapsed, which has once again intensified pressure on the cryptocurrency market. Bitcoin failed to break through the 74K–75K resistance and has resumed its sell-off. The negative fundamental backdrop has intensified the pressure.
GOLD - A correction? A more complex geopolitical landscape...ICMARKETS:XAUUSD remained within a range on Friday as it consolidated. A symmetrical triangle has formed amid anticipation of the outcome of negotiations between the U.S. and Iran
Fundamental backdrop: Negotiations in the Middle East have collapsed. The US and Iran are escalating tensions. The former is hinting at a blockade of the Strait of Hormuz, while the latter is firmly holding its ground.
Against this backdrop, oil and the dollar may accelerate their gains and trigger a flight of capita
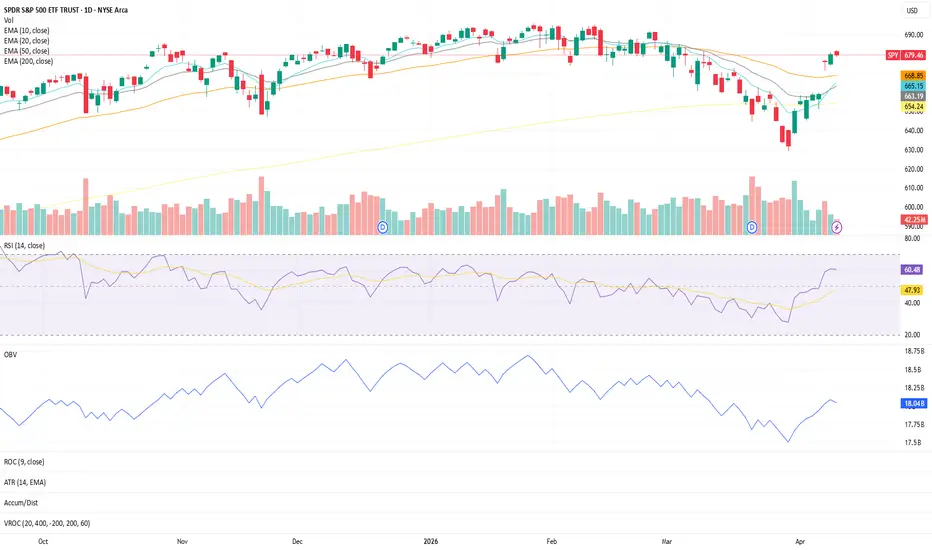
SPY Daily — Structure Holding StrongPrice continues to trade above the 10, 20, 50, and 200 EMAs, with short-term momentum building.
The 10 EMA and 20 EMA are both trending upward, showing continued short-term strength, while the 50 EMA remains flat but stable—acting as a base of support beneath price.
RSI is holding steady around 60, indicating controlled momentum without entering overbought conditions.
On the volume side, OBV has been trending higher since March 30th, suggesting underlying accumulation remains intact.
Overall
Checking for support in the 234.11 ~ 241.05 range
Hello?
Nice to meet you, fellow traders.
If you "follow" me, you can always get new information quickly.
Have a great day today.
------------------------------------
(AMZN 12M Chart)
The important point is the one marked with a circle.
The trend may be determined by whether support is found near this important point, so you need to watch it carefully.
-
(1M Chart)
Looking more closely, the key zones are:
1. 206.16 ~ 239.30,
2. Around 165.73,
3. 70.43 ~ 84.00.
To continue the stair-step
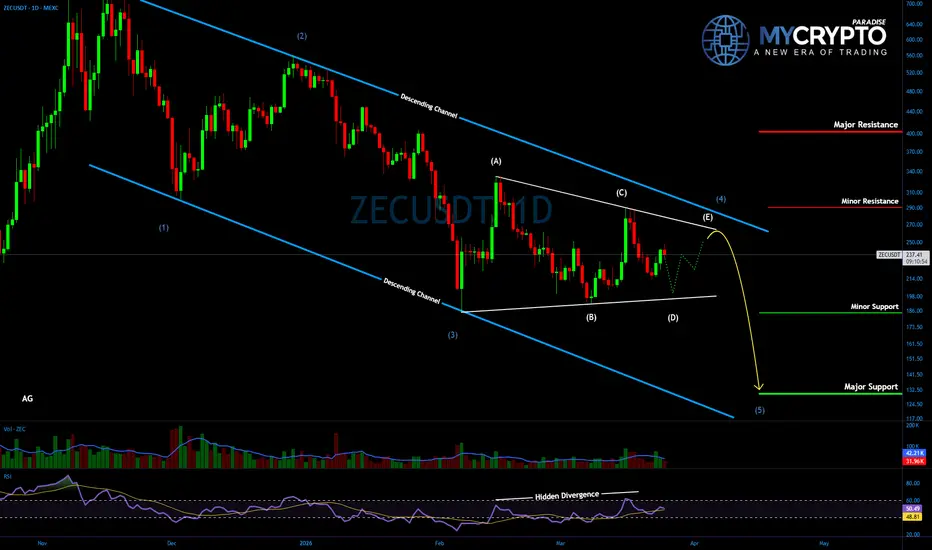
#ZEC VCP Setup: High Probability Trade Forming
Yello Paradisers! Are you ready for what could be the final liquidity sweep before #ZEC reveals its true direction?
💎#ZECUSDT is developing a clean volatility contraction pattern within a Wave 4 corrective phase, a phase where most traders get trapped. Wave 4 corrections are often complex and deceptive, and the current price action strongly suggests that one final move to the downside is still pending before completion. Price respecting a well-defined descending channel, reflecting controlled