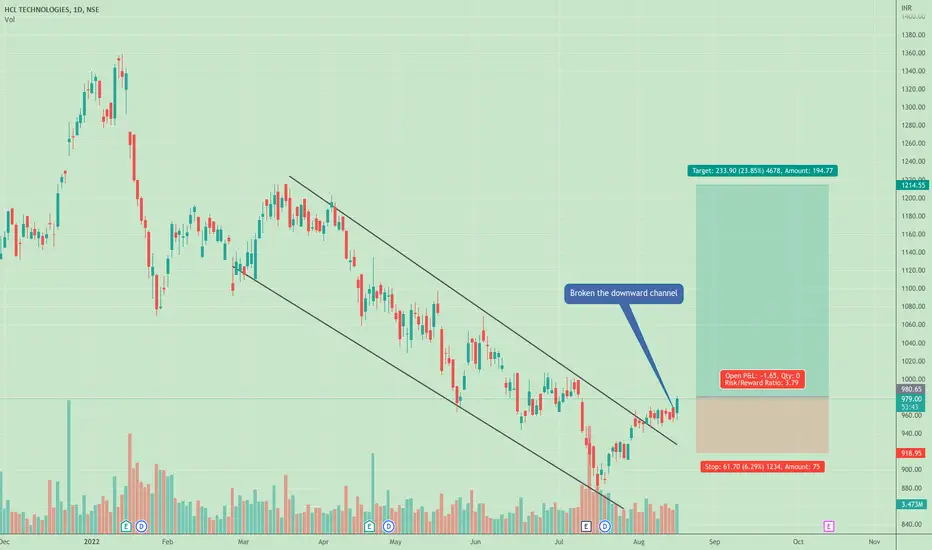
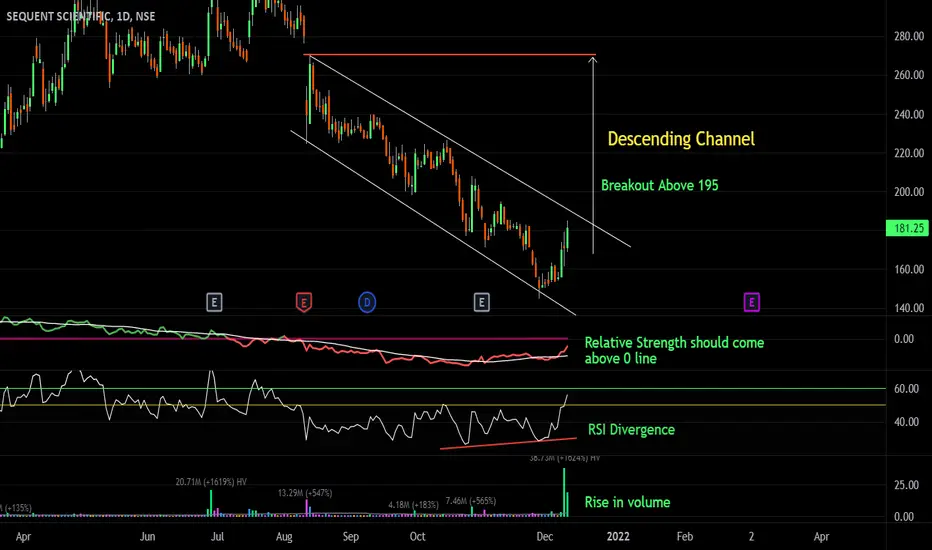
[Positional] HCLTECH Long IdeaHCLTECH has been trading in the narrow channel range from almost last 6 months. The Channel was a descending channel. HCLTECH Was trying to break the channel from last few days- it was trading very little above the edge of the channel. Today HCLTECH has convincingly broken the channel.
Once can LONG HCL with below details:-
Entry:- 980-982 (Trade can be taken now)
SL:- 913 (Ideally the SL should have been placed at 880-881 range i.e. the channel low, but am placing the SL at the mid of c
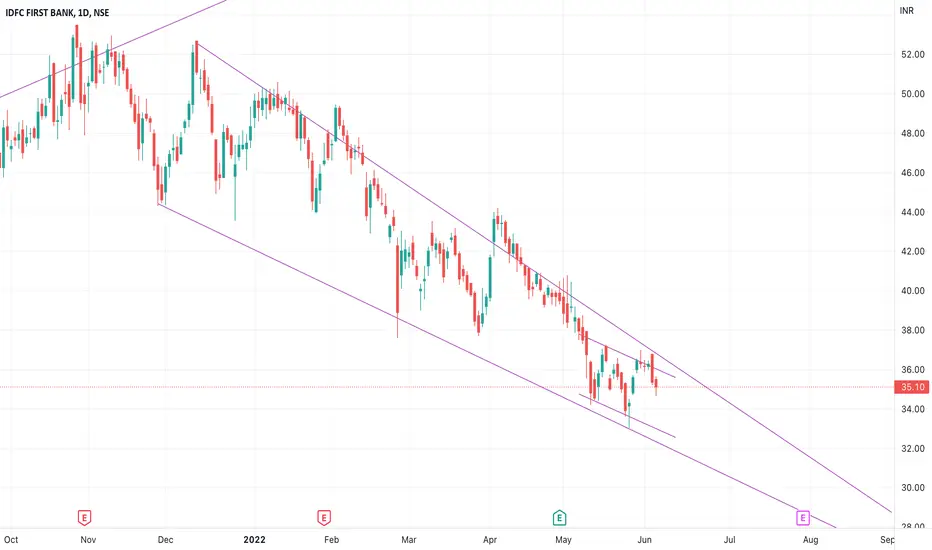
Descending Channel
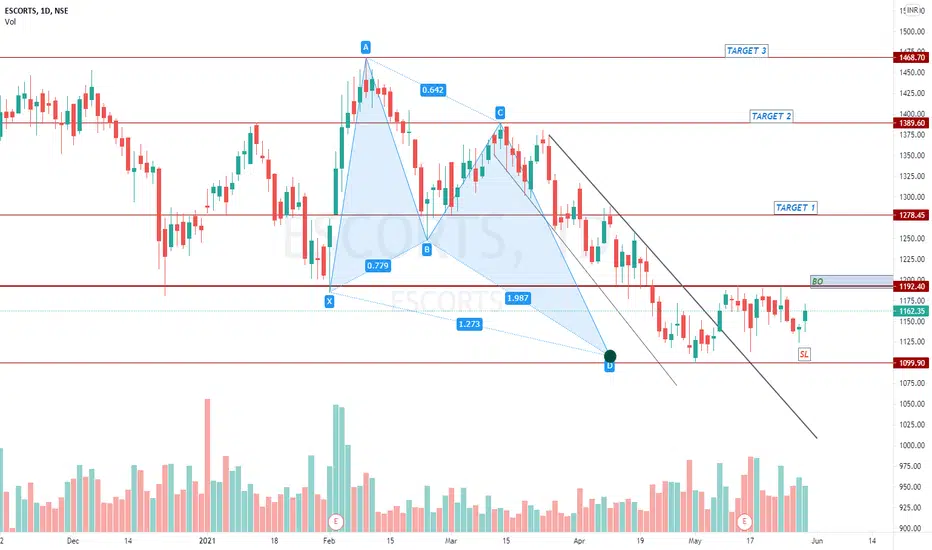
SWING TRADE : ESCORTS1. Buy above BO 1195
2. TARGET 1270/1380/1460
3. SL 1080
Analysis:
1. Breakout happened on descending channel
2. Trend reversal started at harmonic PRZ and support level. Now It is in accumulation phase.
3. Next would be uptrend if it breaks the accumulation zone.
Disclaimer: This is educational purpose only.
Please share your thoughts in the comments section below.
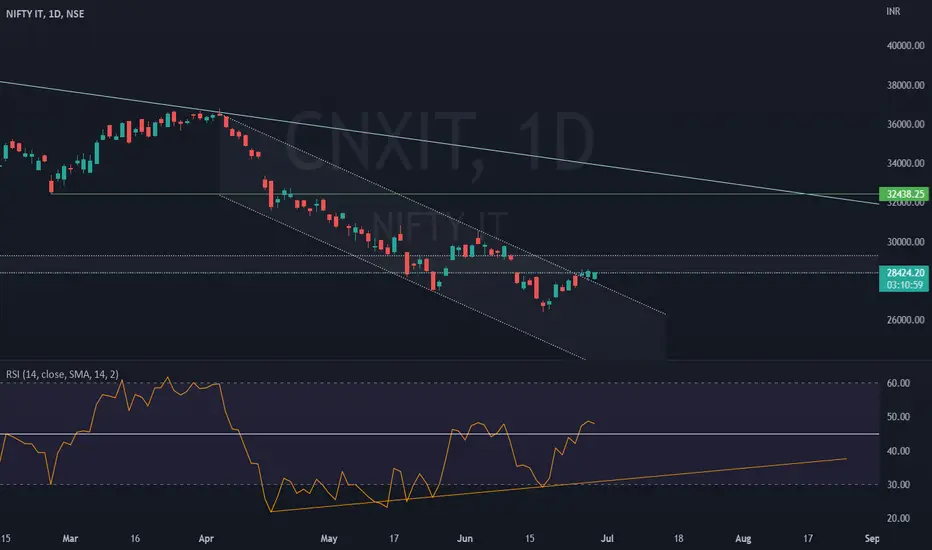
BREAKOUT IN IT SECTOR Indian IT Sector is very close to the breakout area.
This breakout from the falling bear channel is also supported by RSI as we can see the Higher Highs and Higher Lows formation.
Look for an entry in fundamentally strong leaders of this sector.
!!! This is not an investment advice and do your own due diligence before investing/trading on any script !!!
!!! This post is only for educational purposes and not advising anyone to trade on behalf of this trade !!!
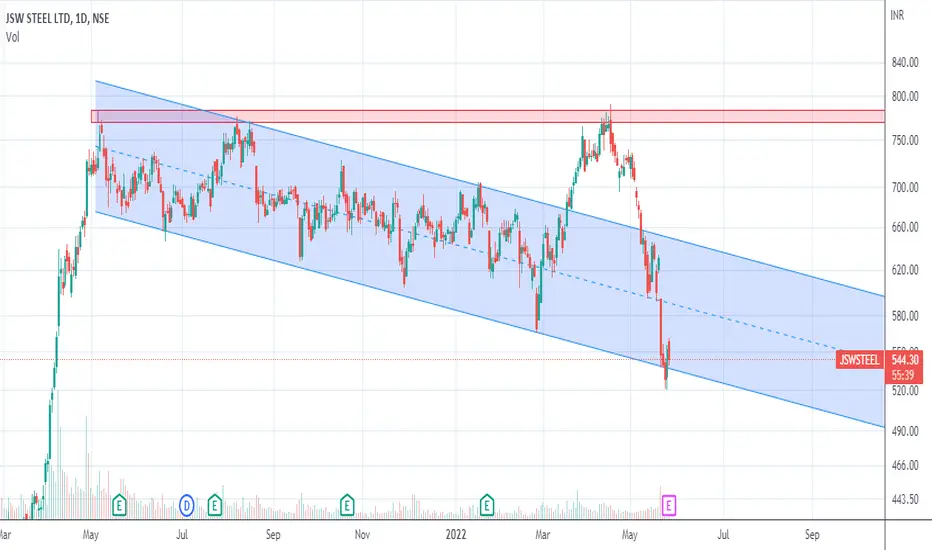
JSWSTEEL AnalysisJSWSTEEL is trading in Descending Channel from the last 1 year, however we did see a breakout above the channel on 17th Marth 2022. Post that price rallied up till previous resistance of 770 and faced selling pressure which pushed price again inside the descending channel. Currently the stock is trading near channels lower level with immediate support at 520 and resistance at 570.
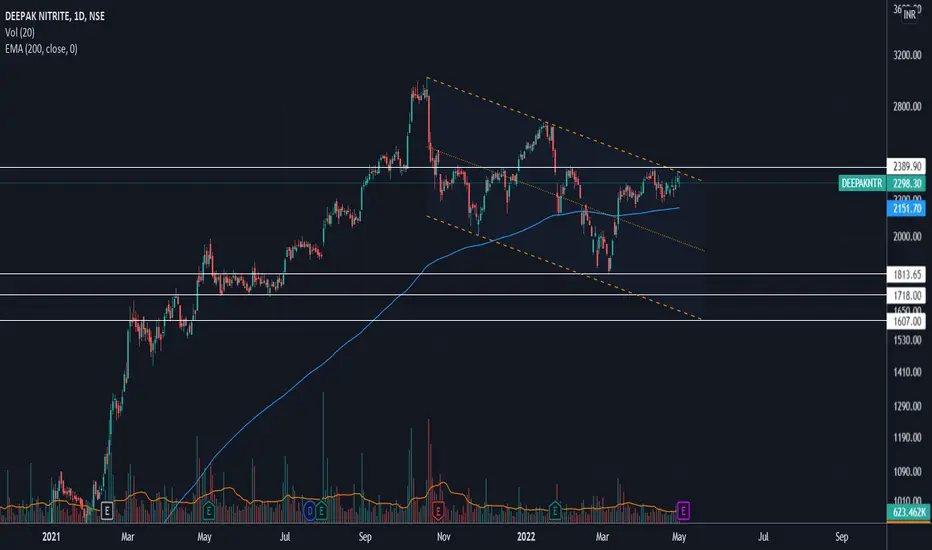
Will DEEPAK NITRITE BreakOut or BreakDown ?DEEPAK NITRITE has been trading in Descending channel for the last few months. However, it is forming a Flag and Pole pattern as per weekly/Monthly charts. The stock has been trading near the channel highs and resistance levels, if it breaks out from these levels, it's likely to reach 3000 levels again.
Cheers! This is as per my Analysis. Feel free to share your view about this. Please do your analysis before trading/Investing.
Happy Trading
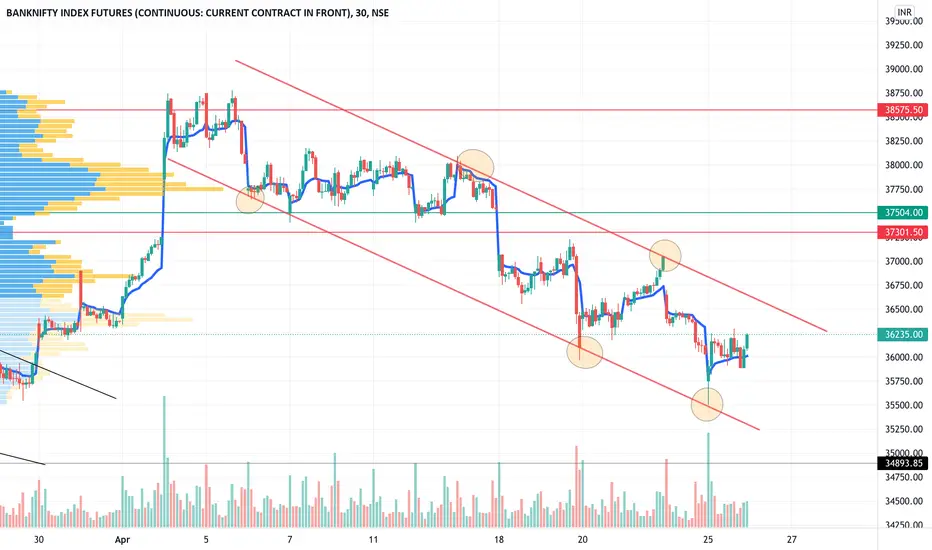
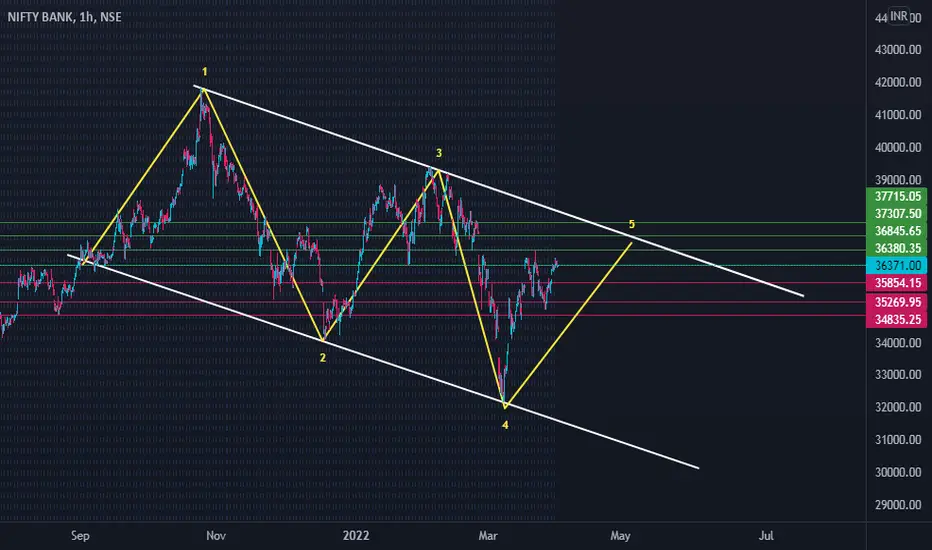
Nifty Bank 30min ChannelNifty Bank fut. perfectly adhering to the descending channel. Long in the tooth, can we anticipate a reversal?
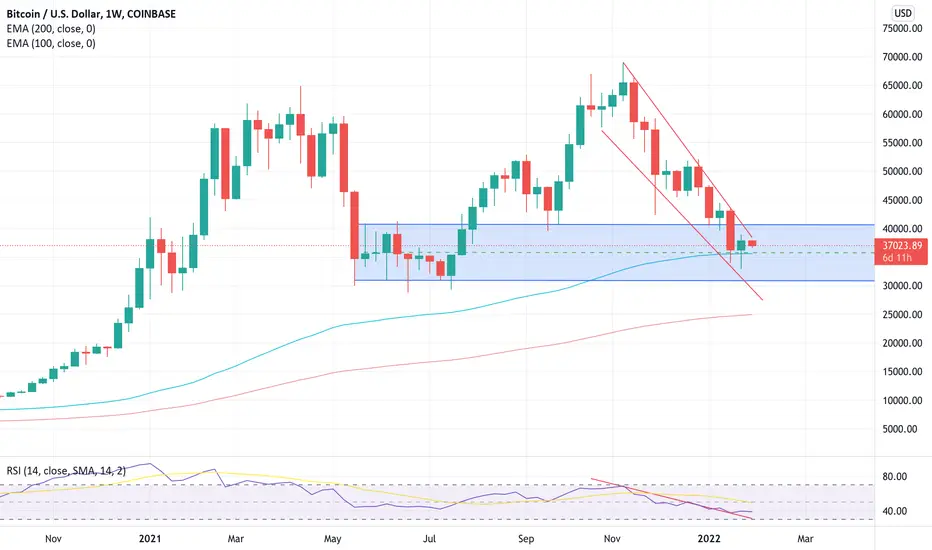
Blue line is VWAP, price comfortably above it shows bullish momentum. Touches to the channel lines marked as well, its a validated working channel.
BLong
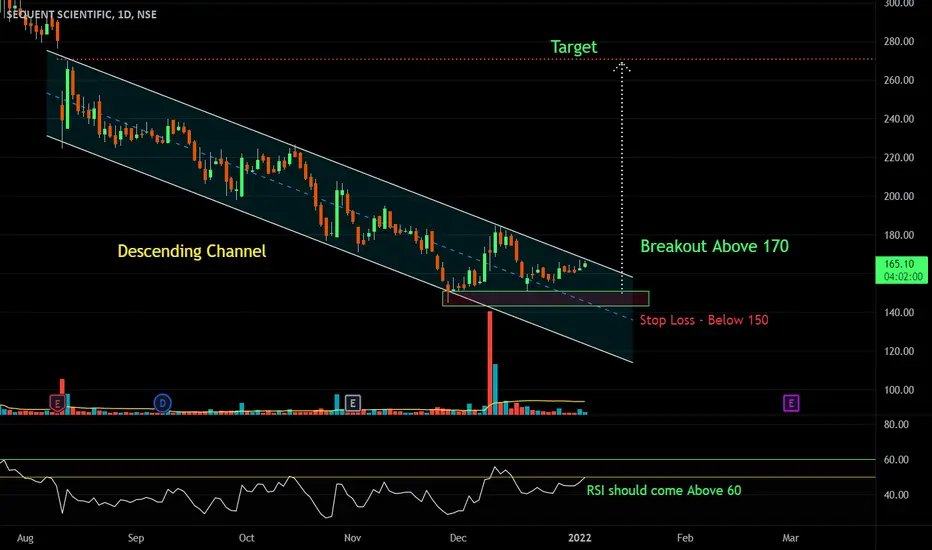
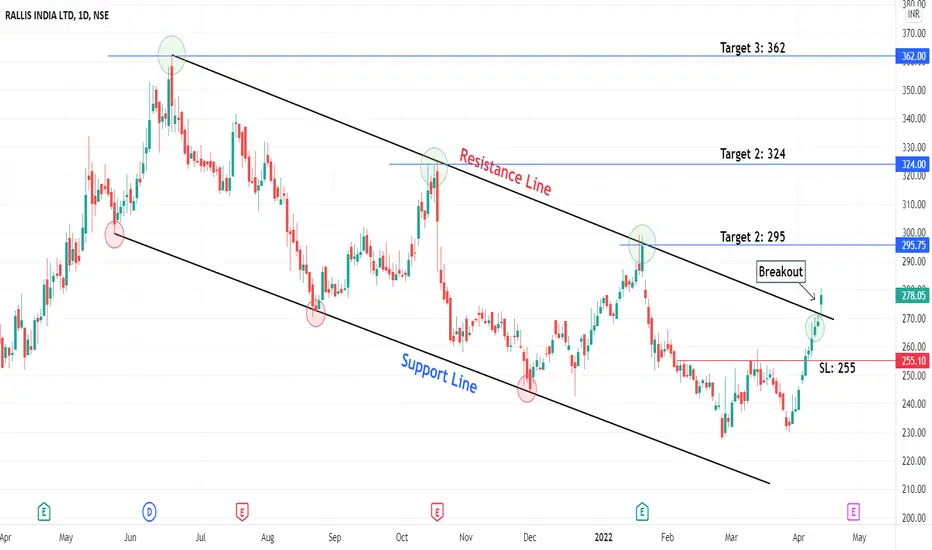
Descending channel breakout in RALLISChart -> Rallis India Daily
We can see descending channel breakout.
CMP: 278
Target: 295, 324, 362
SL: 255
Disclaimer: This is for educational purpose only. This is not any recommendations. I am not SEBI registered. Please consult your financial advisor before taking any action.
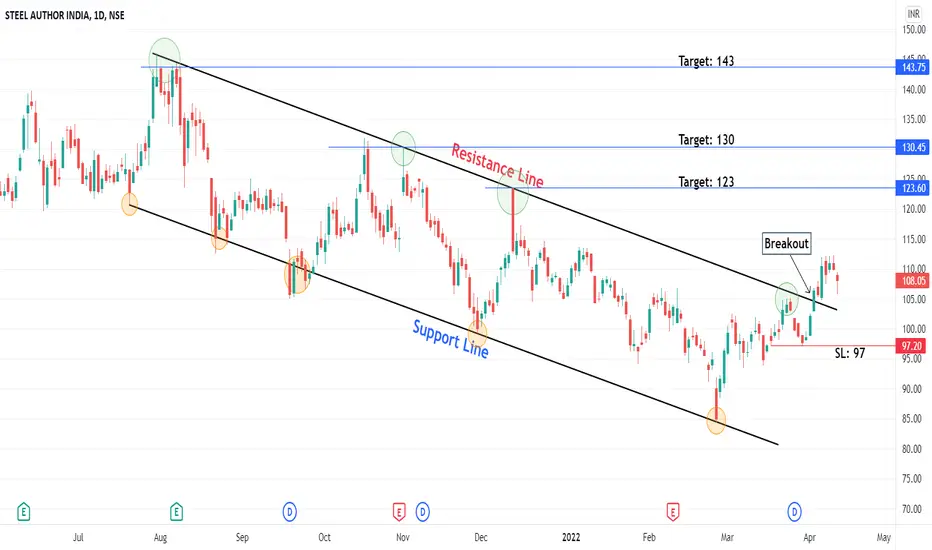
Descending channel breakout in SAILChart -> SAIL Daily
We can see descending channel breakout.
CMP: 108
Targets: 123, 130, 143
SL: 97
Disclaimer: This is for educational purpose only. This is not any recommendations. I am not SEBI registered. Please consult your financial advisor before taking any action.
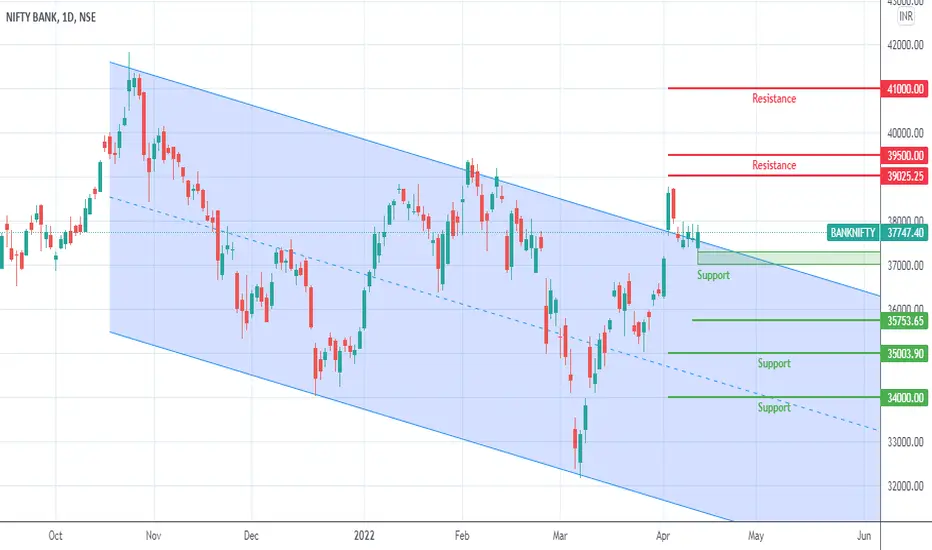
Banknifty AnalysisBanknifty gave breakout from falling channel with a gap up opening on 4th April, However that move didn't sustained well and post that the index saw consolidation at the GAP and today took support from previous month's closing range. Now moving ahead we can see bullish momentum in upcoming days with resistance at 39000-39500, immediate support stands at 37200 and next support is at 37000 & 35700.
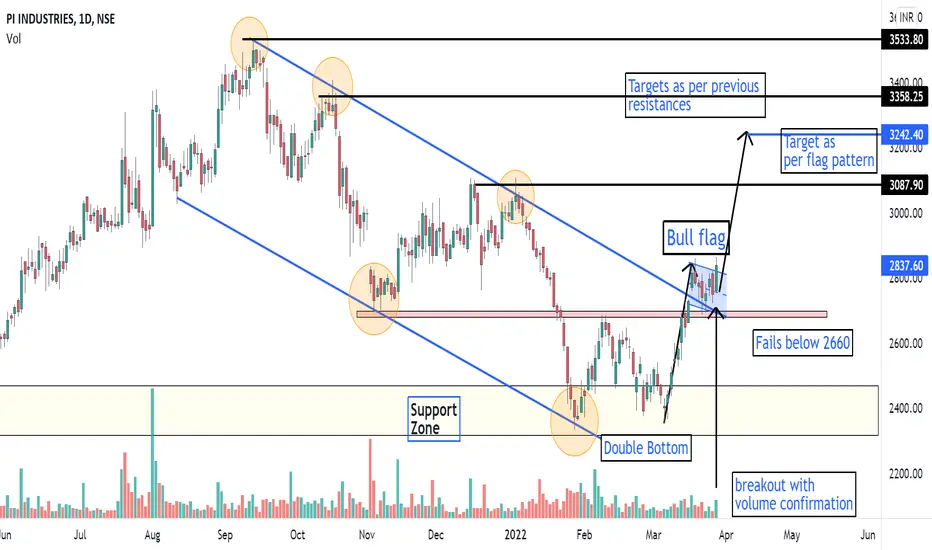
PI INDUSTRIES - Bull Flag + Descending Channel Breakout - Swing The analysis is done on daily TF hence price may take few days to few weeks in order to reach the targets.
Trade setup is explained in image itself.
The above analysis is purely for educational purpose. Traders must do their own study & follow risk management before entering into any trade
Checkout my other ideas to understand how one can earn from stock markets with simple trade setups. Feel Free to comment below this or connect with me for any query or suggestion regarding this stock or Pric
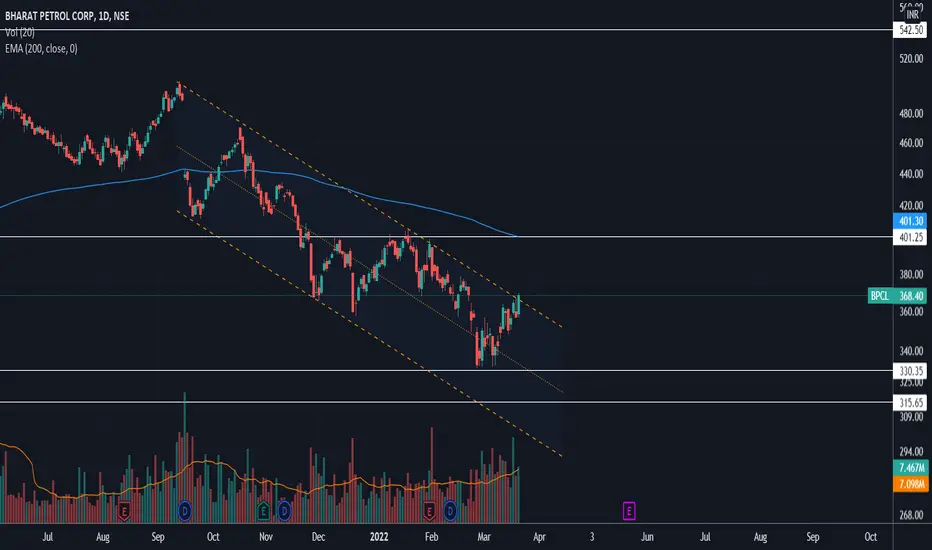
BPCL - A Breakout or A FakeoutBPCL has been trading in Descending channel for a few months. Today, the stock has closed above the resisting line of the channel, with a good amount of volume. Looks like it will reach 400 levels in the near term.
Cheers! This is as per my Analysis. Feel free to share your view about this. Please do your analysis before trading/Investing.
Happy Trading
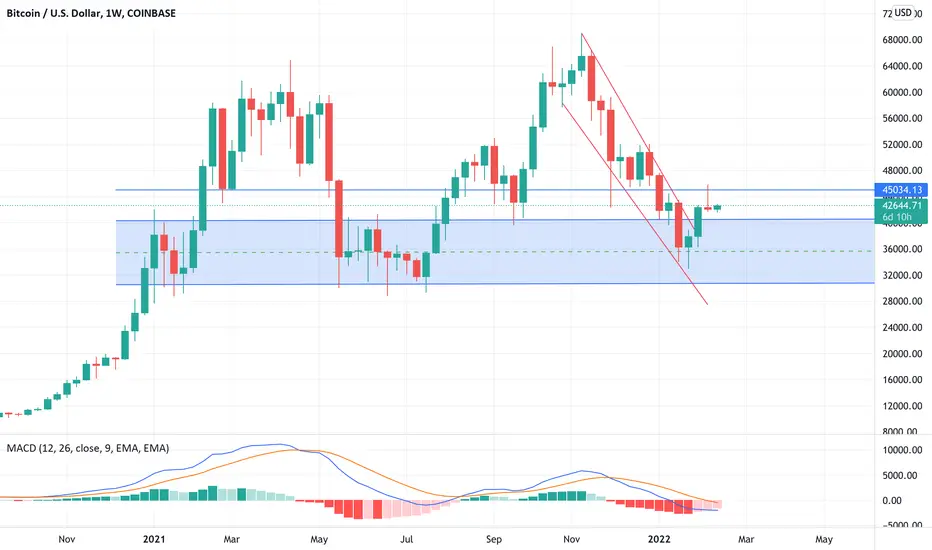
Weekly BTC-USD(14th February)After two weeks of the continuous rally, BTC took a nosedive in the latter part of the last week and declined by ~1%. On the weekly TF, BTC formed an Inverse Hammer candlestick pattern, which indicates that the market is again in control of bears. As the overall trend is still bearish, the recent positive rally can be considered as a pullback. At the time of writing, BTC is trading slightly above $42,500.
On the Daily TF, BTC has given a breakout from its Descending channel formation and is cur
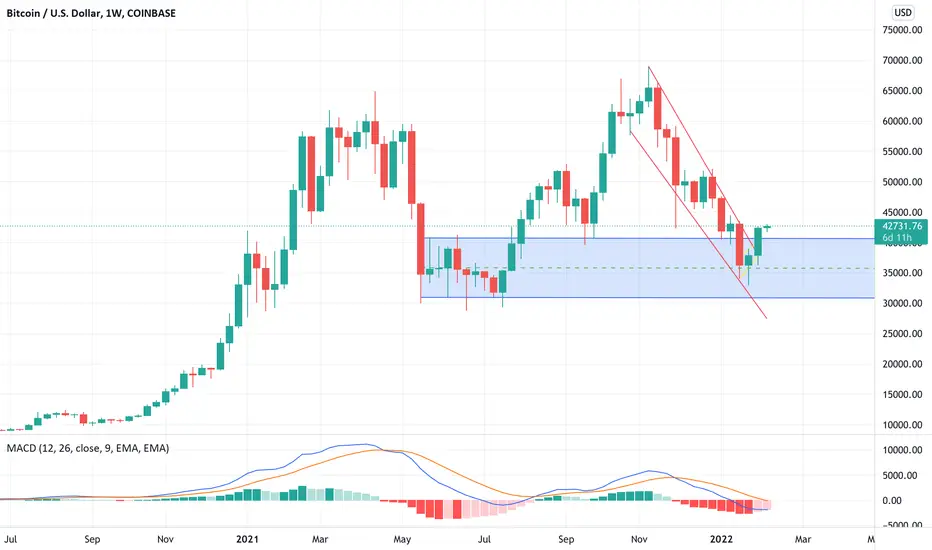
Weekly BTC-USD(7th February)BTC has been showing positive strength since January 24th, bulls have been trying to push the market up for the last two weeks. The combined crypto Mcap has increased by more than 15% in these last two weeks. BTC formed a strong positive candle on the weekly TF after the last week’s Hammer candlestick pattern, which was depicting that we can expect a short term rebound to the higher side.
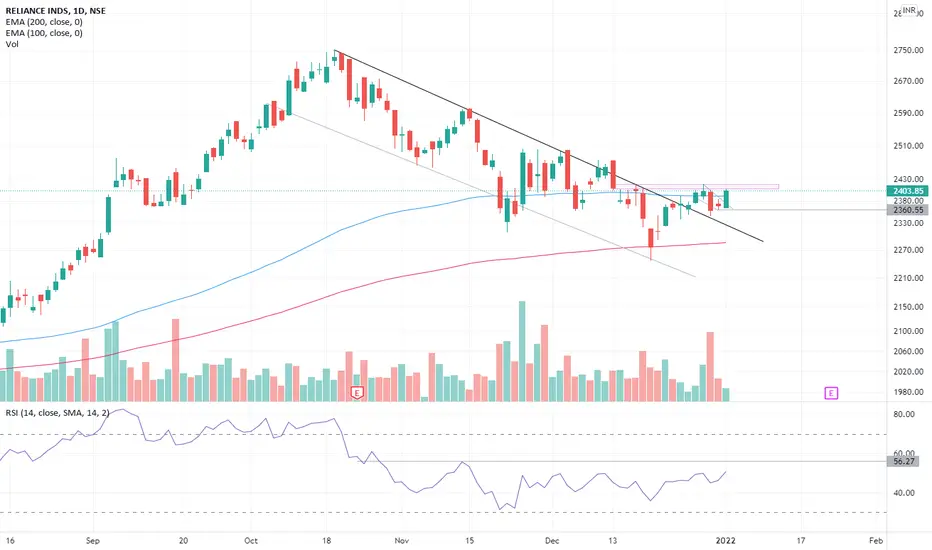
As per the chart patterns, BTC has given a breakout from its descending channel formation and is sustaining
BTCUSDT : Descending Channel BYBIT:BTCUSDT
BTCUSDT : Descending Channel
Pattern : Descending Channel.
What is Channel Trading?
When trading a channel, you use parallel lines connecting the swing highs and swing lows of a market’s support and resistance.
The most common method to mark a channel is by using trend lines.
The swing highs that are marked by the trend line known as the channel’s resistance levels .
The swing lows that are connected to create the channel become the support level.
We can use a chan
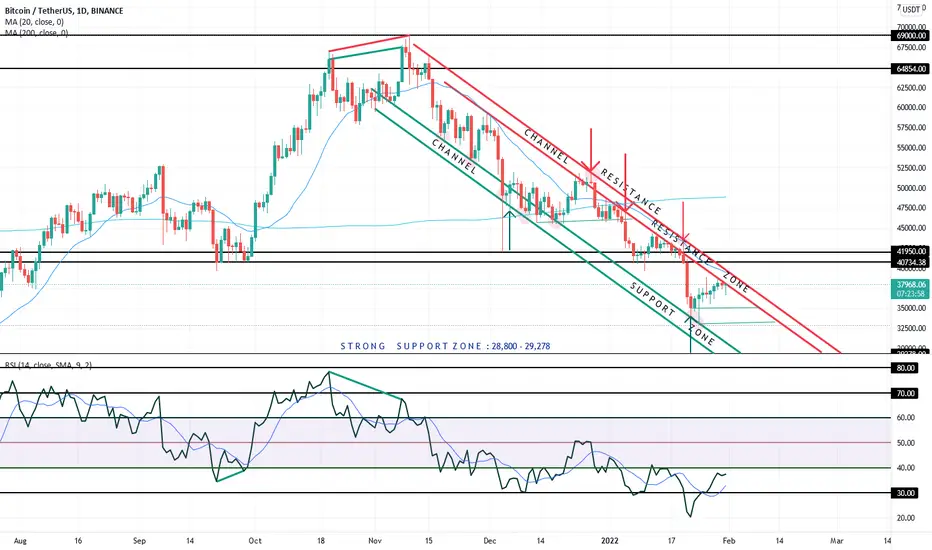
Weekly BTC-USD(31st January)After the continuous declines, crypto markets took a breather last week and closed the week with ~1% gains. BTC also bounced back after making a recent low of $32,933 and closed the week with 4.46% gains. At the time of writing, BTC is trading slightly below $37,000.
BTC formed a bullish Hammer candlestick pattern on the weekly TF, which depicts that we can expect a pullback to the higher side in the coming days, this analysis also coincides by the fact that the Bitcoin balance on exchanges has
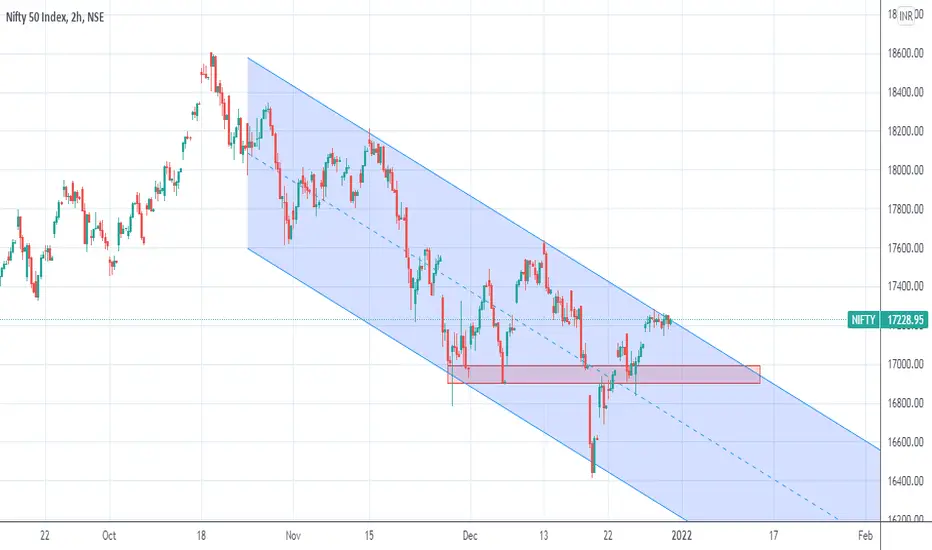
Nifty AnalysisNifty is trading in falling channel and cuurently price is quoting near resistance line of the channel indicating decline in index till 17000-16900, However if Nifty manages to break the Channel then it can face resistance near 17600 price zone. Red box zone can provide Nifty a support level if that breaks then it can go till 16400.