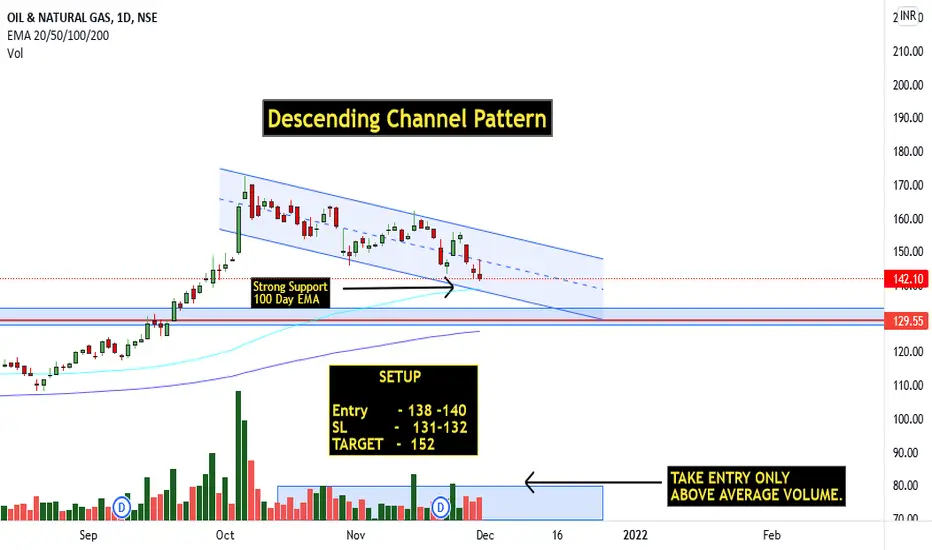
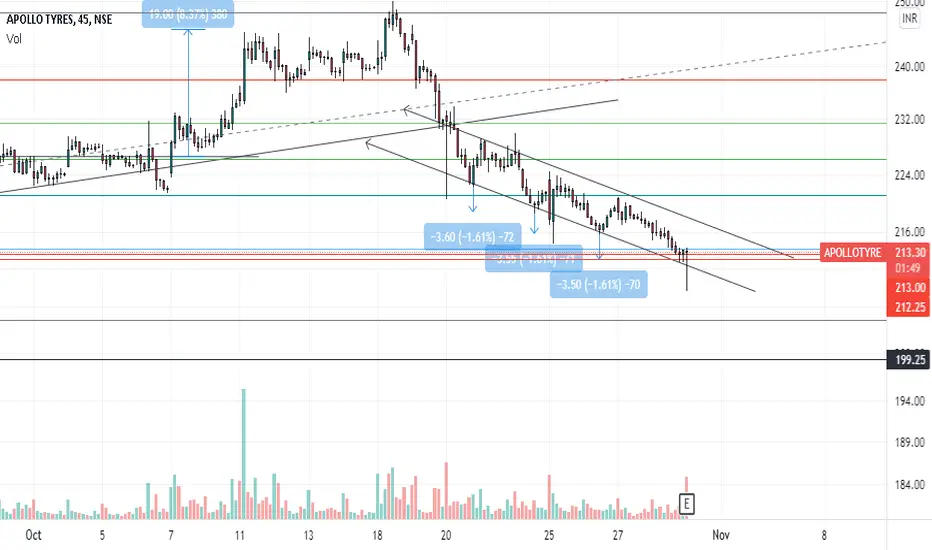
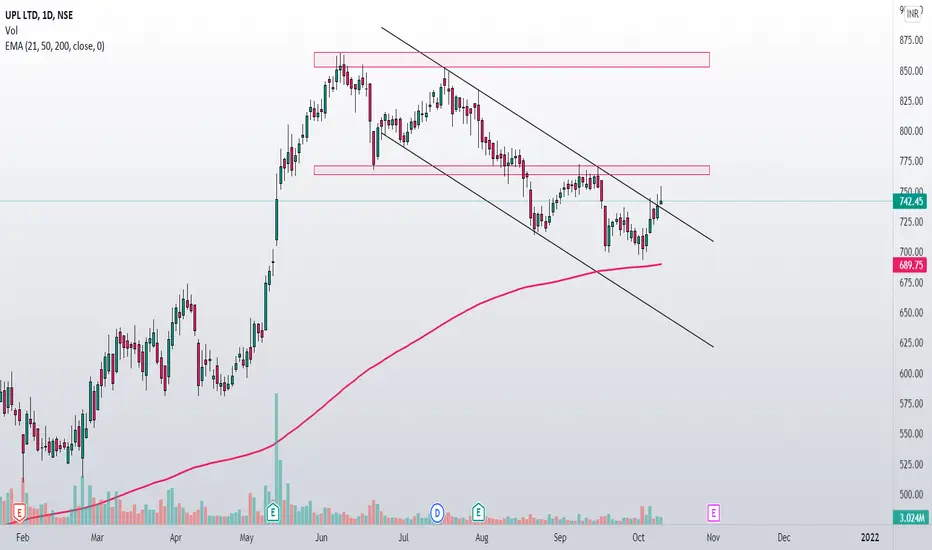
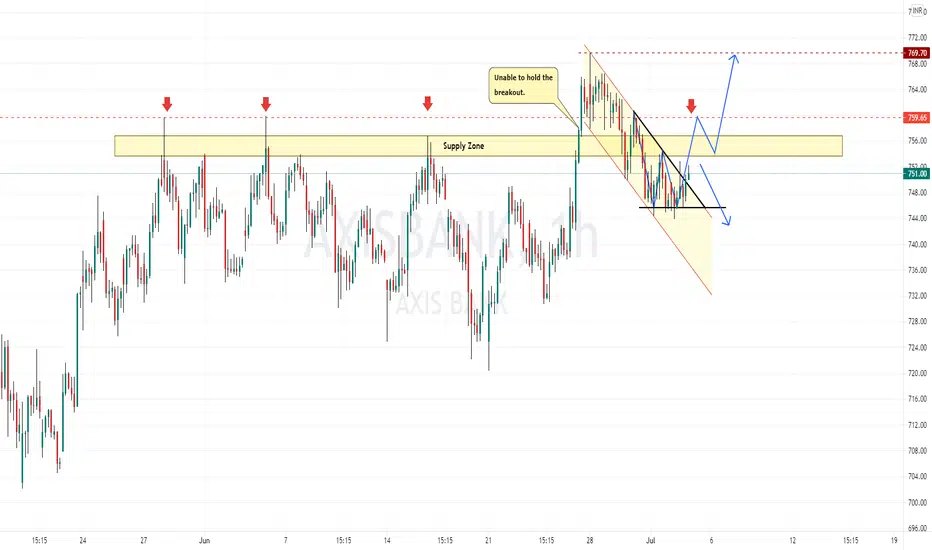
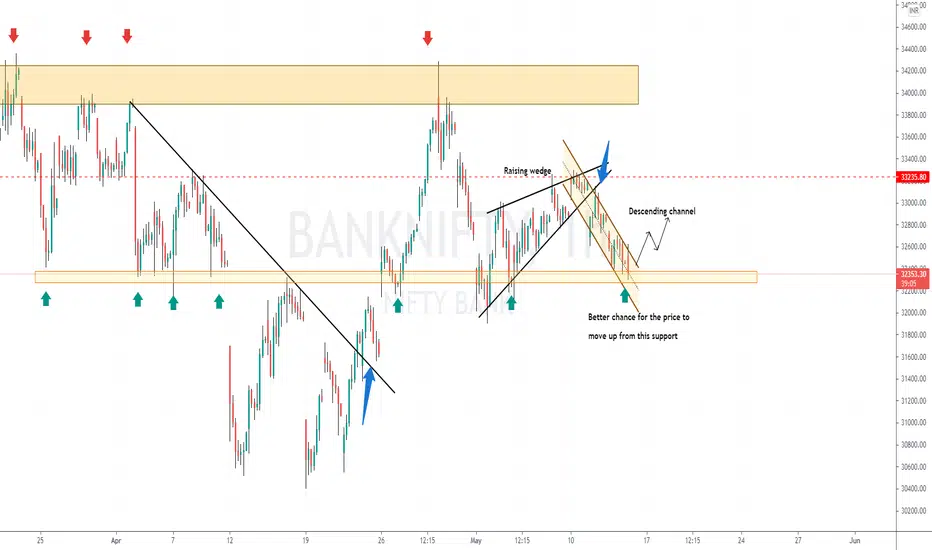
ONGC Can fly after taking support in descending channel patternONGC is continuously making a descending channel pattern from 173. After breaking the 20 and 50 days EMA now it is about to touch 100 days EMA and this could work as a strong support for ONGC as there are both supports available at 138 . 1st is Descending channel pattern's trend line and 100 Days EMA also running around 138. You can take entry in it according to provided details on charts.
you can hold this scrip for medium term target of 172 if it cross the level of 153 with good volume and ret
Descending Channel
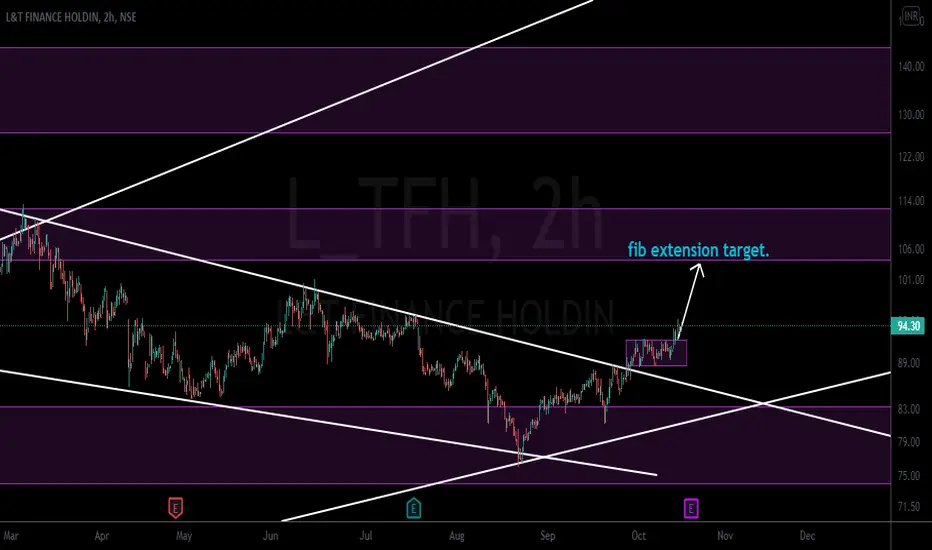
L&T FINANCEStock was in descending channel pattern for a long time and has broken it with a bullish momentum and was accumulating for few days the stock can touch to the support zone which is also a fib extension target, enter at current levels and place a stop at below the accumulation zone..
" EDUCATIONAL PURPOSE ONLY"..
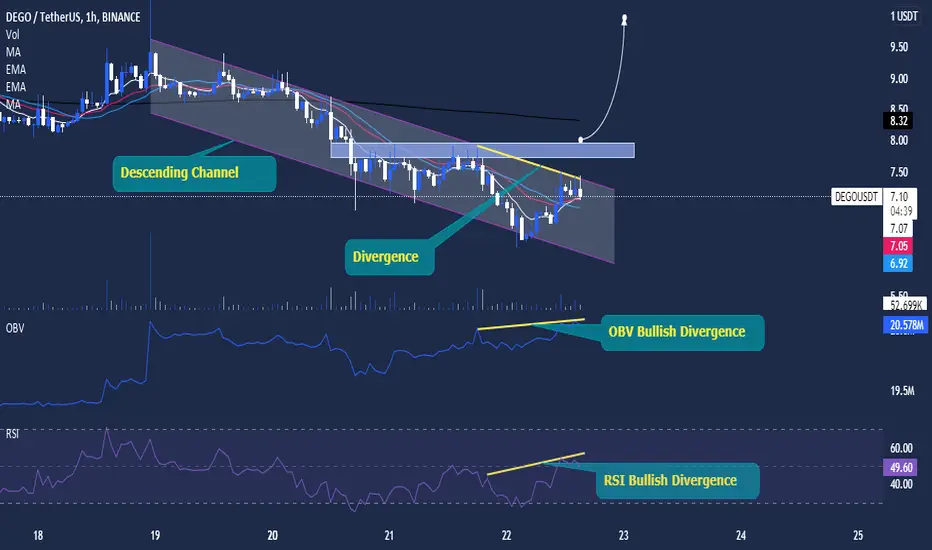
#DEGO Entering on the confirmed breakout#DEGO Entering on the confirmed breakout from the Descending Channel. on 1 hr TF.
Descending channel breakouts are usually breakouts on upside.
We have marked up OBV bullish divergence which shows prices may go up.
We have marked up RSI bullish divergence which also shows prices may go up.
This is for educational purpose. Consult your financial advisor before invest in the crypto.
Cryptocurrency investment is subject to market risk. Manage your risk accordingly.
#Dego is good on-chain Finance
DLong
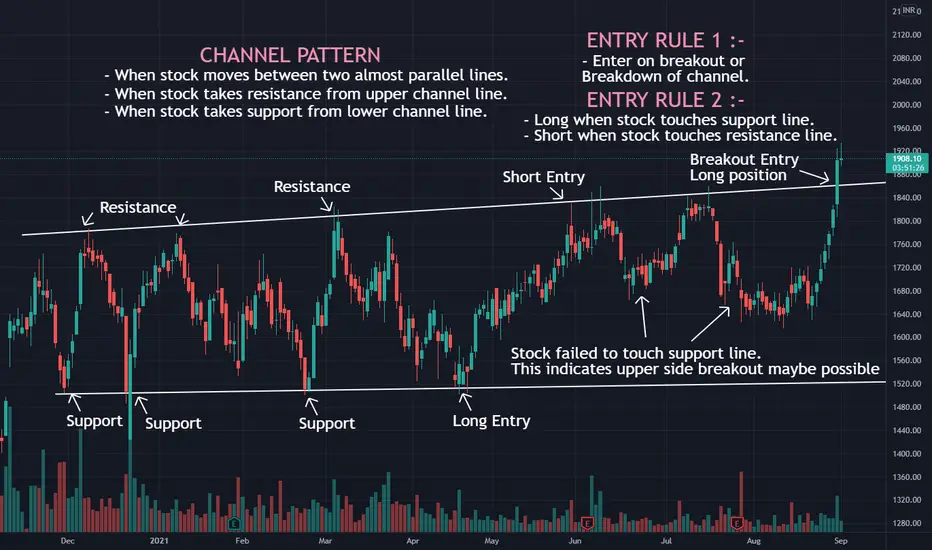
WHAT IS A CHANNEL PATTERN ?CHANNEL PATTERN :- It is nothing but a formation of two almost parallel lines between which the stock oscillates.
Channel can be of 3 types : 1) Horizontal Channel 2) Rising Channel 3) Falling Channel
It is a constant fight between bears and the bulls and victory is decided by the breakout or breakdown of the channel pattern.
Bulls wins the fight if breakout occurs , bears wins the fight if breakdown occurs.
When fight is over, the stop loss of other team is hit hence we can see a very strong m
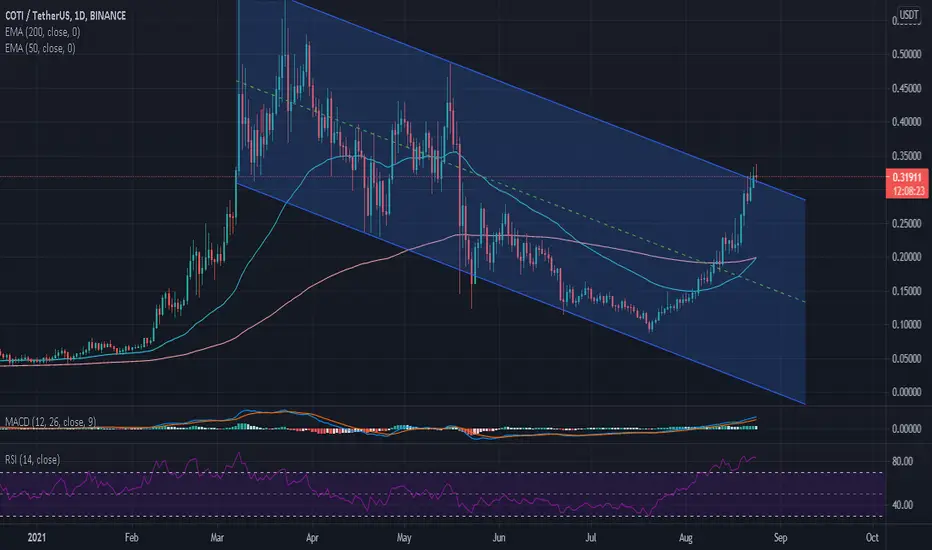
COTI_USDT(Descending Channel Breakout)COTI has appreciated by more than 250% from its July low levels of $0.089. It gave a breakout after a week of consolidation between the range of $0.20-$0.24 and is currently sustaining above $0.30 from the last 3-4 days. This bullish rally can be attributed to the fact that COTI has been working on multiple products on the Cardano ecosystem and as the date of Alonso Hard fork is coming closer, both ADA and COTI should be benefitted from this.
On the Daily TF, COTI has been trading in a Descend
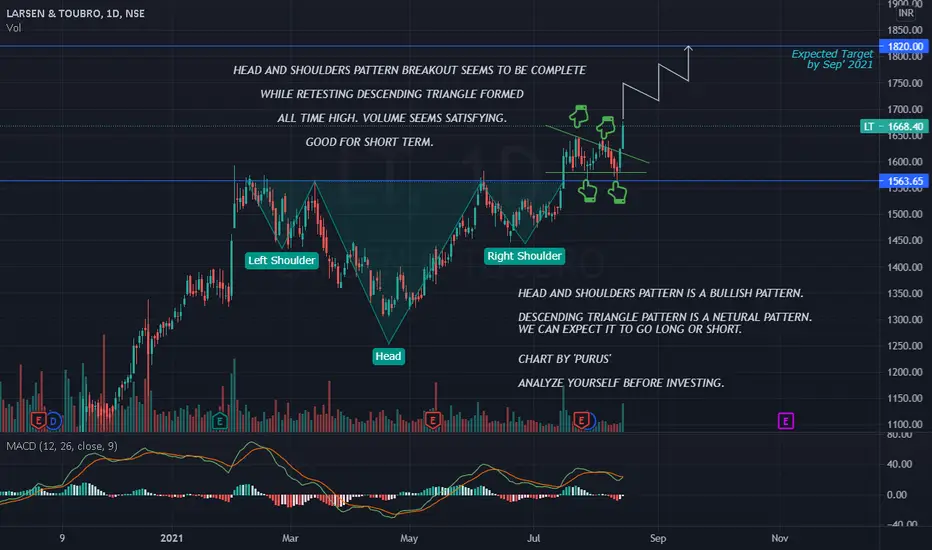
L & T - DESCENDING TRIANGLE PATTERNL & T Stock is just completed Head and Shoulders Pattern which is a bullish pattern, retesting also completed and formed Descending triangle pattern with breakout. So, we can expect the stock may go long.
Good buy for short term.
Please check the chart for details. Mentioned clearly about the support and resistance points (if applicable).
I am learning as well. so please analyse the chart by yourselves before taking any decisions.
Criticism always welcome
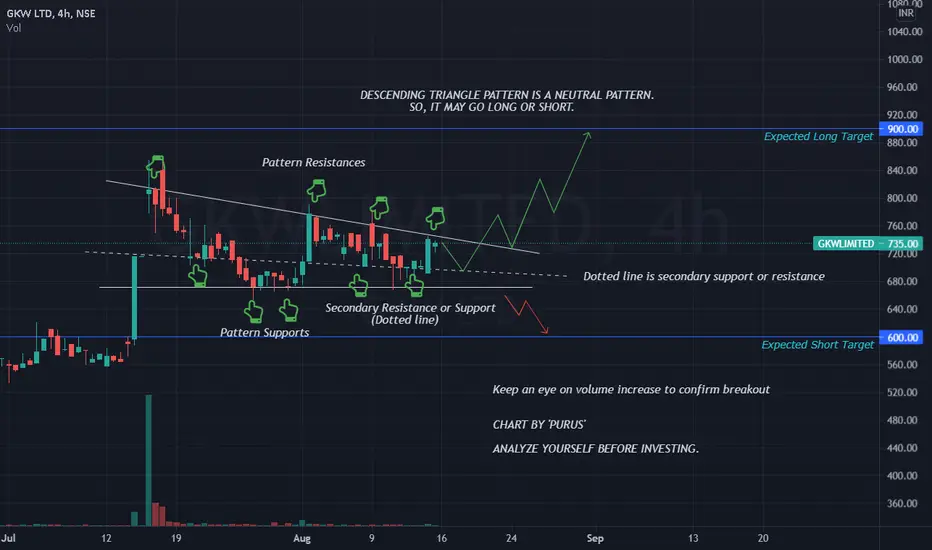
GKW LIMITED - DESCENDING TRIANGLE PATTERN GKW Limited stock formed Descending Triangle Pattern which is a neutral pattern. So, we can expect the stock may go long or short.
Please check the chart for details. Mentioned clearly about the support and resistance points (if applicable).
I am learning as well. so please analyse the chart by yourselves before taking any decisions.
Criticism always welcome
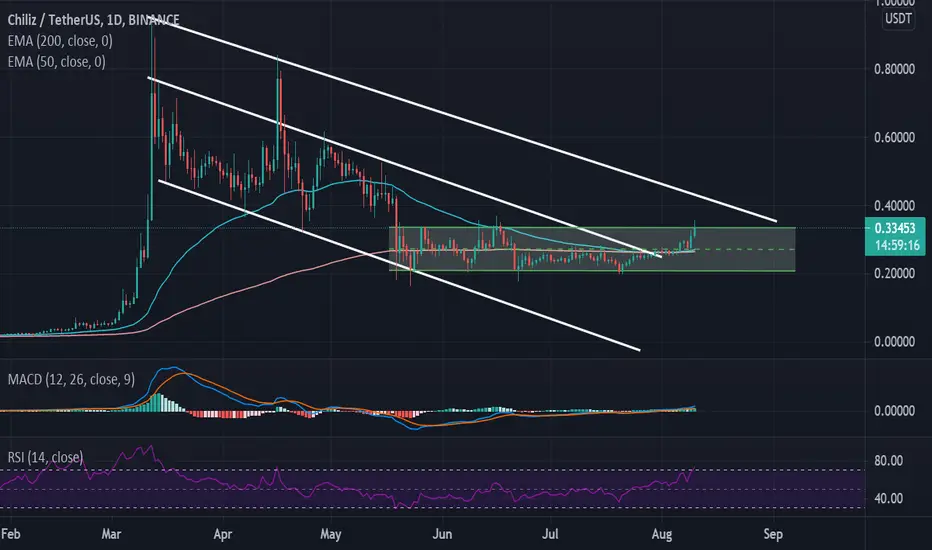
CHZ-USDTCHZ has been trading in a horizontal channel formation for the last 2 months. The sideways trend is still intact but at the time of writing, it is trying to breach its upper band resistance. On the weekly TF, CHZ has already gained more than 20% this week. Weekly MACD is also given bullish crossover which depicts that trend reversal can be expected in the coming days. At the time of writing, CHZ is trading at $0.33.
On the higher side, the immediate hurdle is presented by the upper band of the
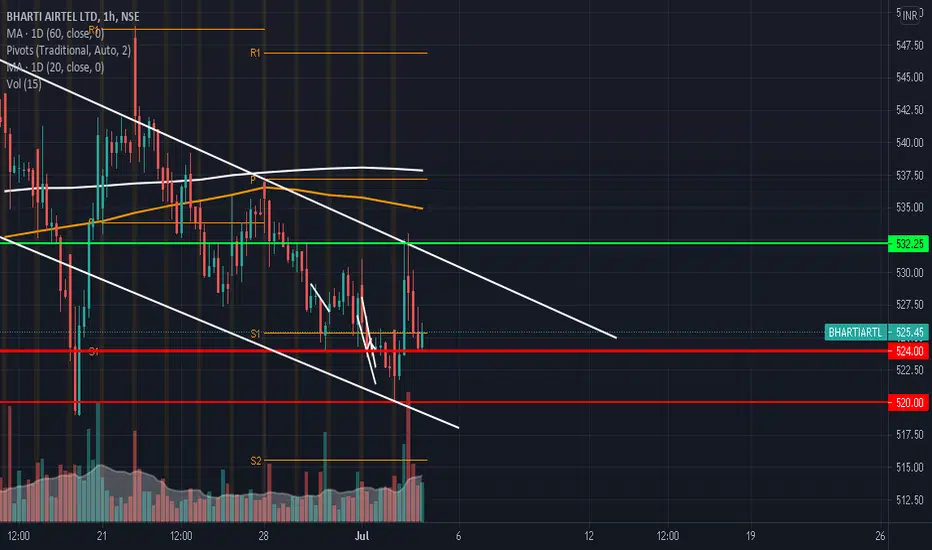
Descending channel in AirtelNotes:
Airtel has been playing around the support zones for quite some days now. Expect a decent breakdown if it closes below 520. Aggressive traders might also make use of the break below 524 since its a really strong level for the scrip.
Can only confirm an upward break if it crosses the previous swing high,
Please note - Not a SEBI Registered Advisor/Analyst. Only for Educational Purposes. Please Consult your financial advisor before you take any action.
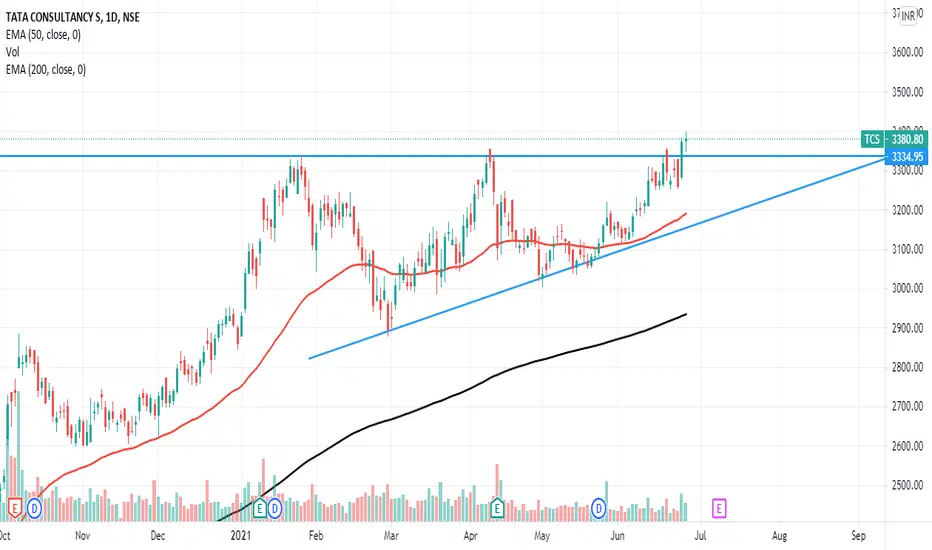
TCS for LONG :)look tcs breaks the resistance with a big bullish candle with good volumes yesterday and also today it forms a spinning top (indecision candle) ,so if tomorrow forms a bullish candle then go for long for swing traders. or wait for pullback then invest.
daily i'll post new ideas so
FOLLOW ME :) for more
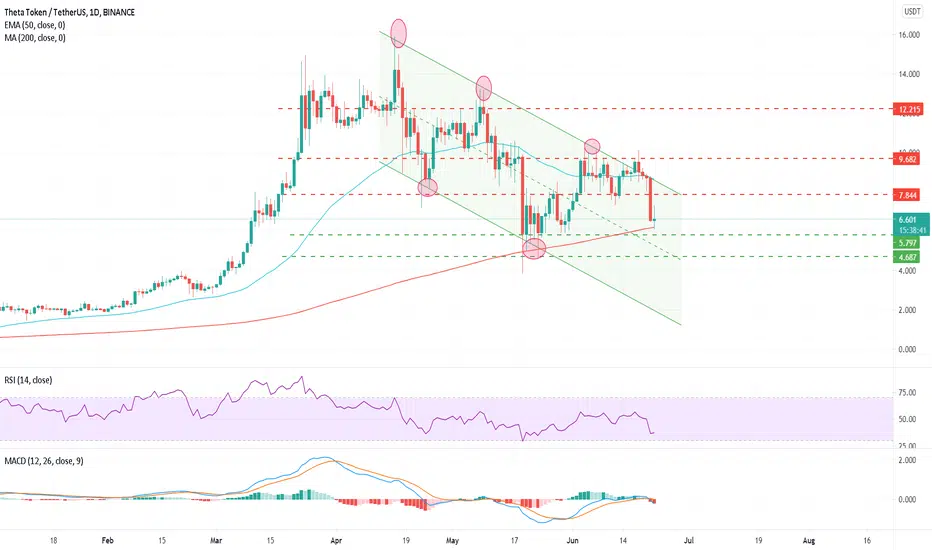
THETA-USDT(Descending Channel Formation)Theta aims to decentralize video streaming, data delivery and edge computing ecosystem and is on a mission to make contemporary video streaming more efficient, cost-effective by means of an inclusive monetization model whereby viewers receive better quality streaming service, content creators enhance their earnings and video platforms save money on building infrastructure and get a chance to increase advertising and subscription revenues.
Being a blockchain, Theta allows Dapp developers to buil
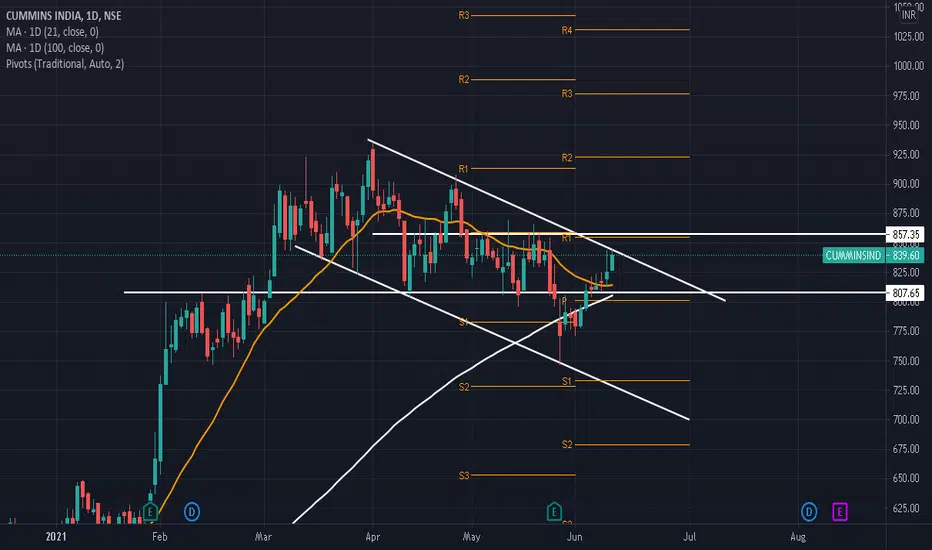
Descending Parallel ChannelNSE:CUMMINSIND
Notes :
Descending Parallel channel started around 17th March
To be on the safe side, I would confirm breakout only if the most recent swing high is crossed (at 858). However, for intraday, the immediate target after breaking the channel can be kept at the same level.
Please note - Not a SEBI Registered Advisor/Analyst. Only for Educational Purposes. Please Consult your financial advisor before you take any action.
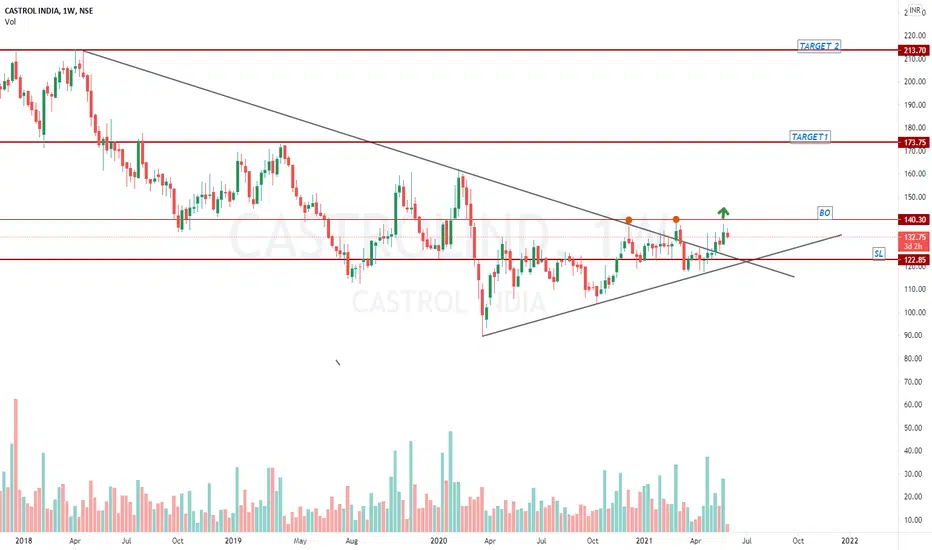
SWING TRADE : CASTROLIND1. Buy above BO 140
2. TARGET 170/210
3. SL 120
Analysis:
1. Breakout happened on descending channel
2. Now It is in accumulation phase.
3. 2 times rejected at 140 level.
4. We may see the uptrend if it breaks the accumulation zone.
Disclaimer: This is educational purpose only.
Please share your thoughts in the comments section below.
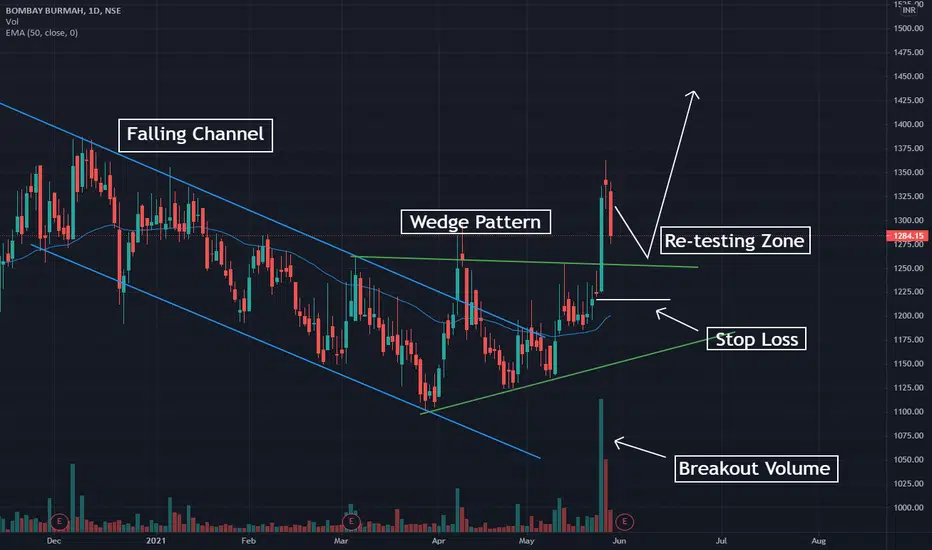
Falling Channel + Wedge Pattern COMBO !Traders, as you can see clearly that BBTC was first in falling or descending channel pattern and then it gave breakout and formed wedge pattern. Stock also gave breakout from wedge pattern (that too with high volumes ). Now stock is again retesting the trend line (resistance line). Buy once stock start showing positive momentum. Don't buy if stock closes below the resistance line. This was my personal analysis only for educational purpose. Feel free to share feedback/queries.
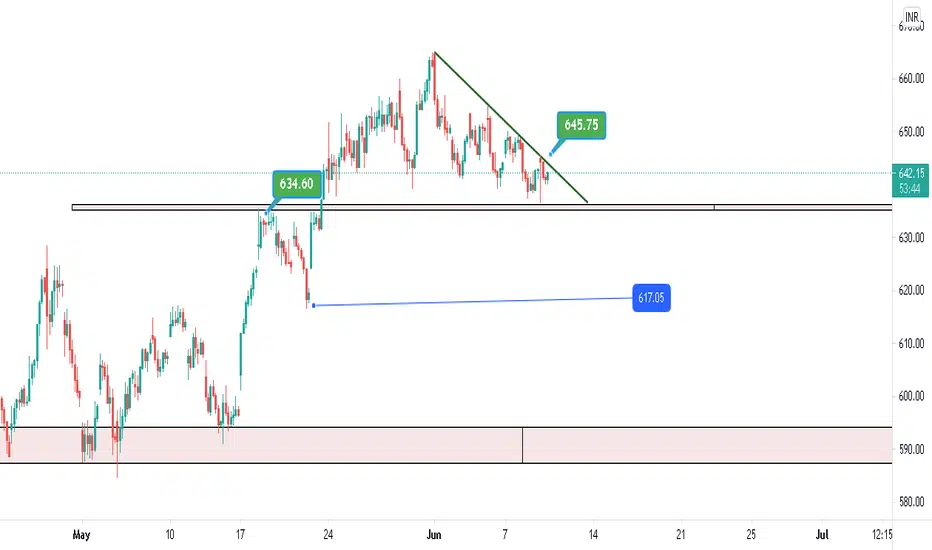
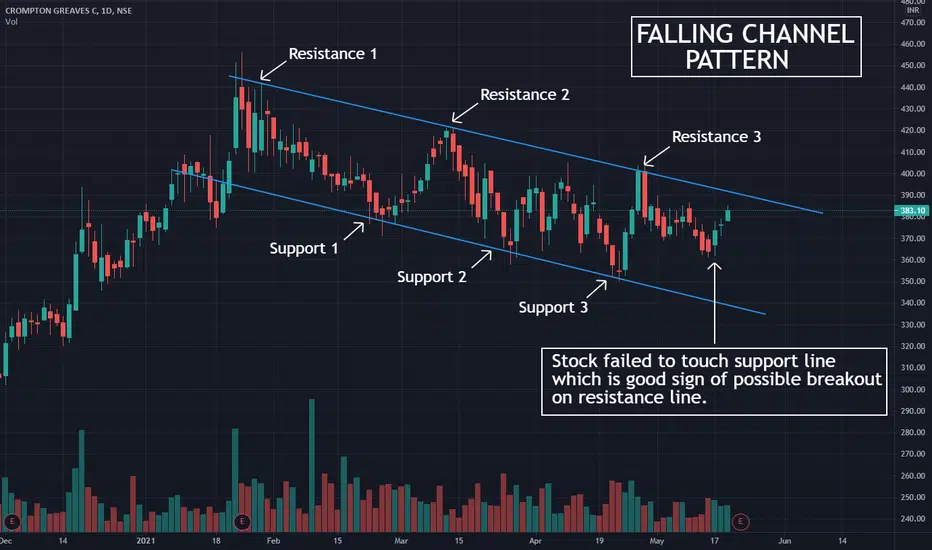
Possible Breakout And Rally Ahead !Traders CROMPTON is forming falling or descending channel pattern and the stock has failed to touch the support line of the channel. This is good sign of upward breakout. Enter only if breakout takes place with good volumes.
This is my personal analysis and its just for educational purpose , feel free to share your feedback/views.