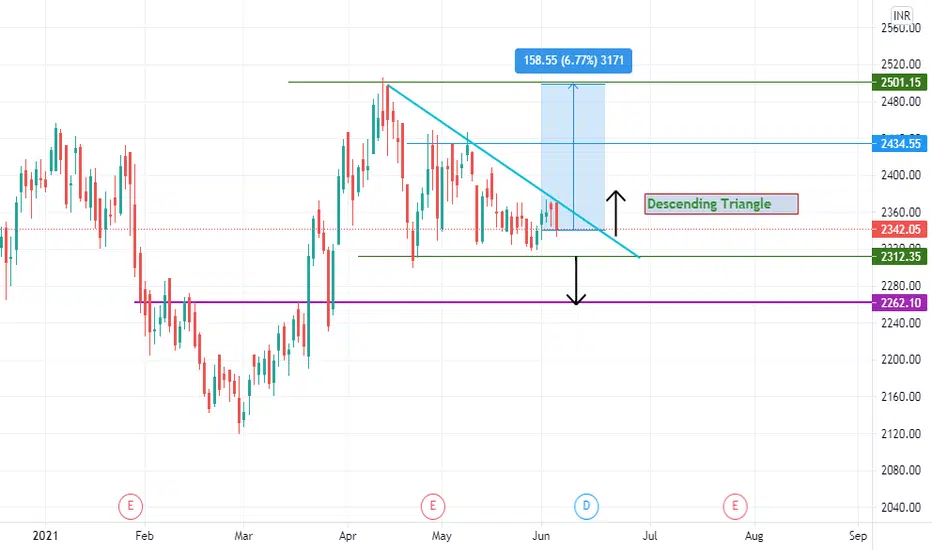
FOCUS ITC Ltd triangular pattern :)PROS: 1. stock forms a good good triangular pattern and now it is in near support
2. if it breakout then it will move further up and vice versa.
2.on 18th friday the last candle was a little hammer.
4. BUY SELL TARGET is at your own trading style.
CONS: 1.Stock breaks 50 EMA and also 200 EMA.
2.the last candle was hammer but its not a perfect one its a red bearish hammer.
3. if stock breaks support it will go down more maybe.
for more updates F
Descending Triangle
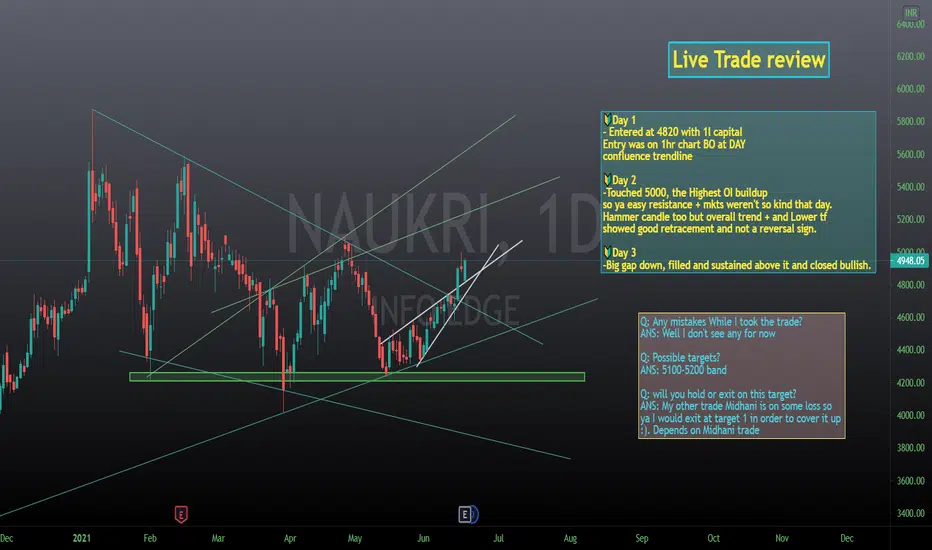
🔰 InfoEdge Analysis with Live trade and its review 💲Thanks for 500 Followers guys💲
💲💲 FOLLOW me @Averoy_Apoorv_Analysis and get these free analysis and Real-time trades that I take too :) 💲💲
🔰MY entry: 4820 ( 1 L invested with a risk of 5% ), I believe in my system and follow the process thus risk-reward is based on the edge of my system. So that's invariant still just for the psychological purpose.
🔰I too am a learner and would love to learn with you all :)
🔰Well, this is a transparency series created by me, here I will take the trades and
Ashok Leyland in somewhat Descending Triangle Chart PatternIt tried breaking out from the descending triangle but it seems like it failed or came back to retest, we need to observe closely, where it wants to go in the future.
KEY TAKEAWAYS
A descending triangle is a signal for traders to take a short position to accelerate a breakdown.
A descending triangle is detectable by drawing trend lines for the highs and lows on a chart.
A descending triangle is the counterpart of an ascending triangle, which is another trend line-based chart pattern used by tech
MY next possible trade - NAUKRI - SwingWaiting for BO @ day close only :)
I JUST LOVE WATCHING CHARTS DANCE THAT'S ALL :)
💲💲 FOLLOW me @Averoy_Apoorv_Analysis and get these free analysis :) 💲💲
🔰 {Some info}
➼My name is Apoorv and I am a 2nd year Engineering student, I want to pursue trading as my career, and thus whatsoever setups or trades I potentially see on my charting platform, I post it here and share them with you all.
➼I hope you will love my simple analysis style.
➼Feel free to suggest your view on this as learning is ear
#1 MIDHANI - Invested 1L in it lets see | Part-1💲💲 FOLLOW me @Averoy_Apoorv_Analysis and get these free analysis and Real-time trades that I take too :) 💲💲
🔰I too am a learner and would love to learn with you all :)
🔰Well, this is a transparency series created by me, here I will take the trades and then post them, will also tell how much I invested in it and what are my targets, when I exited, what were my returns, or did the SL got hit. These trades are under the guidance of my mentor and as per my risk-reward ratio, This is no call just
Price Action Pattern - ASHOKLEY💲💲 FOLLOW me @Averoy_Apoorv_Analysis and get these free analysis and potential movers on your watchlist :) 💲💲
🔰 {Some info}
➼My name is Apoorv and I am a 2nd year Engineering student, I want to pursue trading as my career, and thus whatsoever setups or trades I potentially see on my charting platform, I post it here and share them with you all.
➼I hope you will love my simple analysis style.
➼Feel free to suggest your view on this as learning is earning here :)
➼I take my trades on my Zerodha a
Where does the FMCG sector stands technically?I just posted a chart on HUL making a descending triangle pattern and will try to link that idea to the sector chart.
.
As we can see the CNXFMCG tried to breakout of the previous resistance and failed to do so. With tata consumer rallying recently , HUL could follow the suit and FMCG sector could push out to make new highs in coming days. IF it fails to sustain like the earlier 2 opportunities it would take another week or so to retry to breakout.
Descending Triangle Pattern Breakout in CADILAHCCADILAHC has formed Insider Bar & NR7 pattern on daily TF. On 15 min TF it has formed Descending Triangle pattern. Possibly it will break down and can create shorting opportunity.
CShort
HDFC Bank, Swing/positional (Read description for the details)HDFC Bank has given a beautiful breakout from the descending triangle, then retested and again risen. Today it has resisted 1511 level. If price falls we have support of 50 EMA just below. A support from the 50 EMA can be traded for the first target of 1511. If HDFC Bank rises from current level and closes above 1511 to give a breakout from 1511, it can be traded for targets of 1562, 1600 and 1640.
Make sure to trade what happens and not what you expect :)
Note: Please do not follow my idea b