Doji
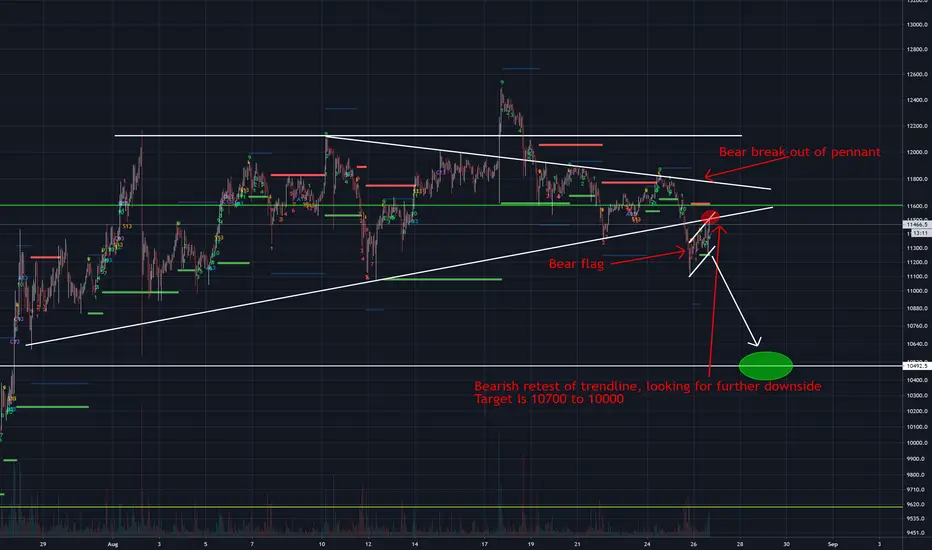
Today the bank nifty can be positive because of strong support.The Bank nifty yesterday got strong support on 22290. The doji formation shows that there cand be a trend reversal.The doji is also formed and stock has also got a support. Upside targets are 22850 for today. But if the stock doesn't change its trend then it will continue its downtrend and and downside targets will be 22000
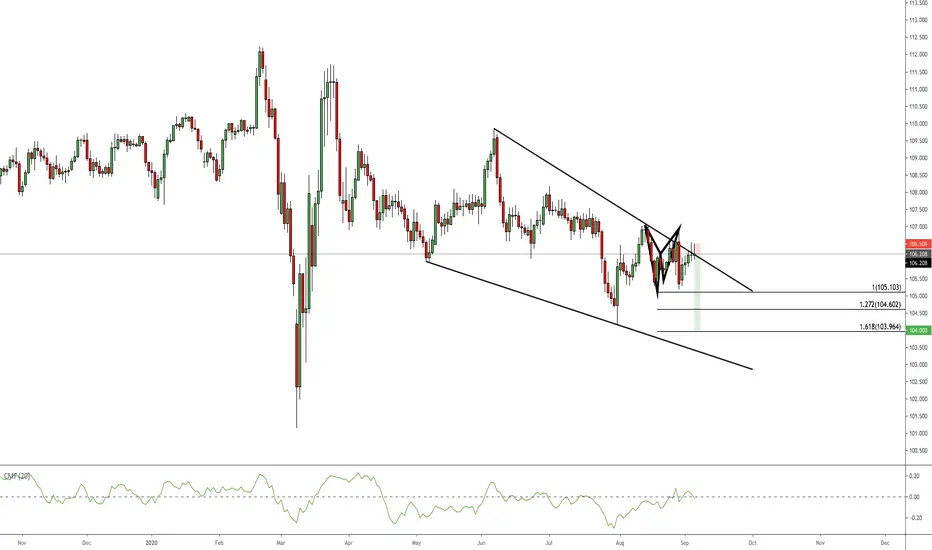
EURJPY- QUICK LONG OPPORTUNITY COMING UPWAIT FOR A CONFIRMATION BEFORE ENTRY, PRICE STILL IMPULSIVE.
As we can see price is forming a series of higher highs and higher lows, we are also respecting this ascending TL which is currently being tested as support along with the 78.6 fib level. If these two confluences holdout I am waiting for a confirmation to go long (e.g a candlestick that closes above the 50EMA, or a doji, etc). Would only be looking to target previous highs as price has not been above this level since FEB 2019 therefor
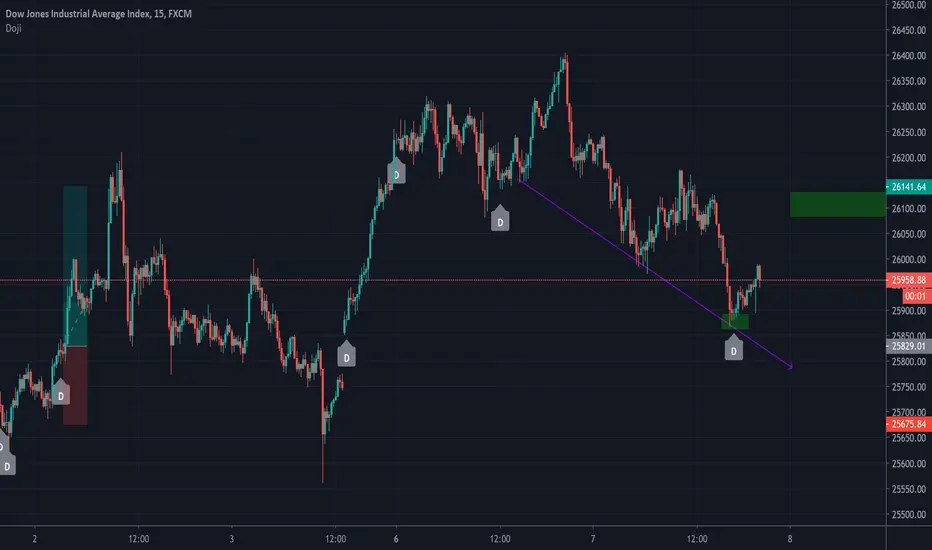
BITCOIN BEARISH - 10,500 coming??Hey there,
Please support this idea with your likes and follow me here on TV if you don't want to miss out!
Bitcoin recently broke bearish after creating a fake out scenario, wicking to 12,400.
We now got a retest of a major support trendline in bear flag formation.
Too many still want to buy this dip, which concerns me quite a bit.
For now the target is between 10,700 and 10000, but if 10,000 is really reached,
then I think this will only be very breafly and will create a huge bullish wick
📖 Japanese candlestick charts. Part 1We are beginning a new theme “Trading strategy’s most important technical analysis tools”.
Today we are going to tell you about the most important things in trading, candlesticks!
📌Japanese candlestick charts were developed in the 17th-18th centuries by the Japanese rice traders. They were introduced to trading by Steve Nison in the 20th century. It's a simple, but very important tool for technical analysis, as these candlesticks contain different information about the market. I guess that ev
📖 Japanese candlestick charts. Part 2Hello, we continue to study candlesticks.
⚡️ Maximal/minimal
🔶 For this it is desirable for reversal candlestick to have its own high/low. In addition to the convenience of placing stop-loss on them, its own minimum/maximum also increases the chances for a long term trend after such reversal. The reason for this is in the market reflectivity, all the patterns don’t just work on their own, but they also contain market’s psychology and the methodology of huge amounts of smart money. When there
Facebook may fall here to provide us a new entry.Company is very well run, I think it may rise higher, but I will be looking to long after it tags the 20dma and keeps bullish momentum, or if it tags the bottom of the wedge with a nice reversal in price action.
What we see here is a bearish doji in my opinion right after it tagged a lower high...
F
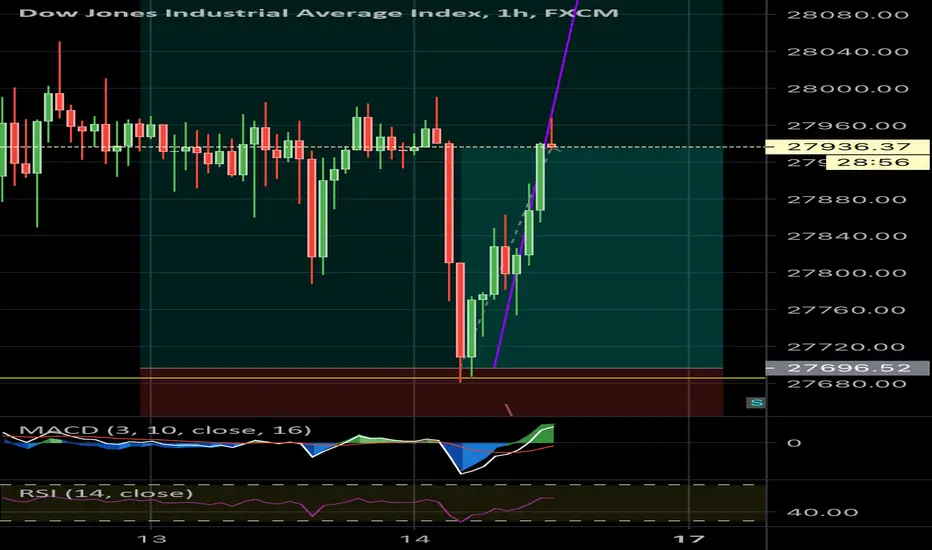
DE30 Index Trade Idea DE30 Trade Idea.
Currently price is bullish. Price has broken above the resistance level which now may slowly turn into a support level. Waiting for a possible retest of this level and a further confirmation before placing a buy trade.
However, price has also met the daily high level and we could see a possible trend reversal should price fail to continue its bullish run. Should such happen I will wait for a retest of the level as resistance as well as a confirmation and place a sell.
I also
D
Amara Raja Batteries from 4 July 2020April-May has shown considerable Upside movement
June - July month is showing consolidation period ...
prices has touched the red zone thrice ==> also showing breakout ( very high volume )
Daily chart is showing evening doji pattern ....
Future price movement can be expected in two ways ..
1. legitimate breakout ... new consolidation zone around 740
... at-max this month 20-25% growth can be their ... 1 July opening 650 --> max 780 - 812 very tough
2. cup and handle formation then after go
ALong