NSLNISP: Weekly Double Bottom Breakout1. The Macro Perspective: The Massive Accumulation Base
I am taking a LONG bias on NMDC Steel Limited (NSLNISP) on the macro weekly (1W) timeframe.
When analyzing pure market structure on an emerging steel manufacturer, massive accumulation bases are critical for initiating long-term secular trends. Following a significant markdown phase from its mid-2024 peak, the stock entered a massive structural bottoming process spanning well over a year. This sideways and rounding consolidation effectively absorbed profit-taking and allowed institutional capital to quietly accumulate shares. The structure took the form of a massive double bottom or "W" base. Fundamentally, this technical momentum aligns perfectly with the company's recent operational turnaround and Q4 FY26 earnings report. The company reported a significant narrowing of its net loss to ₹243.97 crore for the quarter, compared to a steep loss of ₹757.78 crore in the same quarter last year. This fundamental improvement signals successful operational stabilization as its flagship plant ramps up production.
2. The Educational Setup: Horizontal Boundary Defense
To understand the technical validity behind this macro launch, look closely at how the price structure interacted with its core boundaries prior to breaking out:
The 48.00 Resistance Ceiling: The definitive line in the sand for a bullish structural shift was the solid black horizontal resistance line drawn at 48.00. This level established a massive supply zone over previous quarters that systematically capped upward momentum.
The Structural Floors: During the multi-month consolidation, institutional buyers heavily defended the lower boundaries, twice carving out a textbook rounding bottom to form the larger double bottom pattern. This sequence squeezed volatility directly beneath the breakout zone, building immense kinetic energy.
3. Current Price Action: Breakout and Volatility Expansion
Look at the most recent weekly candle on the far right of the chart. The structural pressure cooker has officially exploded. Driven by the improving fundamentals, institutional buyers have stepped in with undeniable conviction. The stock printed a massive, full-bodied green expansion candle that has decisively obliterated the 48.00 multi-month ceiling, currently trading incredibly strong near 50.50. The stock has officially transitioned out of low-volatility accumulation and into a highly explosive markup trend into fresh territory.
4. The Trade Plan: Entries, Targets, and Risk Management
Entry Strategy: Macro momentum is exceptionally strong with the stock trading vertically out in the open. Chasing an extended weekly breakout candle carries a minor risk of a short-term, lower-timeframe mean-reversion pullback. The highest-probability, lowest-risk entry strategy involves stepping down to the daily timeframe and waiting for the initial vertical excitement to cool off. Look to scale into long positions on a potential structural pullback to perfectly retest the broken 46.00 to 48.00 prior resistance zone. Letting old historical resistance prove itself as a concrete new support floor provides an unmatched risk-to-reward ratio.
Take Profit (Targets): By utilizing a classical measured move strategy based on the depth of the accumulation phase, we can project upside targets. Taking the depth of the macro range (roughly 16 points from the structural floor near 32.00 up to the 48.00 ceiling) and projecting it upward from the breakout point, our primary structural macro target sits comfortably in the 64.00 to 68.00 zone over the coming quarters. This aligns perfectly with the major structural peak established prior to the markdown phase.
Invalidation (Stop Loss): An explosive macro breakout thesis is completely invalidated if the price fails to hold its newly claimed structural floor and collapses back inside the core of the base boundaries. A hard stop loss should be placed safely below the recent lower-timeframe swing lows and the mid-level of the breakout, specifically around the 40.00 to 42.00 level. A definitive weekly close completely back below 40.00 would act as a severe warning sign of a failed macro breakout and a major bull trap.
5. Time Horizon:
Because this technical setup captures a clear structural phase transition and a major horizontal breakout on the 1-Week chart, this is a longer-term position trade designed to capture a rapid momentum markup phase over the coming months. Let the macro trend run!  Long
Long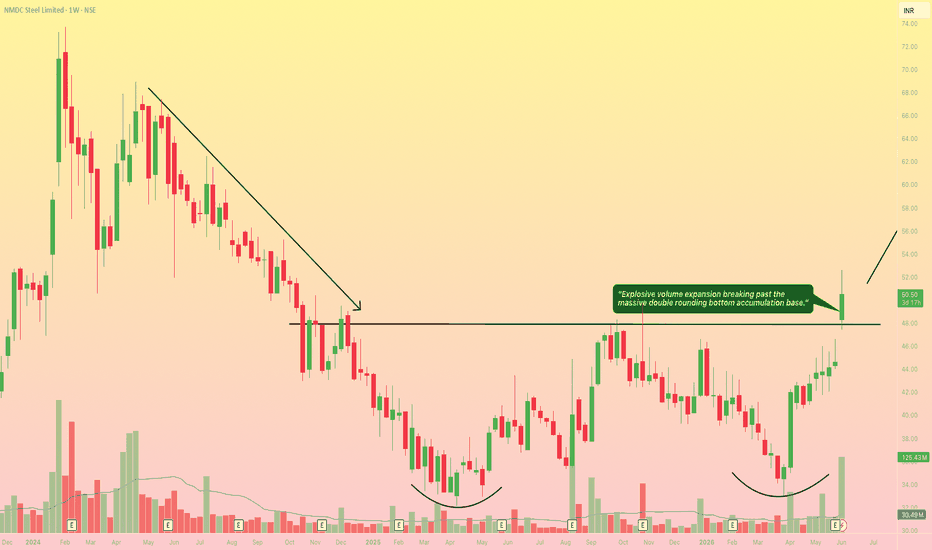
BALAMINES: Weekly Double Bottom Breakout1. The Macro Perspective: The Double Bottom Formation
I am taking a LONG bias on Balaji Amines Limited (BALAMINES) on the macro weekly (1W) timeframe.
When analyzing pure market structure on a specialty chemicals stock, extended markdown phases must eventually find a floor. Following a severe downtrend, the stock entered a prolonged bottoming process, carving out a massive, textbook Double Bottom (or 'W') structure visible on the chart. This multi-month digestion phase formed two distinct rounded lows, effectively flushing out weak hands and allowing institutional capital to systematically accumulate shares at deep discount valuations. Documenting these classical reversal bases makes the charting workflow highly repeatable and easy to understand for the new trainees joining our desk at Mahapatro AI & ML.
2. The Educational Setup: The Neckline Resistance
To understand the technical validity behind this macro launch, look closely at how the price structure interacted with its core boundaries:
The 1,867.90 Resistance Neckline: The definitive line in the sand for a bullish structural reversal was the solid black horizontal resistance line drawn at 1,867.90. This level acted as the critical neckline of the double bottom, representing a heavy supply zone that previously rejected upward momentum.
The Rounded Floors: During the consolidation, buyers defended the absolute lows, creating two distinct rounded accumulation zones. This price action squeezed volatility directly beneath the breakout zone and built immense kinetic energy for a trend reversal.
3. Current Price Action: Breakout and Volatility Expansion
Look at the massive weekly candle on the far right of the chart provided in Screenshot 2026-06-02 at 21.14.26 (2).jpg. The structural pressure cooker has officially exploded. Institutional buyers have stepped in with undeniable conviction. The stock printed a towering, full-bodied green expansion candle that has vertically surged to close at 2,016.10 (+13.54% on the session). This explosive thrust has decisively obliterated the 1,867.90 macro neckline. The stock has officially transitioned out of its accumulation base and into a highly explosive markup trend. Note: Always ensure your exchange's End of Day (EOD) data files have fully synchronized before confirming the final weekly close shape, as evening data synchronization delays can occasionally alter the visual confirmation of these critical breakout wicks.
4. The Trade Plan: Entries, Targets, and Risk Management
Entry Strategy: Macro momentum is exceptionally strong with the stock trading vertically out in the open above the pivotal breakout line. Chasing an extended weekly breakout candle carries a minor risk of a short-term, lower-timeframe mean-reversion pullback. The highest-probability, lowest-risk entry strategy involves stepping down to the daily timeframe and waiting for the initial vertical excitement to cool off. Look to scale into long positions on a potential structural pullback to perfectly retest the broken 1,850.00 to 1,900.00 prior resistance zone. Letting old historical resistance prove itself as a concrete new support floor provides an unmatched risk-to-reward ratio.
Take Profit (Targets): By utilizing a classical measured move strategy based on the structural depth of the double bottom pattern, we can project upside targets. Taking the approximate depth of the base (roughly 800 points from the absolute structural floor near 1,060.00 up to the 1,867.90 neckline) and projecting it upward from the breakout point, our primary structural macro target sits comfortably in the 2,650.00 to 2,700.00 zone over the coming quarters.
Invalidation (Stop Loss): An explosive macro breakout thesis is severely compromised if the price fails to hold its newly claimed structural floor and collapses back inside the core of the 'W' boundary. A hard stop loss should be placed safely below the recent lower-timeframe swing lows, specifically around the 1,600.00 to 1,650.00 level. A definitive weekly close completely back below 1,600.00 would act as a severe warning sign of a failed macro reversal and a major bull trap.
5. Time Horizon:
Because this technical setup captures a clear structural phase transition and a textbook double bottom breakout on the 1-Week chart, this is a longer-term position trade designed to capture a rapid momentum markup phase over the coming months. Let the trend run!  Long
Long
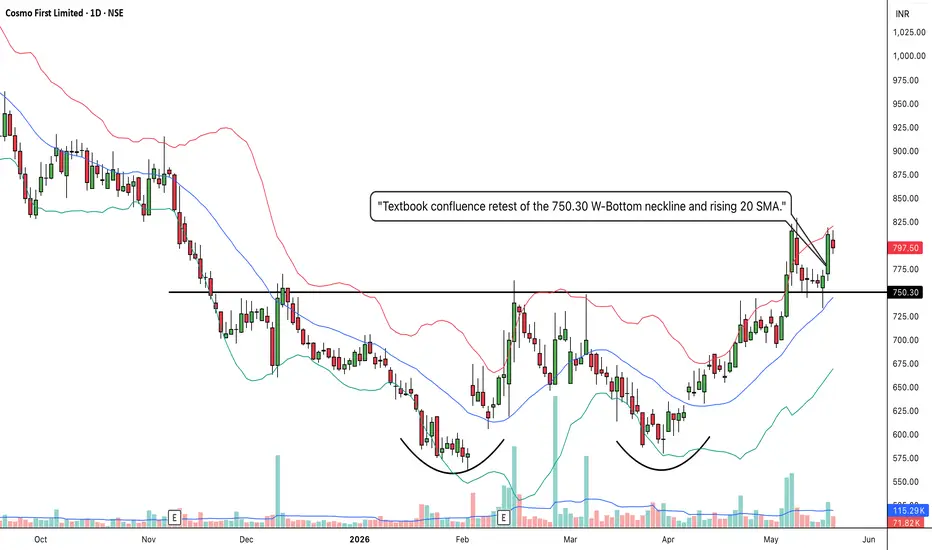
COSMOFIRST: Massive W-Bottom Base and Textbook Confluence Retest1. The Macro Perspective: The Washout and the W-Bottom
I am taking a LONG bias on Cosmo First Limited (COSMOFIRST) on the daily (1D) timeframe.
When analyzing pure market structure, the most reliable reversals are born from deep, agonizing accumulation phases. Look at the structural development on the lower half of this chart. After suffering a brutal markdown phase that dragged the price into the 500s and completely washed out weak hands, heavy institutional capital stepped in. I have explicitly drawn the two massive accumulation bowls at the bottom of the chart. This forms a textbook "W-Bottom" or Double Bottom structure. Instead of bleeding lower, strong-handed buyers aggressively defended these lows, systematically absorbing overhead supply to build a concrete macro foundation.
2. The Educational Setup: Conquering the Neckline
To understand the sheer strength of this current setup, look at how the price transitioned from accumulation back into a markup phase:
The Resistance Lid: For months, the ultimate ceiling of this base was defined by the solid black resistance line at 750.30. This was the "Neckline" of the W-Bottom.
The Breakout: Recently, buyers aggressively shattered this 750.30 ceiling with a massive momentum thrust, pushing the price all the way up to test the dashed 824.65 macro resistance. This definitive breakout officially signaled the end of the markdown phase and the birth of a new trend.
3. Current Price Action: The Ultimate Confirmation
In technical analysis, breaking a major resistance line is only half the battle. The most lucrative entries occur when a stock proves it can defend its newly claimed territory. Look at the most recent candles on the far right. After hitting 824.65, the stock took a healthy, necessary breather. It pulled back to perfectly test the 750.30 line from above. Furthermore, notice how the rising 20 SMA (the middle blue line of your Bollinger Bands) perfectly intersected with that horizontal line. This is a "Confluence Retest." By printing a strong green candle right off this intersection, that old, heavy resistance ceiling has officially been flipped into an indestructible structural launchpad.
4. The Trade Plan: Entries, Targets, and Risk Management
Entry Strategy: We are currently sitting right in the "golden entry" zone near 797.50. The highest-probability, lowest-risk entry involves stepping in right here as the stock launches off the structural retest of the 750.00 to 760.00 confluence zone. Letting that newly broken macro neckline and the rising 20 SMA prove themselves as a concrete floor offers a phenomenal risk-to-reward ratio before the next momentum expansion.
Take Profit (Targets): The immediate structural hurdle is the recent swing high at the dashed 824.65 line. Once that stepping stone is cleared, we use measured targets based on the depth of the macro base. By taking the depth of the W-Bottom (roughly 200 points from the ~550 floor up to the 750.30 neckline) and projecting it upward, our primary structural macro target sits beautifully in the 940.00 to 950.00 zone.
Invalidation (Stop Loss): A break-and-retest thesis is only valid if the new floor holds. A hard stop loss should be placed safely below the 750.30 neckline and the 20 SMA, around the 715.00 to 725.00 level. A definitive daily close completely back inside the old accumulation bowl would invalidate the immediate reversal thesis and signal a severe bull trap.
5. Time Horizon:
Because this technical setup is built on a 1-Day chart capturing a massive structural W-Bottom completion and a textbook confluence retest, this is a medium-term swing trade designed to capture the explosive new markup phase. Let the new trend run!  Long
Long
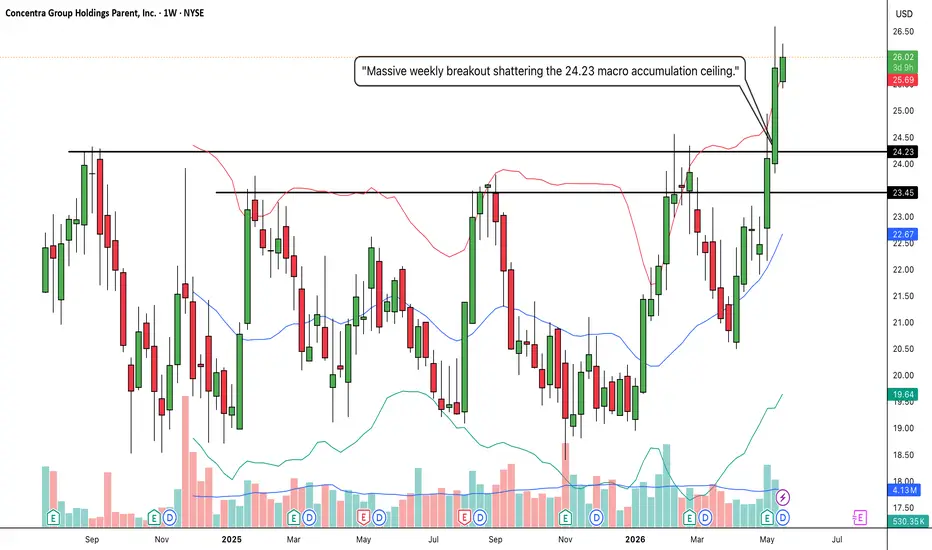
CON: Massive W-Bottom Macro Base and Explosive Breakout1. The Macro Perspective: The Multi-Month Washout
I am taking a LONG bias on Concentra Group Holdings Parent, Inc. (CON) on the weekly (1W) timeframe.
When analyzing pure market structure, the most lucrative macro trends are born from deep, exhausting accumulation phases. Look at the massive structural development spanning this chart. After establishing a historical resistance zone between the solid black 23.45 and 24.23 lines, the stock suffered a prolonged markdown phase. It washed out all the way down into the 19.50 zone, completely decimating weak hands and forcing retail capitulation. However, heavy institutional capital stepped in at those lows to establish an absolute concrete floor, initiating the left side of a massive "W" or Double Bottom accumulation structure.
2. The Educational Setup: The Higher-Low Springboard
To understand the sheer strength of this current breakout, look at how the right side of the "W" pattern was formed:
The Rejection and the Trap: The stock rallied back to the 24.23 ceiling and faced a brutal rejection. To an amateur trader, this looked like a massive double-top failure, triggering short sellers and panic selling.
The 20 SMA Defense: Notice what happened next. The stock pulled back, but it refused to make a new low. Instead, institutional buyers aggressively defended the rising 20 SMA (the middle blue line of your Bollinger Bands) right around the 20.00 to 21.00 level. By carving out a massive "Higher Low" directly on the moving average, they trapped the short sellers and created a powerful structural springboard for the next leg up.
3. Current Price Action: Blue Sky and Volatility Expansion
Look at the most recent weekly candles on the far right. The springboard has absolutely exploded. Buyers have effortlessly shattered the entire resistance block (23.11 dashed, 23.45 solid, and 24.23 solid) with consecutive, massive green momentum expansion candles. Furthermore, notice how the price has violently pierced the upper Bollinger Band, forcing the bands to rapidly expand upward alongside a noticeable surge in buying volume. By decisively clearing this massive multi-month accumulation zone, CON has officially entered "Blue Sky Territory" (pure price discovery).
4. The Trade Plan: Entries, Targets, and Risk Management
Entry Strategy: Momentum is exceptionally strong right now near 26.00. Chasing a massive vertical expansion candle riding outside the weekly Bollinger Bands always carries a higher risk of an agonizing intraday or daily mean-reversion pullback. The highest-probability, lowest-risk entry involves stepping down to a daily timeframe and placing limit orders to catch a potential structural pullback to perfectly retest the 24.00 to 24.50 breakout zone. Letting that heavy historical resistance prove itself as a new, indestructible support floor offers a phenomenal risk-to-reward ratio.
Take Profit (Targets): We use measured structural targets based on the depth of the massive macro base. By taking the depth of the W-Bottom (roughly 4.75 points from the ~19.50 floor up to the 24.23 ceiling) and projecting it upward from the breakout line, our primary structural swing target sits comfortably in the 28.75 to 29.00 zone. The psychological 30.00 mark will act as a secondary macro magnet.
Invalidation (Stop Loss): A macro breakout thesis is only valid if the new market structure holds. A hard stop loss should be placed safely below the breakout zone and the recent daily consolidation, around the 22.00 to 22.50 level. A definitive weekly close completely back inside the old accumulation base and breaking below the 20 SMA would act as a massive warning sign of a failed macro breakout and a severe bull trap.
5. Time Horizon:
Because this technical setup is built on a 1-Week chart capturing a massive structural W-Bottom completion and volatility expansion, this is a medium-to-longer-term position trade designed to capture the explosive new markup phase. Let the macro trend run!  Long
Long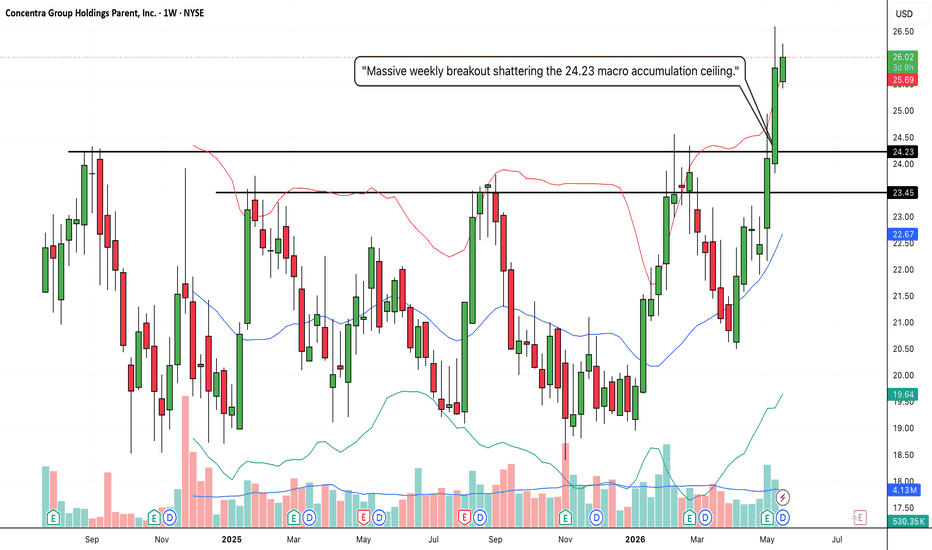
IRM: Explosive Macro Breakout and Double Bottom Completion1. The Macro Perspective: The Massive 'W' Reversal
I am taking a LONG bias on Iron Mountain Incorporated (IRM) on the weekly (1W) timeframe.
When analyzing pure market structure, horizontal lines dictate the flow of supply and demand. Looking at this chart, IRM established a massive historical ceiling near the 122.87 level before undergoing a brutal, multi-month correction. However, instead of bleeding out into a secular bear market, the stock carved out a massive "W" structure. It tested the deep lows twice, successfully washing out weak hands, before initiating a long, methodical grind back up to the neckline.
2. The Educational Setup: Pure Price Action and The Higher Low
The best breakouts are prefaced by a sign of structural strength right before the resistance line.
The Absorption: Notice how the stock behaved as it approached the 122.87 ceiling again. Instead of being immediately rejected all the way back down, it absorbed the selling pressure and formed a clear higher low (the pivot right before the current massive push).
The Launchpad: By forming this higher low, buyers proved they were willing to step in at premium prices, tightly coiling the price action and storing kinetic energy for the final, explosive thrust.
3. Current Price Action: Shattering the Ceiling
Look at the most recent weekly candle on the far right, currently trading near 127.19. It is a massive, full-bodied bullish engine. After months of structural development, the stored energy has been unleashed. Buyers have effortlessly shattered the 122.87 macro resistance, closing near absolute highs. This signals a complete psychological shift in the market and the official transition back into a markup phase.
4. The Trade Plan: Entries, Targets, and Risk Management
Entry Strategy: The stock is currently experiencing extreme upside momentum. Chasing a massive weekly expansion candle carries a higher risk of immediate drawdown. The highest-probability, lowest-risk entry would involve stepping down to a daily timeframe and placing limit orders to catch a potential structural pullback to retest the 122.00 to 123.00 breakout zone. Letting that old, heavy resistance prove itself as a new, indestructible support floor offers a phenomenal risk-to-reward ratio.
Take Profit (Targets): We can project a measured structural target by taking the depth of the massive "W" pattern (roughly 40+ points) and adding it to the breakout neckline. This puts the primary macro target in the 160.00 to 165.00 zone. Immediate psychological milestones sit at 140.00 and 150.00.
Invalidation (Stop Loss): A trade thesis is only valid if the market structure holds. A hard stop loss should be placed safely below the recent "higher low" launchpad, around the 108.00 to 110.00 level. A definitive weekly close completely back below the 122.87 line would invalidate the breakout and signal a potential bull trap.
5. Time Horizon:
Because this technical setup is built on a 1-Week chart capturing the completion of a major structural reversal, this is a medium-to-longer-term position trade designed to play out over the coming weeks to months.  Long
Long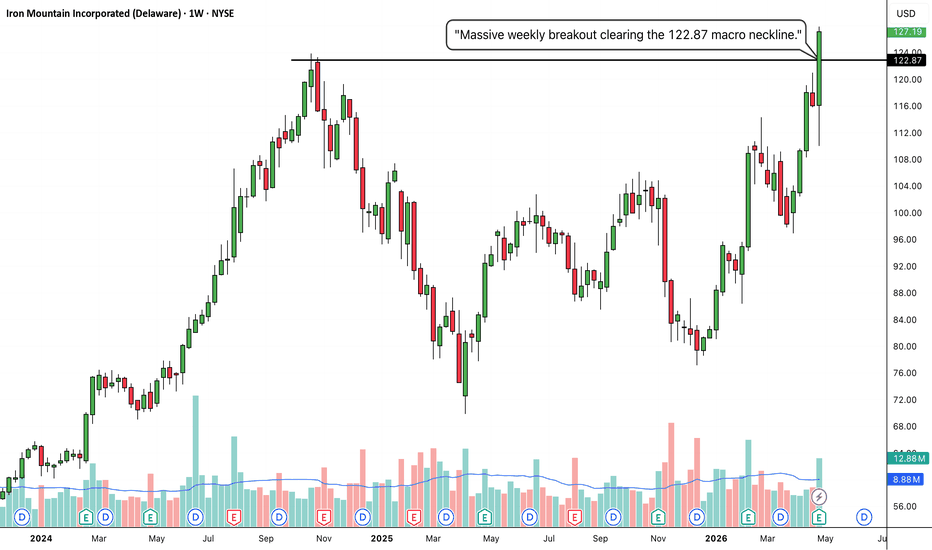
Nifty Alpha 50 Breakout: Adam-&-Eve Double Bottom PatternThe Nifty Alpha 50 NSE:NIFTYALPHA50 Index is a prominent instrument for investors chasing alpha. It is a benchmark index that tracks the performance of 50 stocks with high alpha over the last one year. Historically, it is observed that the Nifty Alpha 50 Index has offered better returns to investors as compared to the flagship indices.
The advantage of the index lies not only in its diversification across different sectors but also in its diversification across large, mid, and small-cap companies. Thus, the index eliminates unsystematic risk while favouring merit over concentration.
However, investors cannot hedge the instrument (during a crisis) as it is not listed for derivatives trading. Systematic risk is still a factor to be considered. Thus, investors have to take the path of exchange-traded funds (ETFs) and mutual funds (MFs) machinery to build long positions.
Breakout: Adam-&-Eve Double Bottom Pattern
The recent sustainable breakout of the Nifty Alpha 50 Index from an observable "Adam-&-Eve Double Bottom" pattern is a sign of the start of the new bull phase. Probably, the index is out of the sideways consolidation. Thus, the index might be considered for a swing, positional, or investment bet.
Strong Support Zone (SSZ): (55000 - 53500)
Stay bullish above the SSZ.
First Resistance Zone: (61500 - 60500)
In its first bullish impulse out of the consolidation, the first resistance area will be in the zone (61500 - 60500). The price might pause for a while in this region. The zone is near its previous high. If the price decisively breaks out of its first resistance zone, then more bullish impulse will be observed. Investors can increase their position size above 61500.
TARGET ESTIMATION: 71500
It is estimated that the index might offer approximately a 32% return in the future, considering its sustainable breakout from the Adam-&-Eve Double Bottom pattern.
STOP LOSS (SL): 52000
Markets are uncertain. Anything can happen in the markets. The swing and positional traders going long in the security must decide a stop loss (SL) level before entering. The stop loss level is 52000. In case the price decisively breaks down below 52000, the swing and positional traders should book the loss with humility.
● Disclaimer + End Note
- All the analyses would fail in the case of a major gap up, gap down, or price structure anomaly. Thus, practice PRAGMATISM in the live session.
- Trade only if there is a set-up. Remember, not trading is an extension of the trading activity.
- Mark your points. Trade your points. Price is GOD. Anything can happen in the markets. Thus, trade what you see, not what you believe.
- Always PRACTICE RISK MANAGEMENT. Always PROTECT YOUR CAPITAL. Be RESPONSIBLE.
- The post is purely based on technical and chart analysis. The author has not studied the fundamentals. Thus, any fundamental or macroeconomic event can disrupt chart analysis.
- The author has no intention to promote buy or sell recommendations.
- The post is only for educational purposes.
- The intent of the post surrounds trading levels as well as an investment idea.
- Novice traders should stick to the cash segment for swing trading instead of F&O. This post has no intention to promote F&O trading.
- Please be mindful during trading and investment decisions. Be Responsible.
- Be Strategic. Be Courageous. Be Patient. Be Wise.
- Every day is a new day. Thus, do not carry the baggage of past successes or failures. Leave the gardens of winning and losing. Establish yourself in equanimity. Always think from a new perspective.
- Let the joy of trading drive your effectiveness, not greed or fear. Believe in Possibilities.
Happy Trading!  Long
Long
DHAMPURSUG: Stage 2 Breakout AttemptAfter topping near 325 in 2022-2023, price went into a clear Stage 4 decline and corrected all the way towards the 110-120 zone. Since then, the stock has built a base between roughly 110 and 150, with multiple attempts to recover above the 150 area.
The 150 zone has now been reclaimed, and price is pressing into the next major resistance around 167-170.
THE BREAKOUT
This week price moved from around 152 to a high near 168, with weekly volume expanding to around 3.8M shares. That is above average and shows real participation.
The breakout is not fully confirmed yet because the weekly candle is still open. A weekly close above 170 would make this a cleaner Stage 2 confirmation.
CONFIRMATION CHECKLIST
Price above the rising 30-week SMA, approx 136
10-week SMA approx 144, also turning up
Mansfield RS above zero, stock is outperforming
Volume expansion visible on the breakout attempt
Price holding above the reclaimed 150 zone
TRADE PLAN
Bias: Long, but only qualified until weekly close confirms
Entry zone: 160-170
Preferred entry: pullback/retest near 150-155, or weekly close above 170
Stop: 149 for swing structure
Structural invalidation: weekly close below 135-136
Target 1: 225-230
Target 2: 255-260
Target 3: 280-285
RISK MANAGEMENT
This is not a clean fresh breakout yet. Price is already extended from the 30-week MA, so chasing aggressively near 170 carries pullback risk.
For me this is a QUALIFIED REVIEW, not a full-size entry yet. A weekly close above 170 with volume would improve the grade.
If price closes back below 150, the breakout attempt weakens and the stock goes back into base mode.
Not investment advice. Do your own work and size for the outcome where you are wrong  Long
Long
 Long
Long
 Long
Long
COCHINSHIP Possible Double Bottom Recovery________________________________________
📊 Cochin Shipyard Ltd.: Daily Technical Snapshot – Possible Double Bottom Recovery
📊 STWP Technical Analysis
________________________________________
MARKET STRUCTURE SNAPSHOT | NSE: COCHINSHIP | DAILY
Closing Price: 1,490.00 (+65.00 | +4.56%)
Core Trend: Recovery Within Uptrend
Market State: Double Bottom Recovery
Price Structure: Price has rebounded strongly after forming a Double Bottom near a key support zone. Buyers have regained momentum and are now attempting to challenge the neckline resistance.
________________________________________
OPERATIONAL PRICE GRID & KEY REFERENCE LEVELS
Model Reference Level: 1,499.90
Hard Invalidation Level: 1,413.80
Structural Risk: 86.10 (5.74%)
Resistance Levels: R1 1,521.10 | R2 1,552.20 | R3 1,604.50
Support Levels: S1 1,437.70 | S2 1,385.40 | S3 1,354.30
Range Structure: Low 1,354.30 | High 1,604.50
Higher Timeframe Observation Zones: 1,552 | 1,605 | 1,700
________________________________________
CPR DATA
Current Bias: BUY ON PULLBACKS
CPR State: Bullish Zone | CPR Moving Down (Increasing Width)
Tomorrow's CPR (Projected): Pivot 1,468.80 | Top 1,479.40 | Bottom 1,458.20
________________________________________
💡 STWP Quick Read
Price is recovering from a Double Bottom formation.
Buyers are challenging the neckline resistance.
Strong volume supports the current recovery.
Momentum indicators continue to favour buyers.
This chart is shared purely for educational purposes.
________________________________________
📚 EDUCATIONAL OBSERVATION
Cochin Shipyard has staged a strong recovery after forming a Double Bottom, a classical bullish reversal pattern that often develops after an extended correction. The stock successfully defended the support area near 1,355–1,385 on two separate occasions before attracting fresh buying interest, indicating that sellers may be losing control. The latest bullish candle has pushed price towards the neckline resistance, signalling that buyers are attempting to complete the reversal pattern. A sustained move above the neckline could confirm the Double Bottom breakout and improve the probability of a continuation towards higher resistance levels. Several technical factors are currently aligned in support of the developing structure, including a possible Double Bottom recovery.
Volume expanded to 3.35 million shares, significantly above the 20-day average of 954.4 thousand shares, representing a participation ratio of approximately 3.51x. Such strong volume expansion indicates increased market interest and adds credibility to the bullish recovery from the Double Bottom formation.
The projected Central Pivot Range (CPR) for the next session has shifted higher, with the projected Pivot at 1,468.80, indicating improving market acceptance of higher prices.
Immediate attention remains focused on the neckline resistance between 1,521 and 1,552. A sustained breakout above this zone could confirm the reversal pattern and bring the higher timeframe observation zone near 1,605 into focus. On the downside, 1,438 remains the first important support, while the structural invalidation level is positioned near 1,414.
________________________________________
🏢 BUSINESS & FUNDAMENTAL UPDATE
Cochin Shipyard continues to benefit from India's expanding focus on shipbuilding, naval defence, commercial vessel construction and ship repair services. The company maintains a healthy order book supported by defence contracts, export opportunities and increasing investments in maritime infrastructure under the Government's long-term shipping and defence initiatives. Its diversified project pipeline and strong execution capabilities continue to provide a constructive long-term business outlook.
________________________________________
📖 Educational Note
Support and resistance levels should be treated as observation zones rather than predictive targets. Chart patterns, price action, momentum indicators, volume analysis and CPR are educational tools that help market participants understand evolving market structure within a disciplined risk-management framework.
________________________________________
⚠️ Disclaimer
This analysis is provided strictly for educational and informational purposes.
This is not financial, investment or trading advice and should not be considered a recommendation to buy or sell any security.
Stock market investments are subject to market risks, including the possible loss of capital.
Past performance, historical observations, chart patterns and technical indicators do not guarantee future results.
Please conduct your own research and consult a SEBI-registered investment adviser before making investment decisions.
STWP assumes no responsibility or liability for any financial loss arising directly or indirectly from the use of this information.
 Long
Long
 Long
Long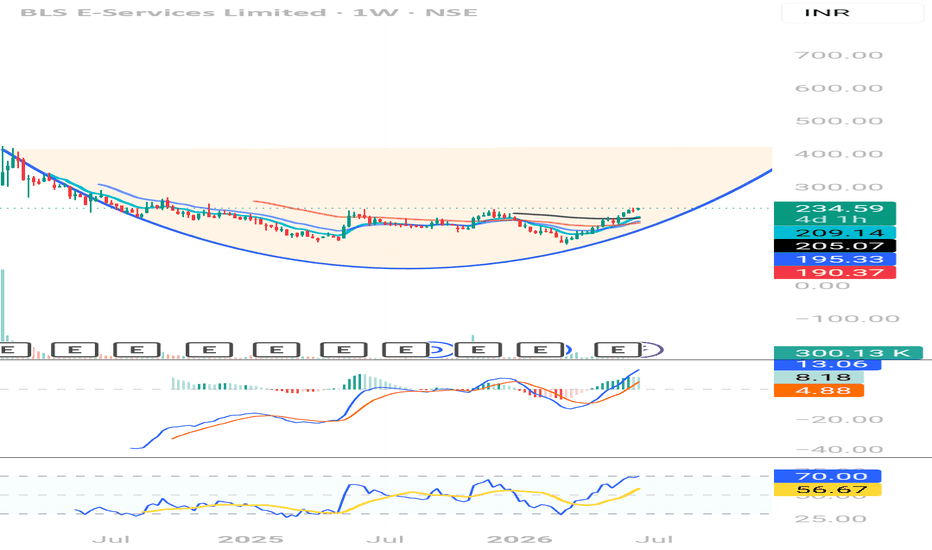
ESCORTS Creating Textbook Double Bottom at Key Support |ESCORTS is currently at a pivotal inflection point.
The combination of a second bottom test and a textbook Hammer candle at major support significantly improves the bullish probability. This setup suggests that selling pressure is waning and smart money is stepping in to defend the ₹2700–2780 demand zone.
Historically, such double bottoms accompanied by reversal candles like hammers often lead to strong counter-trend rallies, especially when they occur after an extended down-move.The risk-reward profile is highly favorable on the long side provided proper confirmation is observed.
Traders entering on hammer confirmation or bottom reversal can target a minimum 10–15% upside to ₹3100–3300 with well-defined risk below the recent lows.
This level also offers a good accumulation opportunity for medium-to-long-term investors if fundamentals (rural economy, tractor sales outlook) align.
However, patience is key — do not jump in without follow-through. False breakdowns near such supports are common, hence strict stop-loss discipline is non-negotiable. Overall structure still carries some bearish remnants, but the current candle and pattern tilt the near-term bias clearly bullish.
Entry:
Aggressive Entry: Above 2810 on strong follow-through volume. This confirms the reversal.
Conservative Entry: Wait for a decisive close above 2810 (recent swing high).
This breakout would complete the pattern and offer higher conviction.
Stop Loss (SL):
Initial SL: Below the low of the Hammer / second bottom, i.e., 2690. This protects against a false breakdown.
Target 1:
₹3010 (immediate resistance and 50% retracement of the recent leg down) — R:R ≈ 1:2
Target 2:
₹3212 (previous breakdown zone and major supply area) — R:R ≈ 1:4+
Target 3 (Extended):
₹3379 (next major resistance, possible retest of earlier highs)
Confirm the pattern with rising volume on upside candles in the coming sessions.
Monitor broader market sentiment — Auto/tractor sector performance and Nifty trend will influence follow-through.
Avoid large positions until the neckline breakout. Partial profit booking at Target 1 is advisable.
Timeframe: 2–8 weeks for swing trade.
If price breaks and closes decisively below ₹2680 with high volume, the double bottom fails. In that case, the downtrend resumes with targets at ₹2550 → ₹2400. Shorts can then be initiated with SL above ₹2800.
This is technical analysis only based on the chart and your observation. Combine with latest news, earnings, and sector data. Trade responsibly with proper risk management. Past patterns do not guarantee future results.
 Long
Long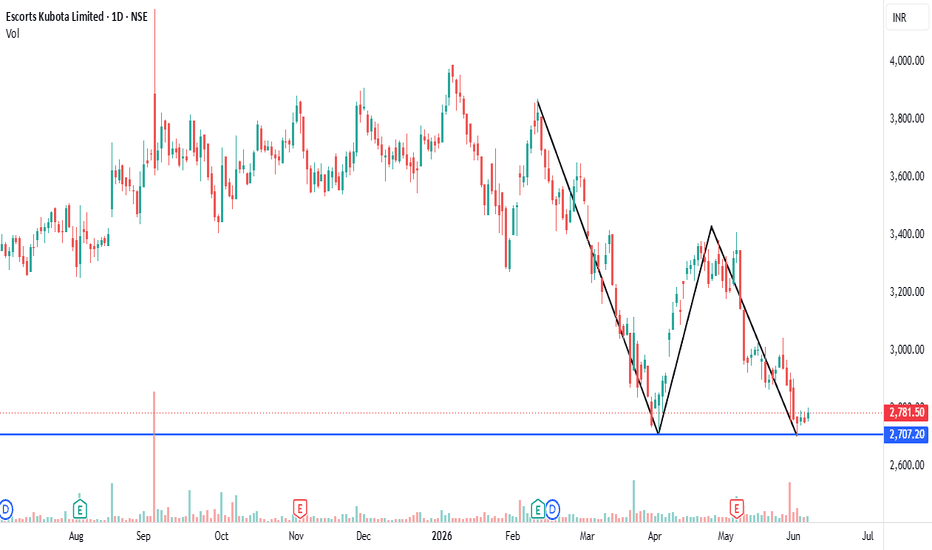
 Long
Long