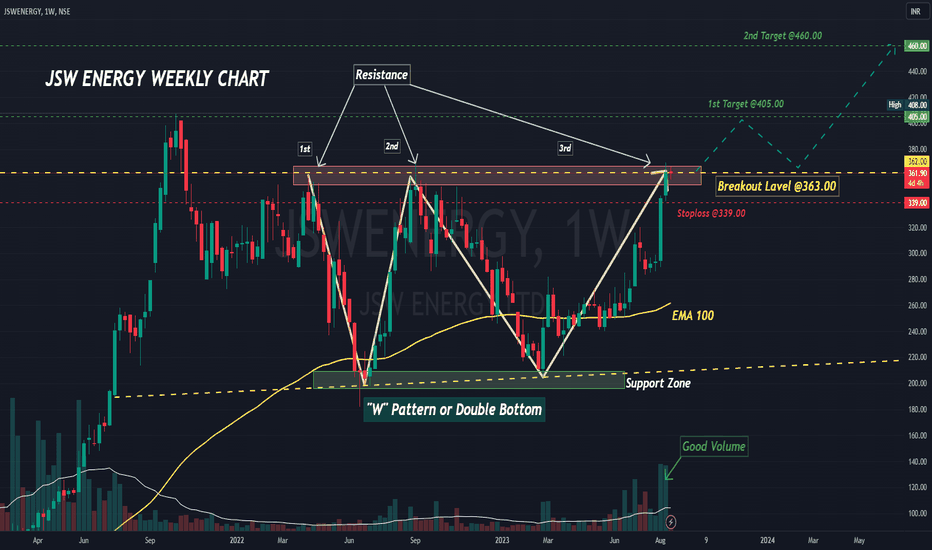
JSW ENERGY WEEKLY CHART BREAKOUT IDEAJSW Energy Weekly Chart Breakout Happening on the Short Term Basis...
This Stock created the Resistance Zone around 355.00 to 365.00 level as 1st time it was touched the level April' 2022...
It was touched the Resistance Level on 2nd time around September' 2022...
And just Lest week it was touched the same Resistance Level on 3rd time....
Its also creating "W" Pattern or Double Bottom on the Weekly Chart for Bullish run.
Weekly Volume showing Good sign since March-April 2021...
We are expecting a clean Breakout from @363.00 if its will sustain above @363.00
:: Data Point ::
Breakout Level: @363.00
1st Target: @405.00
2nd Target: @460.00
Stoploss Point: @339.00
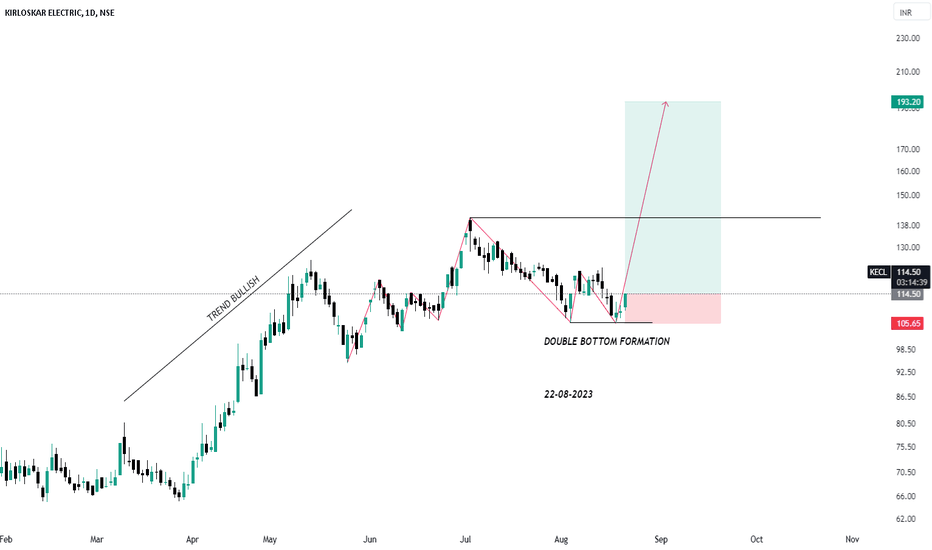
Double Bottom
Mastering the Double Bottom Chart PatternA double bottom, combined with RSI divergence, can be a powerful signal for a trend reversal.
What's a Double Bottom ?
It's when a stock's price forms two distinct lows on a chart.
The pattern is confirmed when prices rise above the peak between those two lows.
Why Does It Matter?
The double bottom marks the end of a downtrend and the start of an uptrend.
It's one of the most common patterns, but it needs careful analysis.
Adding RSI Divergence:
RSI measures a stock's strength and momentum.
Look for RSI to form higher lows while the price forms lower lows. This is RSI divergence and a strong bullish signal.
Key Points to Remember
Downtrend First: The pattern begins in a downtrend.
Time Gap: The longer the time between the two lows, the stronger the reversal signal.
Price Increase: Look for a significant price increase between the two lows (around 10-20%).
Volume Matters: Usually, volume is higher during the first low and increases as the pattern confirms.
Breakout Confirmation: Don't act until prices break above the confirmation point.
Pullback After Breakout: Expect a pullback after the breakout; it's normal.
Trading the Double Bottom with RSI Divergence:
Calculate a target price by adding the pattern's height to the breakout point.
Confirm the pattern only after prices break through the confirmation point.
Be patient; not all patterns are double bottoms.
Watch for volume during the pattern's development.
Pay attention to RSI divergence for added confirmation.
Remember: Wait for confirmation, and don't rush into trades based solely on patterns. It's wise to use multiple indicators, including RSI, and keep an eye on market conditions.
I am not Sebi registered analyst. My studies are for educational purpose only.
Please Consult your financial advisor before trading or investing. I am not responsible for any kinds of your profits and your losses.
Most investors treat trading as a hobby because they have a full-time job doing something else.
However, If you treat trading like a business, it will pay you like a business.
If you treat like a hobby, hobbies don't pay, they cost you...!
Hope this post is helpful to community
Thanks
RK๐
Disclaimer and Risk Warning.
The analysis and discussion provided on in.tradingview.com is intended for educational purposes only and should not be relied upon for trading decisions. RK_Charts is not an investment adviser and the information provided here should not be taken as professional investment advice. Before buying or selling any investments, securities, or precious metals, it is recommended that you conduct your own due diligence. RK_Charts does not share in your profits and will not take responsibility for any losses you may incur. So Please Consult your financial advisor before trading or investing.
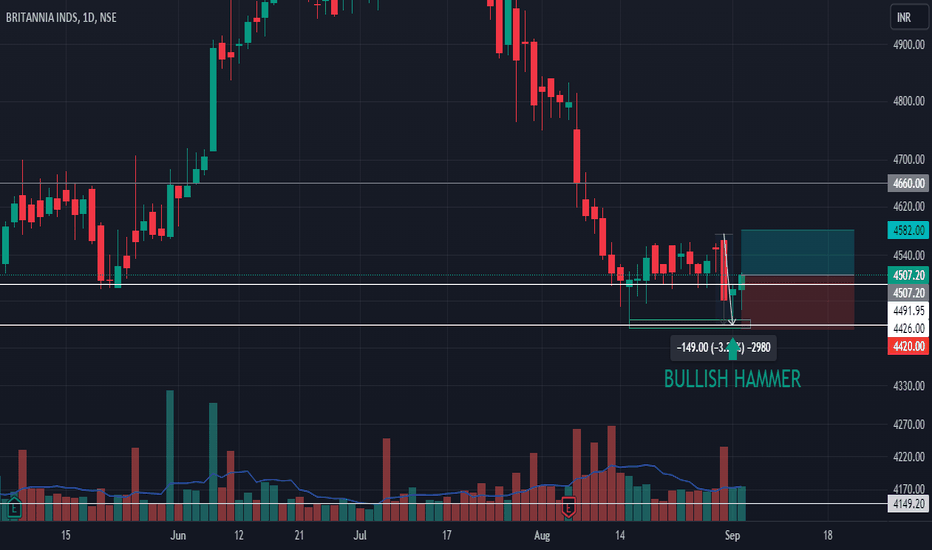
$NSE:BRITANNIA,1D formed Bullish HammerNSE:BRITANNIA Britannia Industries Limited is an Indian multinational FMCG company specialised in food industry, part of the Wadia Group headed by Nusli Wadia. Founded in 1892 and headquartered in Kolkata, it is one of India's oldest existing companies and best known for its biscuit products.
NSE:BRITANNIA , 1D gave closing above Bullish Hammer. The body of today's candle is bigger than previous day body(which means buyer's are interested and volume slightly more than the previous day). It looks like double bottom is in formation.
Entry : 4507.2
Target : 4582/4660
SL : 4420
RR : 0.85/1.75
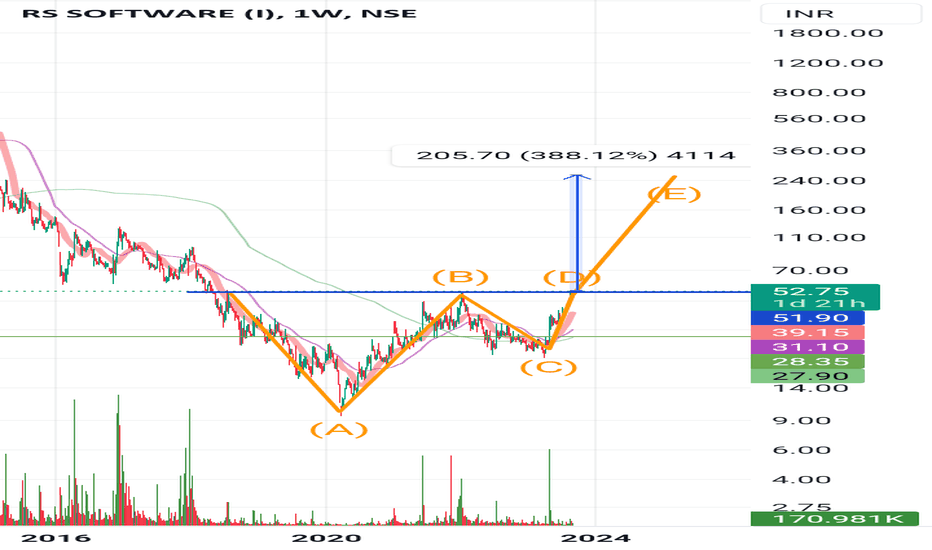
Micro cap company potential to double current price Stock chart show current price will be double stock price keeping 27-30 as Stop loss.
Company last 3 quater giving positive results
Positive of the company is giving UPI service by this company. Pramoter itself telling this company global 30% online money transfer using this company
No cash generating company
Operating cash flow is negetive
Double Bottom pattern breakout in LAURUSLABSLAURUS LABS
Key highlights: ๐กโก
โ
On 1Hour Time Frame Stock Showing Breakout of Double Bottom Pattern.
โ
Strong Bullish Candlestick Form on this timeframe.
โ
It can give movement up to the Breakout target of 410+.
โ
Can Go Long in this stock by placing a stop loss below 390-.
Banknifty (only for min 100-300 points target)Banknifty . (Only for Experienced traders" )
Enter after " Breakout and Retracement ".
.
.
For " long "
entry: 44620 / 45120
target: 45030 - 45250 - 45760
stoploss: 44500 / 44980
.
.
For " Short"
entry: 44410
target: 44250, 44030
stoploss: 44580
.
Enter only if market Breaks
"Yellow box" mentioned.
.
Wait for proper reversal and conformation.
.
Don't make complicated trade set-up.๐๐
Keep it " Simple, Focus on Consistency " ๐น.
Refer our old ideas for accuracy rate๐งโ๐ป.
Valuable comments are welcomed-โ๏ธ
.
.
Disclaimer:
Our Trading style is not to capture "10-20" points per trade.๐
We take entry only for min "100-300" points without any distractions.๐น
So, our ideas may not be preferable for small traders, who just focusing on too much of support and resistance.๐๐๐
So, please consider others ideas.
This is for educational purposes.๐งโ๐ป
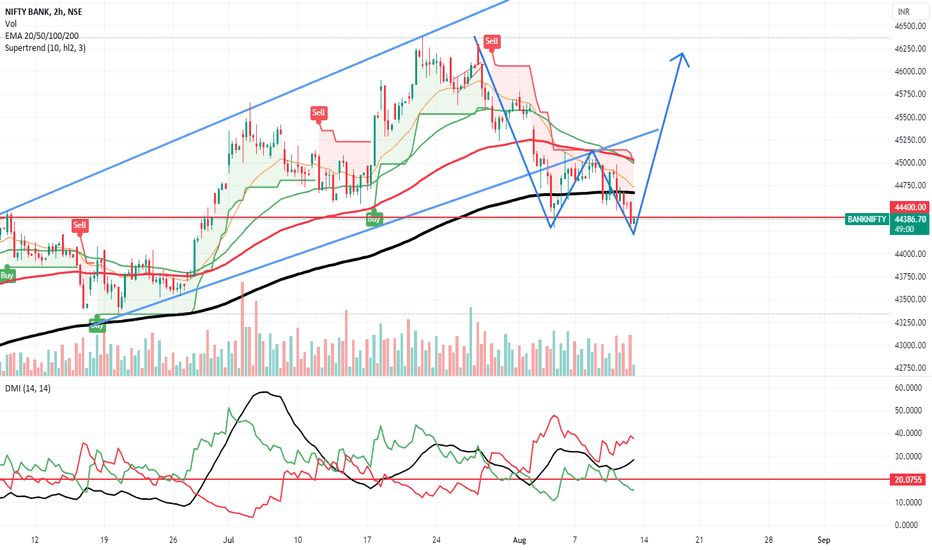
BANKNIFTY still 17th Aug ExpiryHello Friends,
This is my first bank nifty analysis and trying to trade in bank nifty
Let's quick review on it.
As after long fall it looks like making support at level 44300.
Pattern is built up double bottom so if buy ATM CE then it can be good opportunity for today or tomorrow for 2-3 days only.
There is looks like all events are done so it does not seems to be more fall and also near to complete one correction so now it should bounce back to up trend.
so lets see what we can get results of this analysis. do you own and trade on your own risk.
thank you.
Banknifty ( Mostly Bullish ); Intraday.Banknifty .
Enter once after " Breakout and Retracement ".
.
.
For " long "
entry: 45410
target: 45575 - 45760
stoploss: 45200
.
.
For " Short"
entry: 45230
target: 45020 - 4487
stoploss: 45350
.
Enter only if market Breaks
"Yellow box" mentioned.
.
Wait for proper reversal and conformation.
.
Don't make complicated trade set-up.๐๐
Keep it " simple, focus on consistency "๐น.
Refer our old ideas for accuracy rate๐งโ๐ป.
Valuable comments are welcomed-โ๏ธ
.
refer old ideas attached below
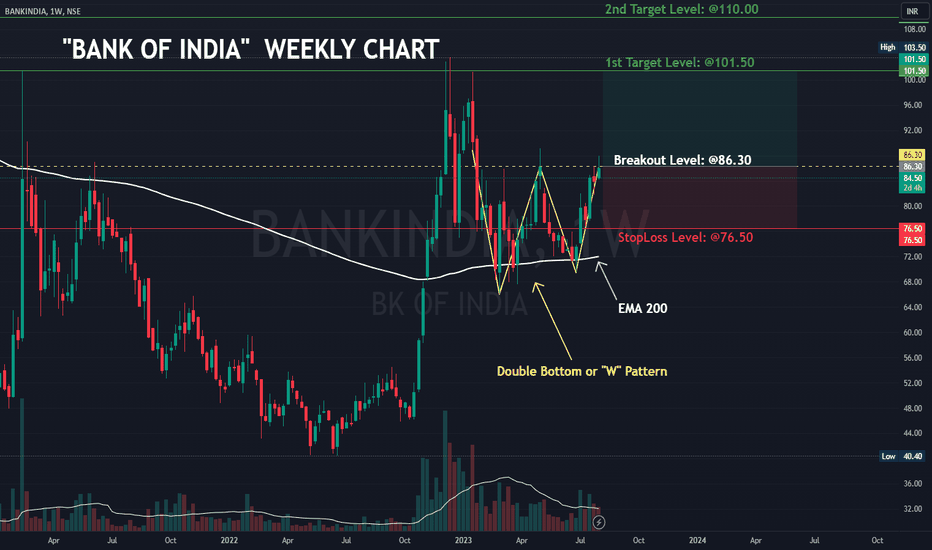
BANK OF INDIA Weekly Chart Potential Breakout LevelBANK OF INDIA Weekly Chart Breakout
If BANK OF INDIA Daily chart close above @86.30 then go for Bullish run on Short Term Perspective.
::Data Point::
Potential Breakout Level: @86.30 (Entry Point)
StopLoss Level: @76.50 ( approx. 10%)
1st Target Level: @101.50 (approx. 18%)
2nd Target Level: @110.00 (approx. 27%)
Dollar Industries Intermediate Term looks bullish!It appears that the price of Dollar Industries Ltd. has reached its lowest point after trying and failing to go below a certain level. Instead, it started going up again, which is a sign that a new upward trend may be starting. the price seems going above the highest point between the two lows, it confirms that the trend is changing to a more positive one and looks like Double Bottom .
The Double Bottom is a reversal pattern of a downward trend in a stock's price.
Note for everyone who came across this reference:
This chart analysis is only for reference purpose.
This is not buying or selling recommendations.
I am not SEBI registered.
Please consult your financial advisor before taking any trade.
HIMATSEIDE Analysis(Double Bottom)!HIMATSEIDE Analysis on Weekly Timeframe
Bullish view on HIMATSEIDE
Double Bottom Pattern Formation in HIMATSEIDE
Neckline Breakout
HIMATSEIDE has made double bottom patten on Weekly Timeframe. The price has given breakout to the neckline 85.45 and now it is trading above it. We can see the breakout has happend with the good volume. We can expect further upmove upto 107.80.
Trade Psychology and Setup =
Entry = Between 85 - 90 but it will good if we can enter with lower price
Target = 107.80
Stop Loss = Below 75.80
Disclaimer = All my analysis are for Educational Purpose only. Before entering into any trade - 1) Educate Yourself 2) Do your own research and analysis 3) Define your Risk to Reward ratio 4)Don't trade with full capital
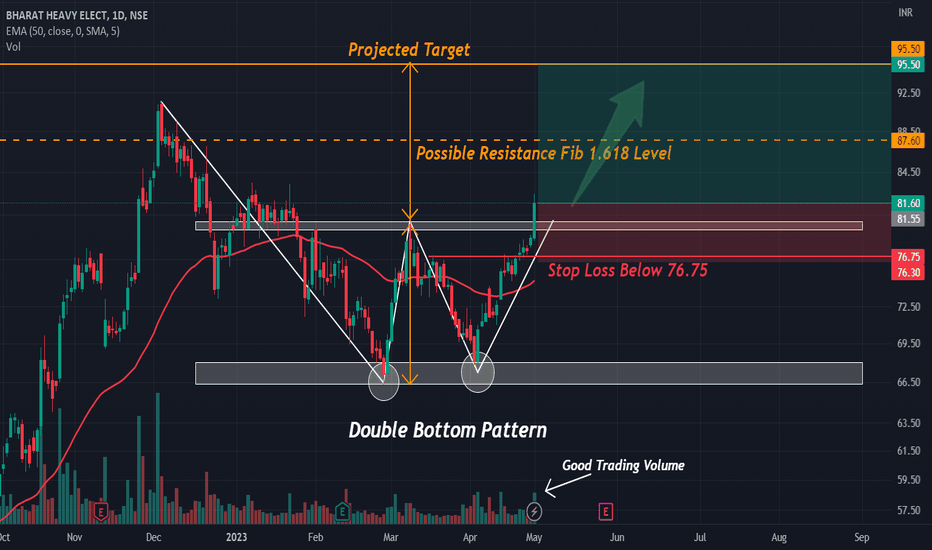
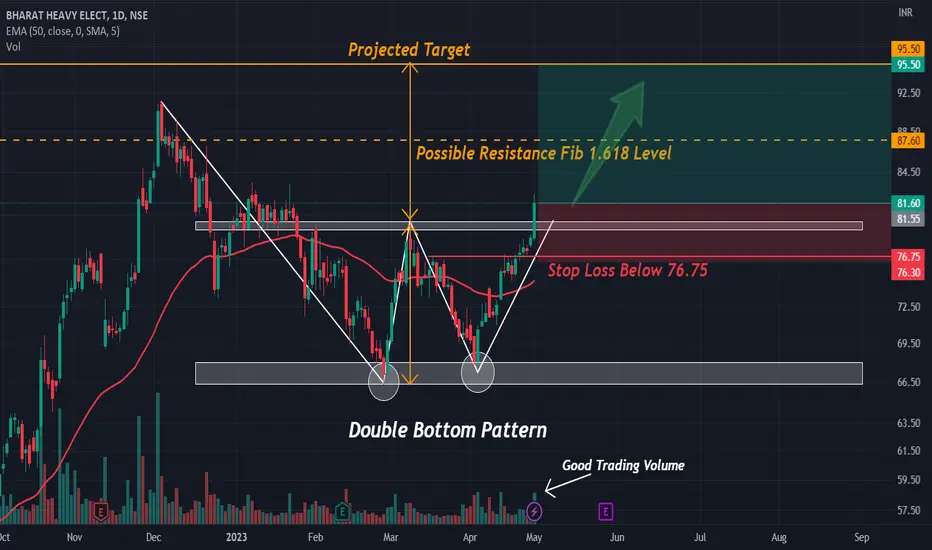
BHEL Analysis(W Pattern)!BHEL Daily Analysis/b]
Double Bottom (W) Pattern formation in BHEL
Will it move as per Double Bottom Pattern Analysis? Will See!!
BHEL has made double bottom pattern on Daily Timeframe and also it has given neckline breakout 79.85 with good volume and successfully able to close above it. BHEL is trading above 50 EMA which is also a confirmation of bullish trend.
Trading Psychology and Setup =
Entry = Entry will be between 80-82
Target = Target 1 will be 87.60 which is also a 1.618 fib level and will acts like a possible resistance and 2nd will be 95.50
Stop Loss = Below 76.75
Disclaimer = All my analysis are for Educational Purpose only. Before entering into any trade - 1) Educate Yourself 2) Do your own research and analysis 3) Define your Risk to Reward ratio 4)Don't trade with full capital
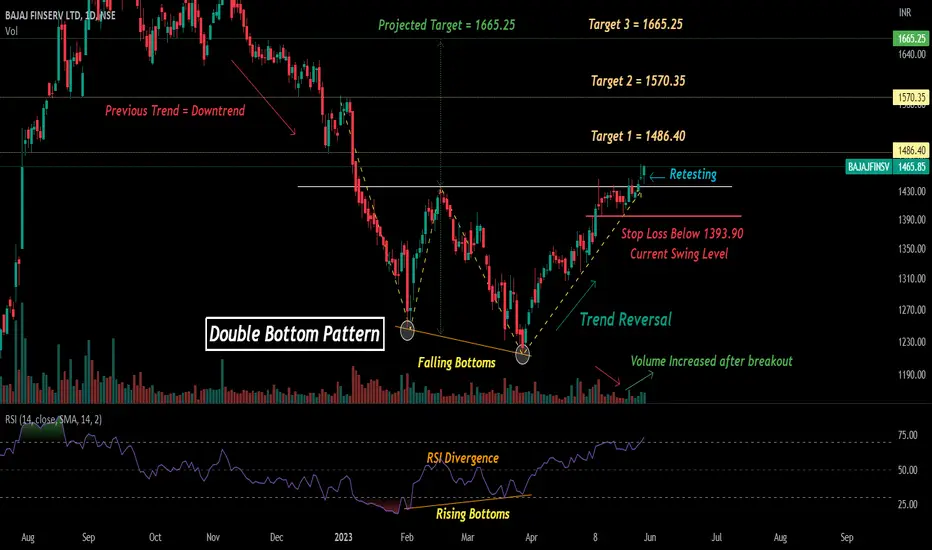
BAJAJFINSV Analysis(Double Bottom)!NSE:BAJAJFINSV ANALYSIS!
BAJAJFINSV Daily Analysis!
Double Bottom Pattern Formation and Breakout in BAJAJFINSV!
RSI Divergence in BAJAJFINSV!
Double Bottom Pattern analysis with RSI Divergence
BAJAJFINSV has made Double Bottom Pattern on a daily timeframe it has given a breakout to the neck level and retested it's support level at the neckline only. If we see the RSI we can see the clear Divergence, while price making falling bottoms RSI making Rising Bottoms. We can expect price to move in the upward direction.
Entry = Aggressive investors can buy at current levels, Conservative investors can wait for small retest.
Stop Loss = Below 1393.90
Targets = 1) 1486.40 3) 1570.35 3) 1665.25
Disclaimer = All my analysis are for Educational Purpose only. Before entering into any trade - 1) Educate Yourself 2) Do your own research and analysis 3) Define your Risk to Reward ratio 4) Don't trade with full capital
Banknifty ( 31/07/2023 )Banknifty for ( 30/07/2023 )
Enter once after " Breakout and Retracement "
.
.
For " long "
entry: 45530
target: 45760
stoploss: 45450
.
.
For " Short"
entry: 45380
target: 45250 - 45020
stoploss: 45510
.
.
Enter only if market Breaks
"Yellow box" mentioned.
.
Wait for proper reversal and conformation.
.
Don't make complicated trade set-up.๐๐
Keep it " simple, focus on consistency "๐น
Refer our old ideas for accuracy rate๐งโ๐ป
Valuable comments are welcomed-โ๏ธ
.
refer old ideas attached below
Dabur India, BullishDabur India shows bullish setup with confluence of multiple patterns. The stock is trading below and
approaching #200EMA which is important support / resistance level. The stock has given 5month
trendline breakout, along with W-pattern and is also forming rounding bottom pattern. The key levels
to watch out are indicated in the chart.