Nifty 50 Long-Term Valuation & Reversal PredictionInvestment Note: Nifty 50 Long-Term Valuation & Technical Outlook
Date: March 31, 2026
Subject: Nifty 50 Strategic Reversal Zone and Multi-Year Valuation Analysis
The Nifty 50 is currently approaching a significant historical value zone. With the Current PE at 19.62,
Historical data from the past decade suggests that the Nifty rarely sustains levels below a PE of 20 for extended periods. This fundamental valuation, combined with a "Flat Correction" technical pattern, suggests a strong probability of a reversal from the current levels 22000-21350.
Valuation Analysis: The PE 20 Floor
Analysis of the last 10 years indicates that the Nifty 50 maintains a healthy LT Average PE ratio between 20x and 22x.
Current Status: At a PE of 19.62, the index is entering the "Cheap" territory (typically defined as <20x).
Historical Precedent: As seen in 2016, 2020, and 2022, major reversals have consistently triggered when the PE drops into the 19.3x – 20.4x range.
Technical Outlook & Key Levels
The price action is currently completing a Flat Correction pattern, which aligns with a major structural support zone.
Expected Reversal Zone: 21,350 – 22,000
This range represents a high-concurrency zone where technical support meets fundamental value.
Immediate Resistance/Target: 26,370
A successful reversal from the 22,000 base sets the stage for a recovery toward previous highs.
Long-Term Upside Projection: 30,750
Based on current projections, this represents an estimated ~40% upside from the expected reversal floor.
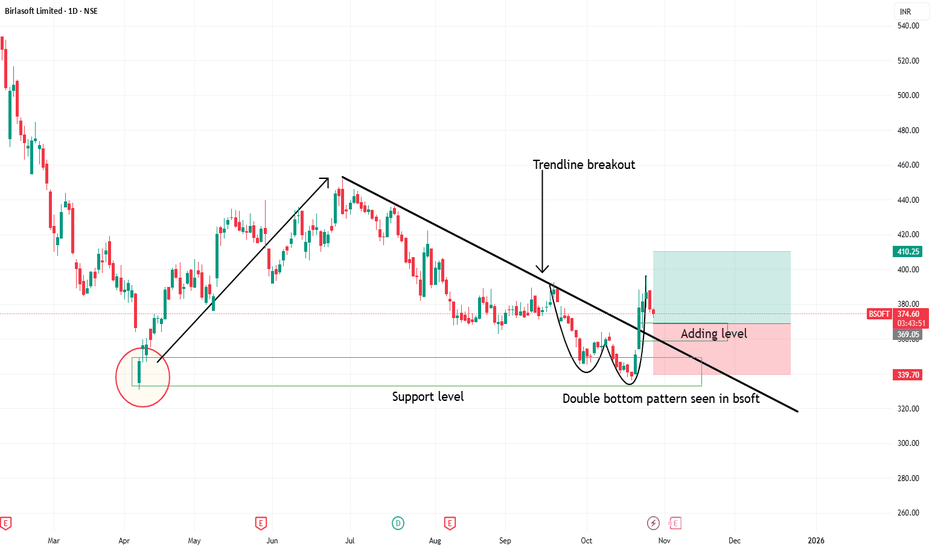
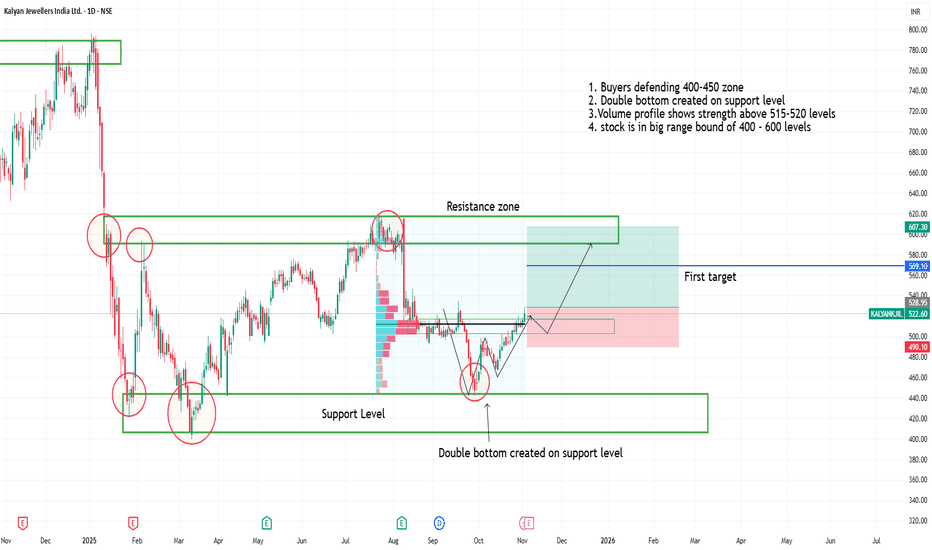
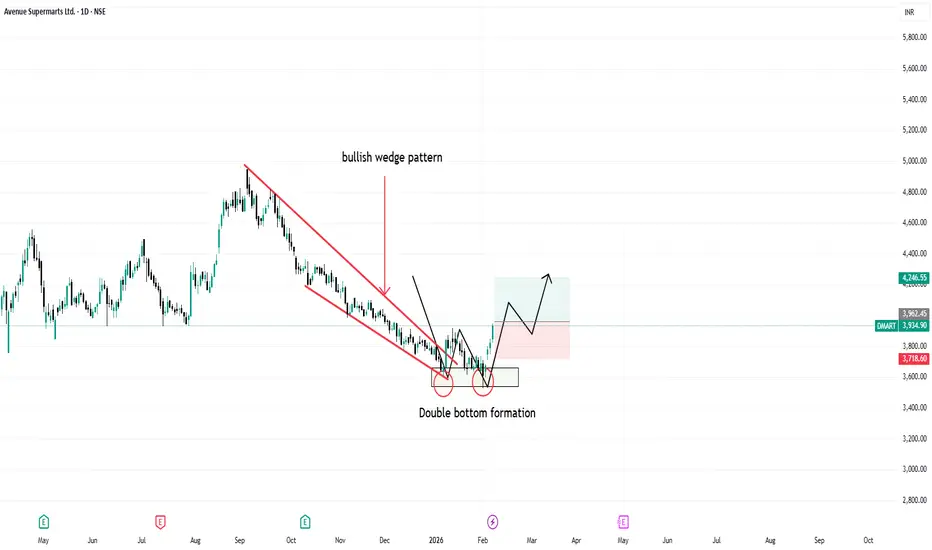
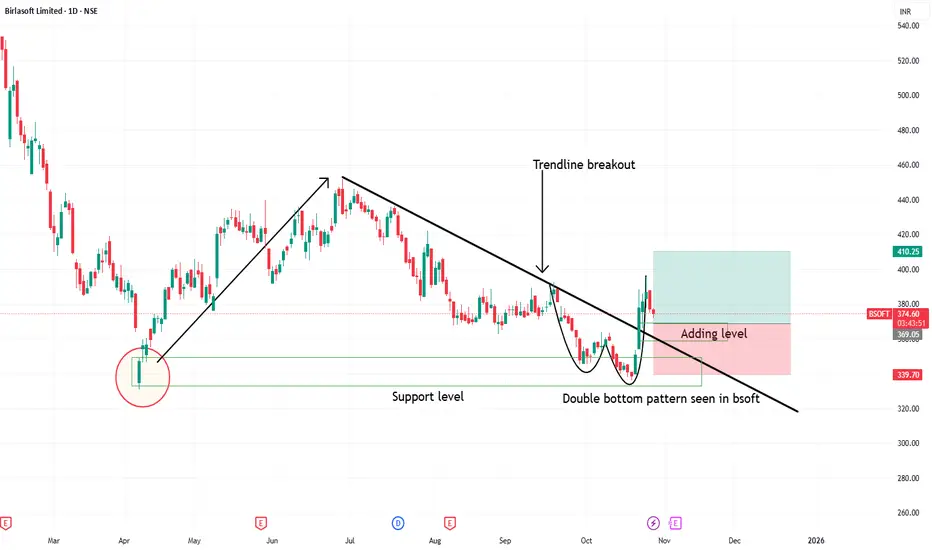
Double Bottom
ABLBL — Near All-Time Bottom | Possible Double Bottom Setup📊 Observations:
Long-term downtrend seems to be slowing
Price approaching all-time support region
RSI near oversold zone
Momentum showing exhaustion after continuous selling
Potential double bottom formation if support holds
⚠️ Confirmation needed:
Strong volume accumulation
Break above recent swing high
If support sustains, this zone may offer a high risk-reward reversal opportunity.
Note:
Not a buy/sell recommendation. For educational purposes only.
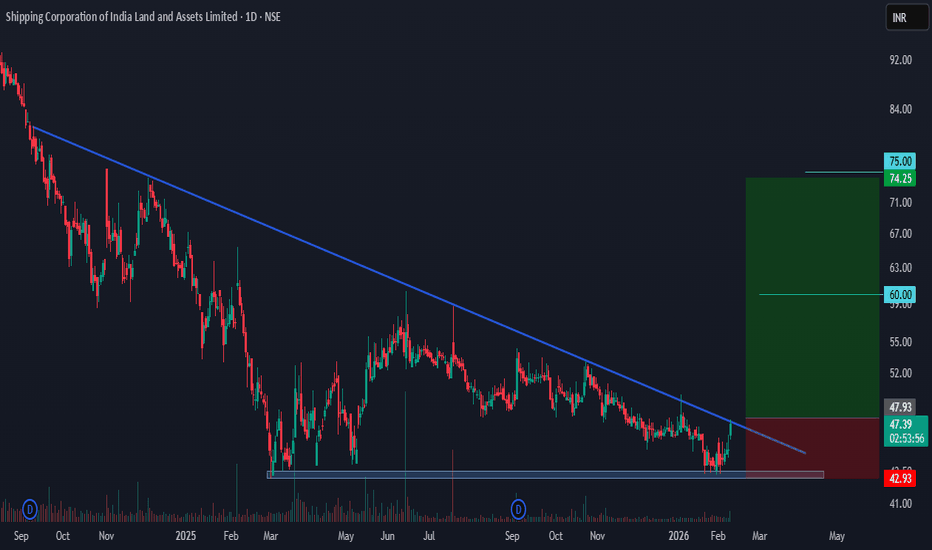
Breakout Ready Stock | Keep On watchThe technical setup for SCILAL is currently one of the most compelling "value unlock" stories on the board. After a painful period of sideways consolidation near its 52-week lows, the stock is finally showing signs of life, breaking out from a tight ₹43–₹45 range with renewed momentum. Your marked targets of ₹52 and ₹60 align perfectly with historical resistance zones and previous swing highs. As long as the stock stays comfortably above the ₹42.80 support level, the bullish thesis remains intact, suggesting that the "bottom is in" and the next leg of the rally is just beginning.
Supporting this breakout is a wave of fresh fundamental news that provides the "why" behind the price move. Just this past week (February 4, 2026), SCILAL reported its Q3 results showing a 10% YoY growth in net profit, largely driven by its rental and interest income. Even more significant for long-term holders is the Union Budget 2026 announcement regarding dedicated REITs for PSU land assets. This provides a clear, professional framework for SCILAL to finally monetize its massive land bank—something the market has been waiting for since the demerger from SCI.
With the government extending the CMD’s leadership for another year to ensure continuity and a 48% increase in the shipping ministry’s budget allocation, the macro environment has shifted from "uncertain" to "supportive." We are looking at a debt-free company trading at an attractive price-to-book ratio, right as the technicals signal a major trend reversal. If the volume continues to pick up, the move toward ₹60 could happen much faster than the previous consolidation period
Silver Price Action set up with double bottomThe current price analysis for XAGUSD (Silver against US Dollar) in early November 2025 reveals a mixed but cautious outlook. Silver prices are moving within a corrective phase after exiting a bullish channel, trading approximately in the $47.50 range. Technical indicators such as moving averages currently suggest a bearish to neutral trend, with the price testing key resistance levels around $48.45.
Price momentum shows attempts to push higher, but resistance near $48.45 may lead to a price pullback or consolidation. If silver breaks above the critical resistance at $50.45, it could signal a renewed upward trend targeting levels around $52.35. Conversely, a failure to hold support near $46.75-47.00 may accelerate declines towards below $41.45, indicating a bearish phase.
Fundamentally, silver is influenced by the strength of the US dollar, industrial demand recovery (notably from solar energy and electronics sectors), and safe-haven buying amid global market uncertainty. The metal’s sensitivity to Federal Reserve policy and economic indicators continues to drive short-term volatility.
Traders should watch for sustained moves beyond the $48-$49 resistance or breakdown below $46.75 to gauge next directional trends. Overall, silver price dynamics suggest potential for both short-term rallies and corrections, dependent on macroeconomic cues and technical breakouts.
BSE cmp 2790.60 by Daily Chart viewBSE cmp 2790.60 by Daily Chart view
- Support Zone 2570 to 2670 Price Band
- Resistance Zone 2790 to 2915 Price Band
- Bullish "W" Double Bottom by Support Zone base
- Rising Support Trendline well sustained and respected
- Falling Resistance Zone Trendline Breakout been attempted
- Volumes spiked today with good sync with the avg traded qty
BUY TODAY SELL TOMORROW for 5%DON’T HAVE TIME TO MANAGE YOUR TRADES?
- Take BTST trades at 3:25 pm every day
- Try to exit by taking 4-7% profit of each trade
- SL can also be maintained as closing below the low of the breakout candle
Now, why do I prefer BTST over swing trades? The primary reason is that I have observed that 90% of the stocks give most of the movement in just 1-2 days and the rest of the time they either consolidate or fall
Double Bottom Breakout in 5 PAISA
BUY TODAY SELL TOMORROW for 5%
Nifty spot 26328.55 by Daily Chart view - Weekly UpdateNifty spot 26328.55 by Daily Chart view - Weekly Update
_*Nifty created a New Lifetime High Milestone 26340 on 02-Jan-2026*_
- Support Zone 25915 to 26185 for Nifty
- Resistance only at ATH 26340 for Nifty and each New ATH
- Volumes trending above avg traded quantity but with selling pressure
- Bullish Rising W formed by the neckline at previous ATH and New ATH level
- Hope to see further higher levels for the Nifty Index through the New Year 2026
Kross cmp 176.22 by Daily Chart view since listedKross cmp 176.22 by Daily Chart view since listed
- Support Zone 156 to 166 Price Band
- Resistance Zone 180 to 192 Price Band
- Volume attempting sync with avg traded qty
- Bullish Double Bottom "W" with Support Zone base
- Falling Resistance Trendline Breakout has well sustained
- Resistance Zone neckline acting as good hurdle for Breakout
- Majority of the Technical Indicators seen trending fairly positive
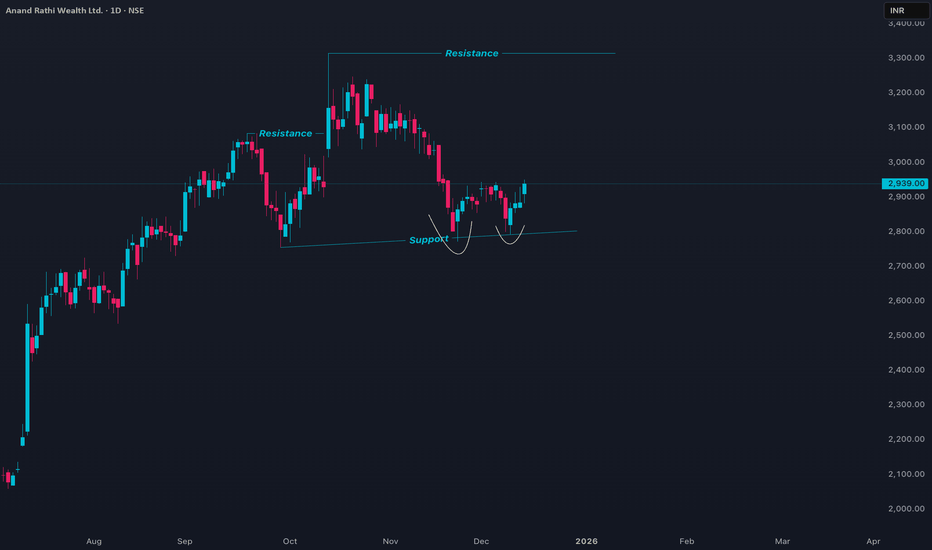
ANANDRATHI Price ActionANANDRATHI trades at elevated valuations with strong earnings growth but is showing short-term weakness after recent peaks, making it a hold for positional traders with resistance ahead.
## Current positioning
Price hovers around 2900-2950 after a +1.9% daily gain, but sits below the 50-day MA near 3015, signaling mild distribution pressure in what remains a multi-year uptrend from 1600 lows.
## Momentum & structure
Bullish bias intact with price above 200-day MA (2440), healthy EPS growth supporting 70x P/E, but RSI cooling from overbought suggests consolidation or pullback toward 2800-2850 support before next leg.
Birlasoft cmp 397.10 by Weekly Chart viewBirlasoft cmp 397.10 by Weekly Chart view
- Support Zone 340 to 375 Price Band
- Resistance Zone 446 to 482 Price Band
- Falling Price Channel Breakout seems been sustained
- Bullish "W" Double Bottom seems to be in the making process
- Fresh Breakout subject to Resistance Zone crossover and closure above it for few days
As posted earlier 1:2 done As posted earlier i was sitting long in Btcusdt, 1:2 is done and i am out of the trade with 70% qunatity.
BINANCE:BTCUSDT
Like and follow for these types of trade ideas !!
And Join me with my journey so you can make yours 👍
Disclaimer: This is not financial advice. Please consult your financial advisor before making any investment decisions.
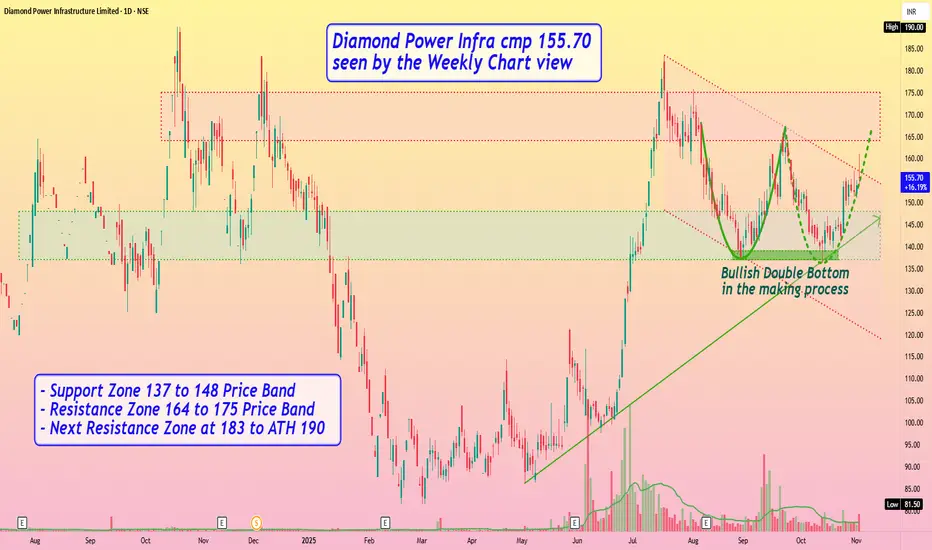
Diamond Power Infra cmp 155.70 seen by the Weekly Chart viewDiamond Power Infra cmp 155.70 seen by the Weekly Chart view
- Support Zone 137 to 148 Price Band
- Resistance Zone 164 to 175 Price Band
- Next Resistance Zone at 183 to ATH 190
- Bullish Double Bottom in the making process
- Rising Support Trendline seems well respected
- Volumes spiking regularly by close sync with avg traded qty
- Falling Price Channel Breakout seems to be in the making process
PROTEAN Cup & Handle with double bottom reversal set upProtean eGov Technologies Ltd (PROTEAN) is trading around ₹865 as of early November 2025, with the stock having a year high of ₹1,535 and a low near ₹716. The stock has declined roughly 35% over the last 6 months and about 42% year-on-year from its peak. Valuation metrics show a price-to-earnings (P/E) ratio near 37 and a price-to-book (P/B) ratio around 3.45, indicating a relatively high valuation considering recent price declines.
The company has zero debt, which strengthens its financial stability, but revenue growth has been weak with a recent contraction and modest sales increase in some quarters. Profitability margins remain moderate, and earnings per share (EPS) stood at around ₹23.3. Dividend yield is low at about 1.16%.
Technically, the stock is trading below its 200-day moving average (~₹1,053) and close to the 50-day average (~₹879), suggesting some near-term weakness. Support may be near the recent lows of ₹716, with resistance close to ₹900–₹950. Overall, Protean presents a cautious medium-term outlook, with fundamental strengths balanced by valuation and growth concerns.
MCX - Bullish W-Pattern (Double Bottom Breakout)________________________________________
🚀 Multi Commodity Exchange of India Ltd (NSE: MCX) | Bullish W-Pattern (Double Bottom Breakout)
📊 Current Market Snapshot
CMP: ₹8,706.00
Sector: Financial Services / Commodity Exchange
Pattern Observed: 🟢 W-Pattern (Double Bottom Breakout)
Candlestick Signal: Strong Bullish Marubozu + Volume Breakout
Strength Rating: ⭐⭐⭐⭐☆ (High-Conviction Bullish Reversal)
________________________________________
🧭 Technical Indicators
The technical indicators on this chart are flashing strong bullish signals. Momentum is clearly positive, supported by a Bullish Marubozu candle, which reflects strong buying pressure and conviction. The chart also indicates a possible breakout formation, confirmed by a strong bullish candle backed by extremely high volume — a classic sign of institutional participation.
Multiple bullish confirmations like swing trade alignment, intraday signal, RSI breakout, and bullish engulfing pattern further add weight to the uptrend. The Bollinger Band breakout and Bullish VWAP suggest sustained price expansion, while the BB Squeeze-Off hints at volatility returning in favor of the bulls. Altogether, these indicators reinforce a buy-on-dip structure with potential for continuation toward higher resistance zones.
MCX is currently trading in the Progressive Zone, indicating a phase of steady upward momentum where buyers are actively accumulating positions. This zone reflects controlled bullish strength and sustained participation, suggesting that the stock is gearing up for a potential breakout continuation.
The KST (Know Sure Thing) indicator for MCX is in bullish territory, confirming the upward momentum seen in price action. With a strong positive crossover and supportive strength reading, the KST reinforces the ongoing uptrend — indicating that momentum remains firmly in favor of the bulls and the stock could continue its northward journey.
MCX is trading between its Swing High at ₹8,439.5 and Swing Low at ₹7,304. The Top Range near ₹9,115 acts as a major resistance zone, while the Bottom Range around ₹7,304 provides strong support, defining a clear bullish structure with room for further upside if momentum sustains.
________________________________________
📊 Trade Setup (Strong Momentum Entry)
Entry: ₹8,748.50
________________________________________
💡 Learning Note
This setup is a textbook example of a W-pattern (Double Bottom) breakout, where price reverses from a downtrend after forming two clear lows at similar levels. The neckline breakout with heavy volume confirms a shift in market sentiment from bearish to bullish. Such patterns highlight how volume expansion and strong breakout candles validate reversal strength and help traders identify early entry points in new uptrends.
________________________________________
⚠️ Disclosure & Disclaimer – Please Read Carefully
The information shared here is meant purely for learning and awareness. It is not a buy or sell recommendation and should not be taken as investment advice. I am not a SEBI-registered investment adviser, and all views expressed are based on personal study, chart patterns, and publicly available market data.
Position Status: No active position in MCX at the time of analysis.
Data Source: Past Chart reference(Historical levels)
Trading—whether in stocks or options—carries risk. Markets can move unexpectedly, and losses can sometimes exceed the money you have invested. Past performance or setups do not guarantee future results.
If you are a beginner, treat this as a learning guide and practice with paper trades before risking real money. If you are experienced, always assess your own risk, position sizing, and strategy suitability before entering trades.
Consult a SEBI-registered financial adviser before making any real trading decision. By engaging with this content, you acknowledge full responsibility for your trades and investments.
________________________________________
💬 Found this useful?
🔼 Give this post a Boost to help more traders discover clean, structured learning.
✍️ Drop your thoughts, questions, or setups in the comments — let’s grow together!
🔁 Share with fellow traders and beginners to spread awareness.
👉 “If you liked this breakdown, follow for more clean, structured setups with discipline at the core.”
🚀 Stay Calm. Stay Clean. Trade With Patience.
Trade Smart | Learn Zones | Be Self-Reliant 📊
________________________________________
Nifty 50 spot 25285.35 by the Daily Chart view - Weekly updateNifty 50 spot 25285.35 by the Daily Chart view - Weekly update
- Support Zone 24875 to 25135 for Nifty Index earlier Resistance Zone
- Rising Support Channel stayed grounded by continued supportive role
- Strong rejection observed at 25430 to 25670 Resistance Zone for Nifty Index
- Falling Resistance Trendline stands ground and Resistance Channel Breakout seems sustained
- Bullish Technical patterns of "W" Double Bottom followed by Rounding Bottom formed around Support Zone