Bikaji Foods cmp 800.05 by Daily Chart viewBikaji Foods cmp 800.05 by Daily Chart view
- Support Zone 774 to 788 Price Band
- Resistance Zone 825 to 840 Price Band
- Pretty closely considerate Bullish Double Bottom formed
- Support Zone seems like going thru testing retesting mode
- Falling Resistance Trendline Breakout seems been attempted
- Price momentum seem respecting the Rising Support Trendlines
- Bullish Rounding Bottoms with Head & Shoulders below Support Zone
- Price Breakout will sustain after closure above Resistance Zone
Double Bottom
Multi-Confirmation Price Action: Fibonacci Zones, Base BreakoutsExplore multi-confirmation techniques using Fibonacci retracement to identify high-probability base breakout zones. Learn how to spot double bottom and inverted head & shoulders patterns at demand levels and execute confirmation trades for precision entries
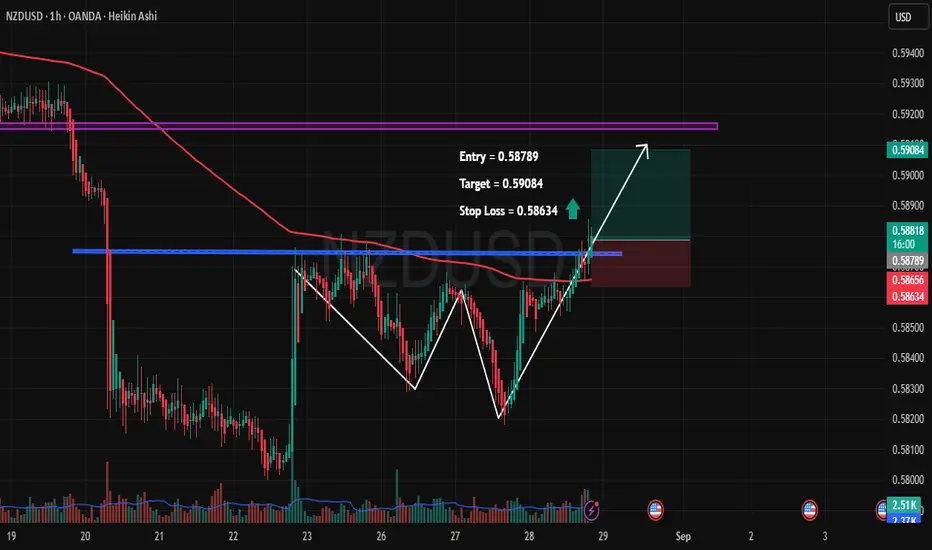
NZDUSD – Breakout Confirmation with Upside Potential🔹 Pair: NZDUSD (1H, Heikin Ashi)
🔹 Entry: 0.58789
🔹 Target: 0.59084 🎯
🔹 Stop Loss: 0.58634 🛑
🔑 Trade Rationale:
✅ Double Bottom Formation – Price respected key support twice, signaling potential reversal.
✅ Breakout Above Resistance – Clean breakout above horizontal resistance (blue line).
✅ 200 EMA Retest – Price is now pushing above the EMA, adding strength to the bullish case.
✅ Volume Spike – Recent surge in buying volume supports the upside move.
📊 Trade Plan:
I’m going long from 0.5878
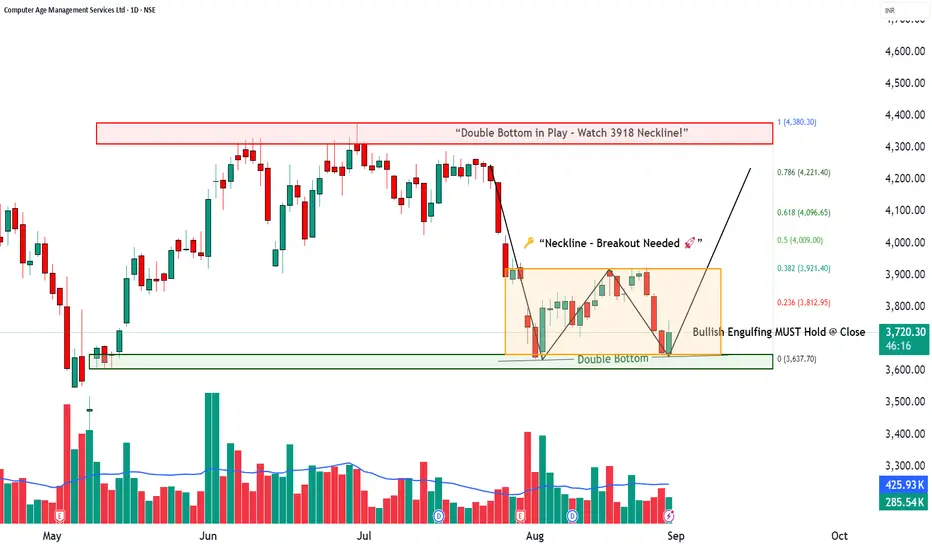
CAMS | Reversal in Sight? How to Trade a Double Bottom📈 CAMS | How to Trade a Double Bottom
Stock: Computer Age Management Services Ltd (CAMS)
Timeframe: Daily
Pattern: Possible Double Bottom (bullish reversal structure)
________________________________________
🔹 Pattern Identification
Bottom-1: 3632.40
Bottom-2: 3645
Neckline (Breakout Point): 3918
Candle Confirmation: Bullish Engulfing/Piercing on the second bottom
Volume: Improving on bounce, needs stronger confirmation on breakout
________________________________________
📘 Regular Trading Strat
COLPAL | Double Bottom Retest + Volume Breakout🚀 COLPAL | Double Bottom Retest + Volume Breakout
📌 Pattern Setup:
🔹 Double Bottom retest spotted
🔹 Bullish Engulfing candle at support
🔹 Breakout candle with strong volume surge
📊 Technical Snapshot:
RSI: 58 → Healthy momentum
MACD: Bullish crossover
CCI: 107 → Strong positive bias
Stochastic: 89 → Overbought but strong
Volume: 1.22M vs 626k avg → ⚡ Breakout confirmed
🛠 Levels to Watch:
🔼 Long Entry: Above 2357.9
🔽 Stoploss: Below 2243
🎯 Targets: 2472 | 2587
📉 Pullback Buy Zone: 2291–2273
❌
ECLERX SKYROCKETS 35%! This Pattern Signals ₹4,200 TargetNSE:ECLERX SKYROCKETS 35%, Made a Beautiful Chart Structure to Qualify for the Chart of the Week
Price Action:
- It experienced a powerful rally from ₹2,200 to ₹3,877 (all-time high) between July and October 2024
- Recent correction formed a descending wedge pattern from October 2024 to early May 2025
- Currently showing an explosive breakout at ₹3,301.80, up ₹852.40 (+34.80%) in this Week.
- Massive single-week gain with a long bullish candle breaking above both resistance levels and the d
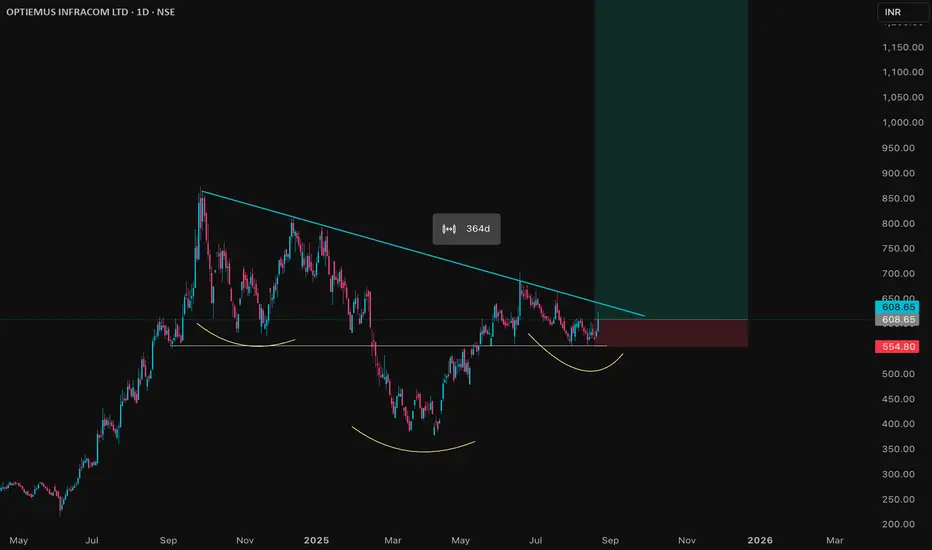
OPTIEMUS Price ActionOptiemus Infracom Limited (OPTIEMUS) is currently trading around ₹608 as of August 2025. The stock has shown a strong recent performance, gaining approximately 4% in the latest trading sessions, with daily price ranges between ₹585 and ₹625.
Over the past year, the stock price has fluctuated substantially, with a 52-week low near ₹378 and a high nearing ₹874. The current price sits closer to the mid-to-upper end of this range, indicating a recovery from lows but still beneath recent highs.
Fi
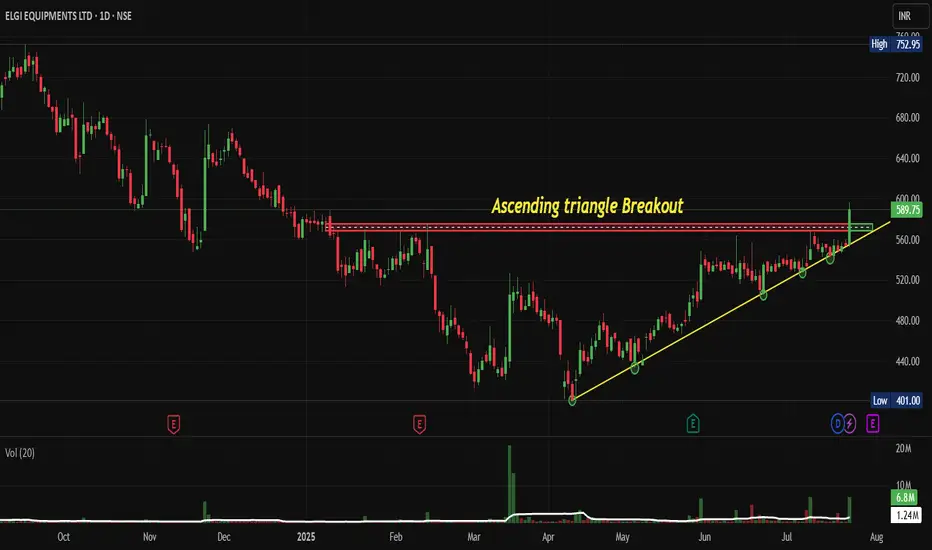
ELGIEQUIP: Breaks Out of its Ascending Triangle PatternNSE:ELGIEQUIP Breaks Out of its Ascending Triangle Pattern: This Industrial Giant Could Be Your Next Multi-Bagger as Manufacturing Boom Accelerates
Price Action:
- Current Price: ₹589.75 (as of chart date)
- 52-Week High: ₹752.95
- 52-Week Low: ₹401.00
- Daily Change: +₹35.95 (+6.41%)
- Market Cap: ₹18,703 Cr.
Volume Spread Analysis:
Volume Profile Assessment:
- Breakout Volume: 6.8M shares (significantly above average)
- Volume Trend: Increasing volume during breakout phase
- Volume-P
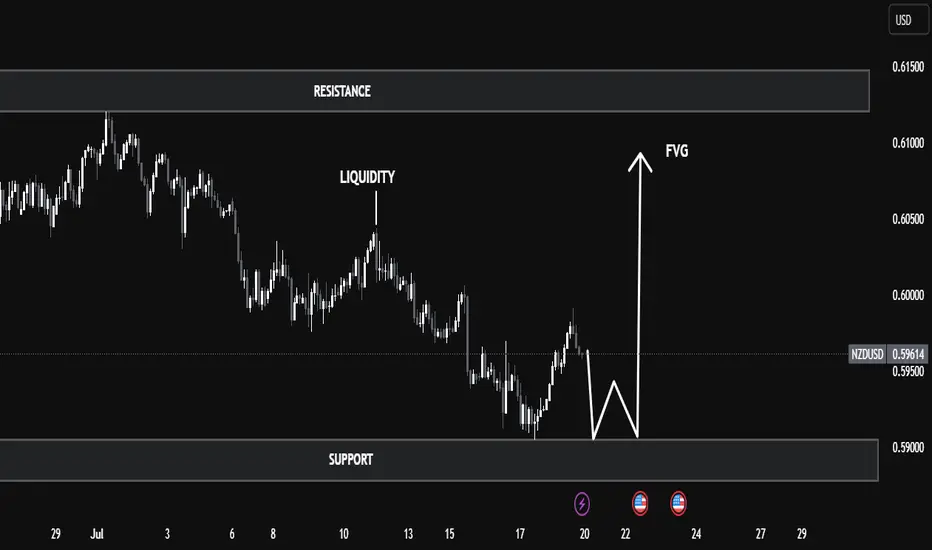
NZD/USD Technical Analysis 🧠 NZD/USD Technical Analysis | Smart Money Perspective
Currently, the NZD/USD pair is trading around 0.5960, positioned between a well-defined resistance zone (0.6130–0.6150) and a support zone (0.5890–0.5900).
Here are the key technical aspects to note:
🔹 1. Liquidity Sweep
The price recently dipped below the previous swing low near 0.5900, tapping into a pool of sell-side liquidity. This move is typically seen as a liquidity grab, where institutional players push the price to trigger ret
Eve-Adam Pattern Forming? A Rare Double Bottom Pattern Explained📉 Pattern Study (Not a Buy/Sell Tip/Not Forecasting anything)
On the weekly chart of Mamata Machinery Ltd, we’re potentially witnessing a classic yet uncommon pattern — the Eve-Adam Double Bottom.
🔍 What is the Eve-Adam pattern?
🧑🦰 Eve Bottom: Broad, rounded, and forms slowly with increased volume — showing gradual accumulation.
👦 Adam Bottom: Sharp, V-shaped recovery with relatively lower volume — a quick retest signaling renewed demand.
📈 What makes this setup notable?
-A clear Eve structu
MAZDOCK – TECHNICAL ANALYSIS - W PATTERN________________________________________________________________________________
📈 MAZDOCK – TECHNICAL ANALYSIS
📆 Date: July 4, 2025 | ⏱ Timeframe: Daily Chart
🔍 Educational Breakdown – For Learning & Study Use Only
________________________________________________________________________________
🔹 Price Action Zones
• 🔴 Top Range: 3775
• Resistance: 3362 – 3396 – 3423
• 🟢 Bottom Range: 3077.7
• Support: 3241 – 3274 – 3301
_______________________________________________________________________
NIFTY Weekly Chart – Double Bottom Breakout Analysis📌 NIFTY Weekly Chart – Double Bottom Breakout Analysis
After a long corrective phase, NIFTY is forming a classic Double Bottom pattern on the weekly timeframe. This is typically a bullish reversal signal.
✅ Pattern: Double Bottom on Weekly Chart
✅ Bottom Levels: ~21,800
✅ Neckline Resistance: ~26,200
📈 Breakout Strategy:
Watch for a weekly close above 26,200 with higher volume to confirm breakout strength.
✅ Measured Move Target: ~30,600
Calculation: Neckline + (Neckline – Bottom) ≈ 26,200
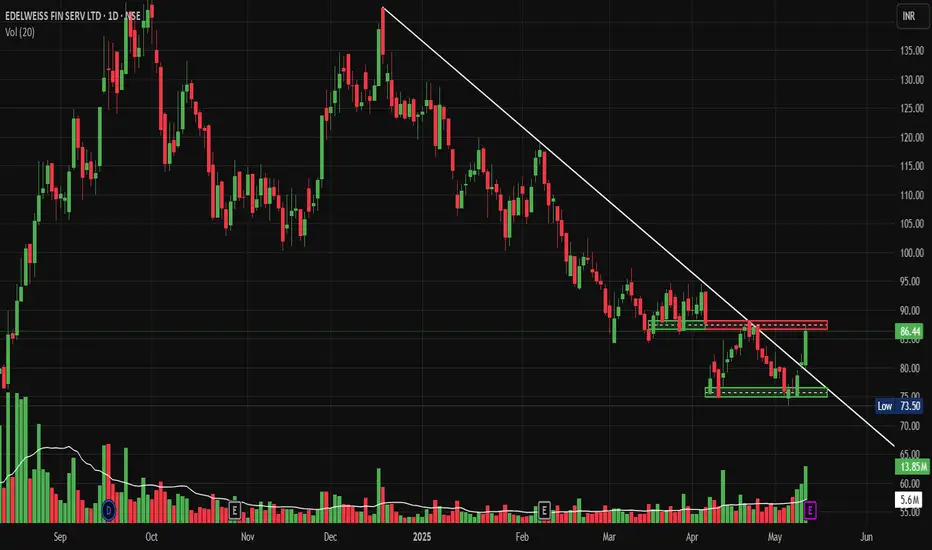
Edelweiss - Double Bottom Reversal PatternNSE:EDELWEISS Made Beautiful Chart Structure today Before Q4 Results with Good Price and Volume action.
Today's Price Action:
- The stock has been in a clear downtrend since December 2024, forming a descending resistance line (white trendline)
- Recently broke above this major downtrend line with strong momentum
- Current price at ₹86.44, up 5.50 points (+6.80%) in today's session
- The stock appears to have formed a Double bottom Pattern around the ₹75 levels, confirming a potential reversa
Dhani BO: Ready for Its Next Rally After 80% Correction?NSE:DHANI Breakout: Is This Med/Fin Tech Stock Ready for Its Next Rally After 80% Correction?
Price Action Overview:
- Stock has undergone a significant correction from highs of ₹109.88 to lows of ₹47.05, representing nearly a 57% decline
- Currently trading at ₹71.09 with recent bullish momentum showing +14.42% gains
- Price action suggests a potential bottoming process after prolonged consolidation
Volume Spread Analysis:
- Significant volume spikes observed during major price movements
DLong
RKF Massive Breakout After 6-Month Consolidation.NSE:RKFORGE Hidden Auto Component Gem Ready for Massive Breakout After 6-Month Consolidation, after Breaking out Today With King Candle and Volumes.
Price Action:
- Current Price: ₹656.75 (+9.37% gain)
- Trading Range: ₹553.00 - ₹1,020.00
- Market Cap Category: Mid-cap stock with decent liquidity
- Chart Pattern: Extended consolidation phase with recent breakout attempt
Support and Resistance Levels
- Primary Resistance: ₹760-780 zone (red horizontal line)
- Secondary Resistance: ₹1,020 (
Double Bottom but Failed Breakout Retest | Daily Time Frame📉 OBEROI REALTY LTD – Double Bottom but Failed Breakout Retest
📅 Date: April 28, 2025
📈 Timeframe: Daily Chart
🔍 Stock: Oberoi Realty Ltd (NSE)
📌 Technical Overview:
A Double Bottom pattern was formed indicating bullish reversal potential.
Price attempted a breakout above the neckline near ₹1704.25, but the retest failed — price could not sustain above the breakout zone.
Price is currently trading at ₹1656.80, under the trendline support.
🧩 Key Observations:
✅ Double bottom structure was conf
Knowledge Marine & Engineering WorksThe long-term financing plan for the maritime industry was presented by Union Finance Minister Nirmala Sitharaman on February 1, 2025.
As informed, the Government of India will contribute up to 49 percent to the fund, with the private sector, port authorities, financial institutions and other government entities covering the remainder of the sum. The financial assistance will be provided via equity or debt securities, according to the government.
Objectives of the new fund are:
Development of
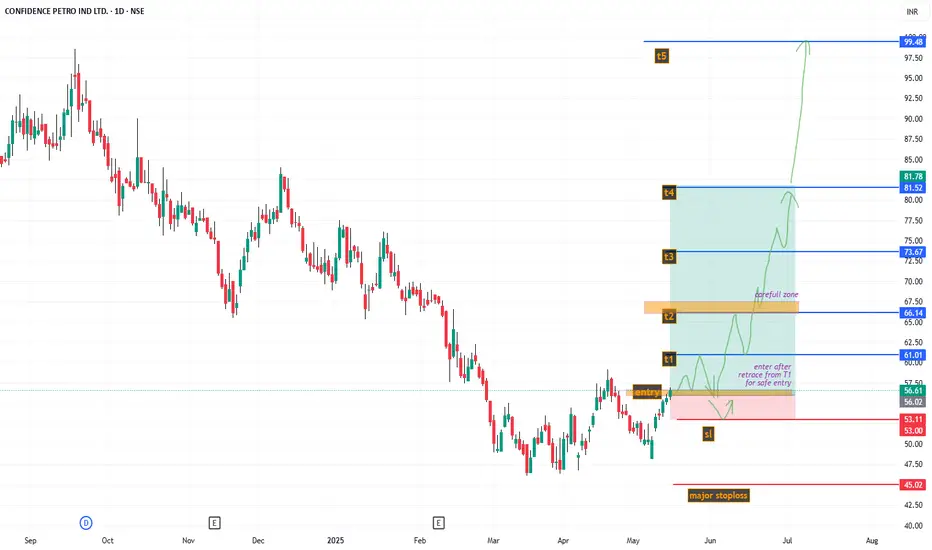
Confidence Petrol ltd., Looking good ; min 50% Roi ; swingFor short term investment ;
Leave a " Like If you agree " .👍
.
Wait for small retracement & daily candle to close above - "57.50" .
Trade carefully untill ENTRY level.
.
Entry: 57.5
Target: 61-66-73-81
sl: 53
major stoploss/ support: 44.5.
.
Enter only if market Breaks and retrace and support above
"Yellow box" mentioned.
.
.
Don't make complicated trade set-up.📈📉
Keep it " simple, focus on consistency "💹
Refer our old ideas for accuracy rate🧑💻
Follow for daily updates👍
.
Refer old post
Gabriel India -Double Bottom Breakout!📊 Gabriel India - Positional Breakout Trade
🔍 Technical Overview:
✅ Trend: Strong uptrend, followed by a 32% correction and a double bottom formation .
✅ Breakout Confirmation: Cleared ₹565 resistance with strong volume.
✅ Key Levels:
Entry: Above ₹600 (Earlier breakout was at ₹565)
Stop Loss: ₹475 (Closing basis) 🔻
Positional Target: ₹824 (Tentative) 🎯
✅ Moving Averages: Trading above key DMAs, indicating strength.
✅ Market Condition: Stock is breaking out early as markets show signs of re
UNIONBANK – Positional Breakout SetupPattern: Double Bottom | W Pattern Inside Channel
Trend: HH-HL Structure | Trading Inside Ascending Channel
Volume: Noticeable Build-Up
DMAs: Trading Above Key DMAs
Stage: Aiming for Stage 2 Breakout
The stock is forming a double bottom (W pattern) inside a well-respected ascending channel, with a clean higher high–higher low structure and visible volume build-up. It's now trading above key DMAs, hinting at underlying strength. With price approaching a key breakout zone, it looks primed for a