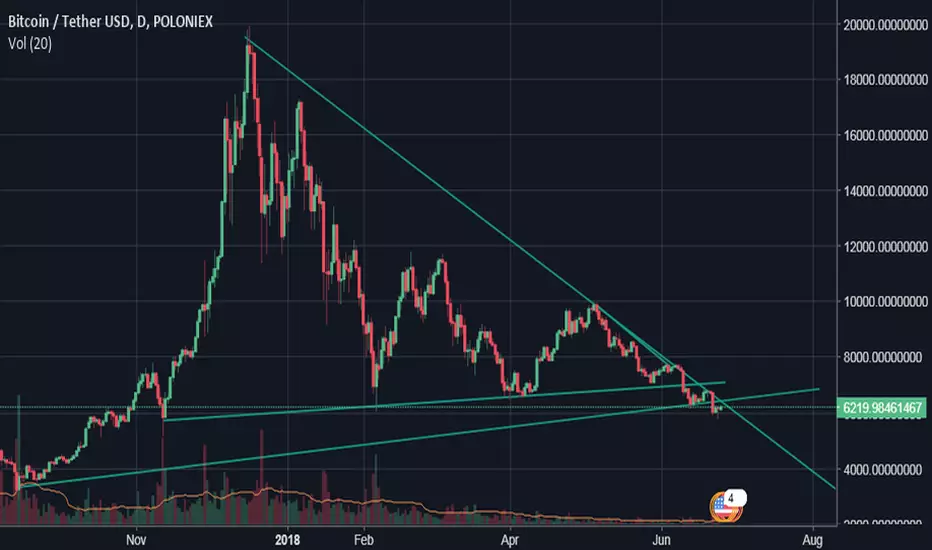
Double Bottom
SREI Infra short term viewRefer chart. Double bottom formation going on. Consider to buy, after formation done.
Vijayaraghavan,
Kovilpatti
SLong
Oil Marketing Companies (OMCs) – Bottom in place?The Bear onslaught on Oil Marketing Companies (OMCs) has been going on for a long time now.
However, with Crude starting to come down we may see some buying interest coming back to these stocks.
Rupee is also at one of the lowest levels against Dollar, so a bounce back there may further help cut Oil Marketing Companies’ Losses.
I can see the price making a lower bottom here with rising RSI showing a positive Divergence.
Good opportunity to buy HPCL NSE:HINDPETRO with a small stop loss for a first target around 327 levels.
Similar structure can be observed for other stocks like BPCL and IOC.
Disclaimer: Views expressed here are my own, and should not be interpreted as an Investment Advice. Please consult your Financial Advisor for investments.
Coal India – Double BottomCoal India NSE:COALINDIA has reversed sharply from strong support zone between 260 – 265 levels.
To me it looks like a double bottom formation with positive divergence.
Good opportunity to go long with stop loss a few points below the double bottom lows and first target near 290 levels.
Disclaimer: Views expressed here are my own, and should not be interpreted as an Investment Advice. Please consult your Financial Advisor for investments.
Infratel - Double BottomBharti Infratel NSE:INFRATEL stock is doing good for the past few days in a falling market and has shown a sharp reversal from the 308-311 support zone.
I can see a double bottom formation here with a positive divergence.
Good opportunity to buy this stock for the near term with a target of around 350 and stop loss a few points below 308.
Disclaimer: Views expressed here are my own, and should not be interpreted as an Investment Advice. Please consult your Financial Advisor for investments.
ILong
Lupin – Double BottomLupin NSE:LUPIN came up with better than expected numbers (operational performance) yesterday and the stock saw good buying activity today.
I can see a double bottom formation here with a positive divergence along with today’s bullish candle.
Good opportunity to go long with a stop loss near ~ 720 levels and first target of around 815.
Disclaimer: Views expressed here are my own, and should not be interpreted as an Investment Advice. Please consult your Financial Advisor for investments.
Gelnmark – Double BottomAs mentioned yesterday, a reversal in pharma seems around the corner.
The stock has formed a good Double bottom with divergence and a large Bullish candle indicating that Buying Momentum is picking up.
Good opportunity to go long with a stop loss near ~ 500 levels for a target of ~ 582.
(However, keep an eye on the results)
Disclaimer: Views expressed here are my own, and should not be interpreted as an Investment Advice. Please consult your Financial Advisor for investments.
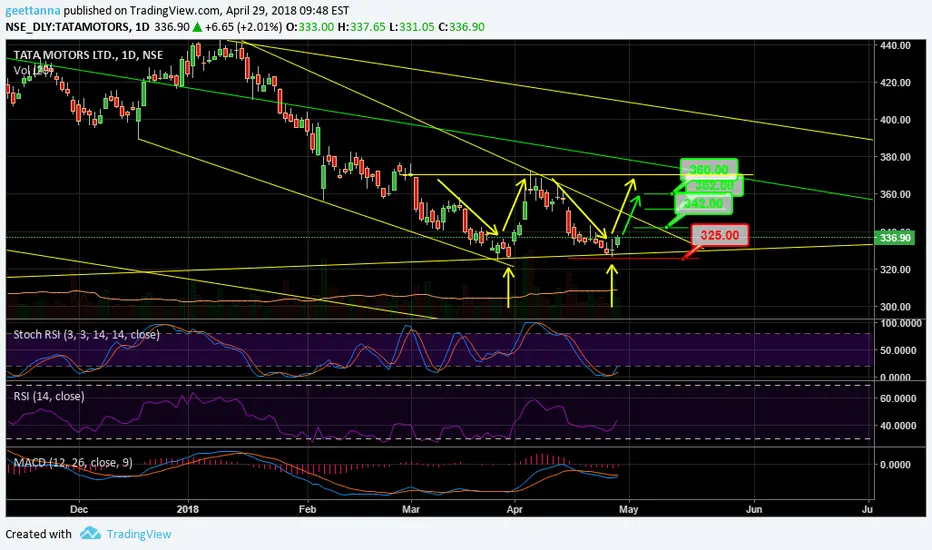
Tata Motors - LongTata Motors has been on a bearish run since 2017 correcting from 550 levels, nearly 40%. The stock has taken support on the major trend line which it has been following since 2011. The stock had seen bounce back from the same trend line at 326 levels in April and has seen similar bounce at same levels. One can go long with Target of 342/352/360, Keeping Stop Loss at 325.
The stock is also seen forming a double bottom formation which can take the stock to 370 before reversal or break out. Break Out can further take the price around 399/400 levels.
Amaraja batteries short term viewPls see the chart for target and stoploss. Indicators are slightly turns positive.
Vijayaraghavan,
Kovilpatti.
ALong
Godfryphlp short and mid term viewPls see the chart. Wedge pattern breakout given on the chart for that target 1&2 given. Double bottom will confirm, when it breaks the 913 levls for that target given on the chart. Weekly MACD cut and daily MACD crossover helps to reach the target and weekly low RSI and CCI helps to reach the mid term target.
Vijayaraghavan
Kovilpatti.
ZEEL going through Double Bottom patternNSE:ZEEL is going through a double bottom pattern. Double Bottom is a bullish trend reversal chart pattern formed after good bearish price move. MACD (15,50,9) as well as Stochastic Bullish divergence both are giving a buy signal as well.
Go Long for a target of 597(t1) & 618(t2). Maintain a Stoploss of 558 (SL).
Ganesh Housing Corporation Ltd There are 2 patterns in the chartTechnical : There are 2 patterns in the chart for 1hr
KEEP AN EYE ON
Chart Pattern
1. Flag pattern
2. Double Bottom Reversal
3. RSI Divergence
The breakout was confirmed on 12/11/2018 11:15am Candle @183
Technical Target : 207
Fundamentals :
(Fundamental Medium Term Target 250)
(Fundamental Long Term Target 300)
1.Total (Mkt. Cap) : 899cr
2.Debt : 0.28cr
3.Stock PE : 23.50
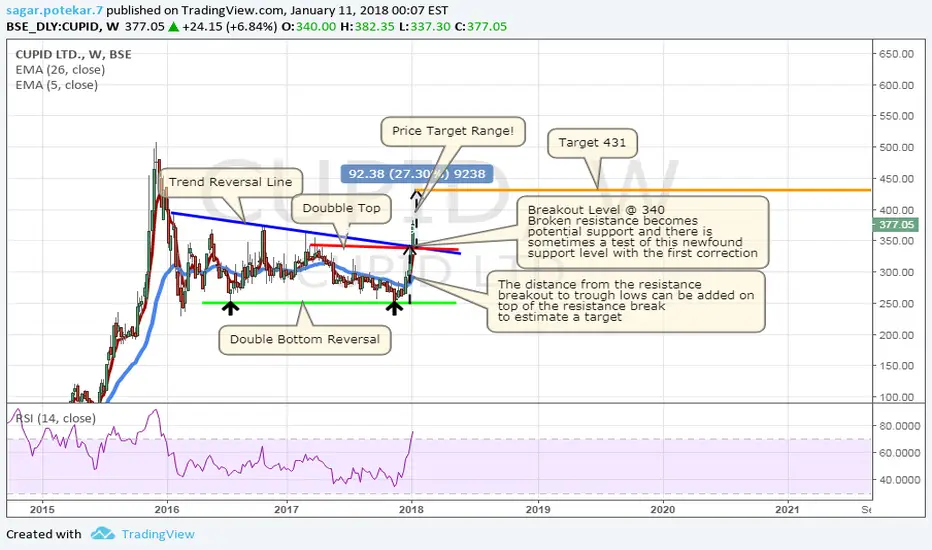
Cupid Ltd! Double Bottom Reversal (Weekly Chart) Technical : Double Bottom Reversal Chart Pattern (Weekly Chart)
Trend reversal line And Double Top Breakout @ 340
Technical Target : 431
Fundamentals :
(Fundamental Medium Term Target 500)
(Fundamental Long Term Target 600)
1.Total (Mkt. Cap) : 418cr
2.Zero Debt : 0.00cr
3.Stock PE : 18.40