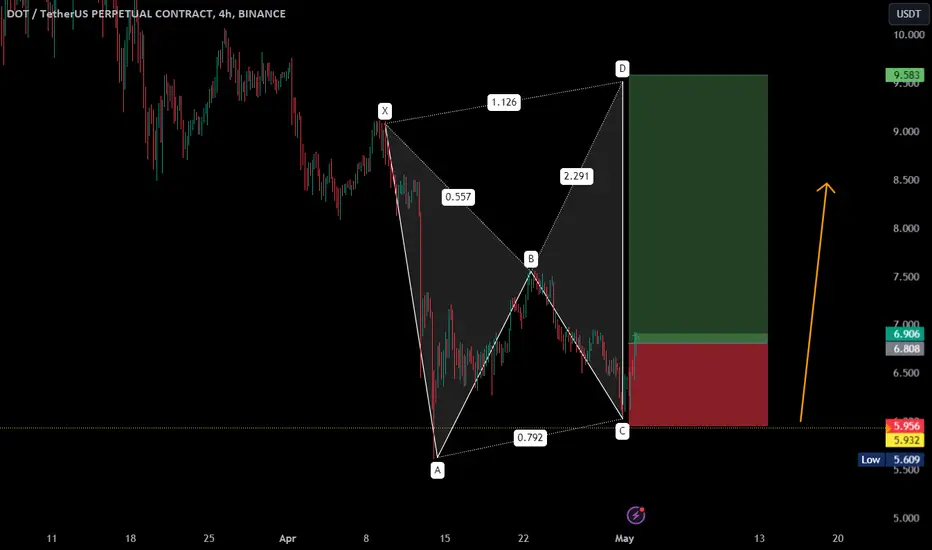
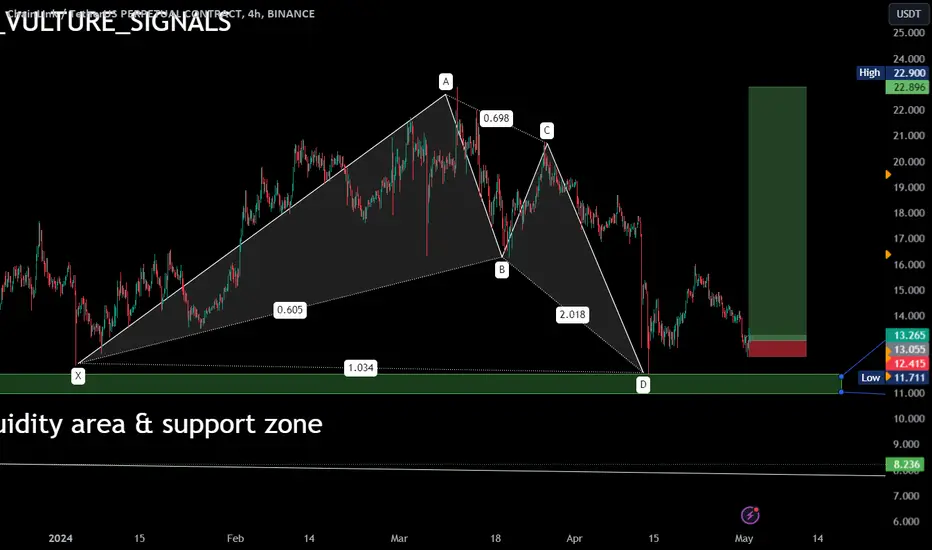
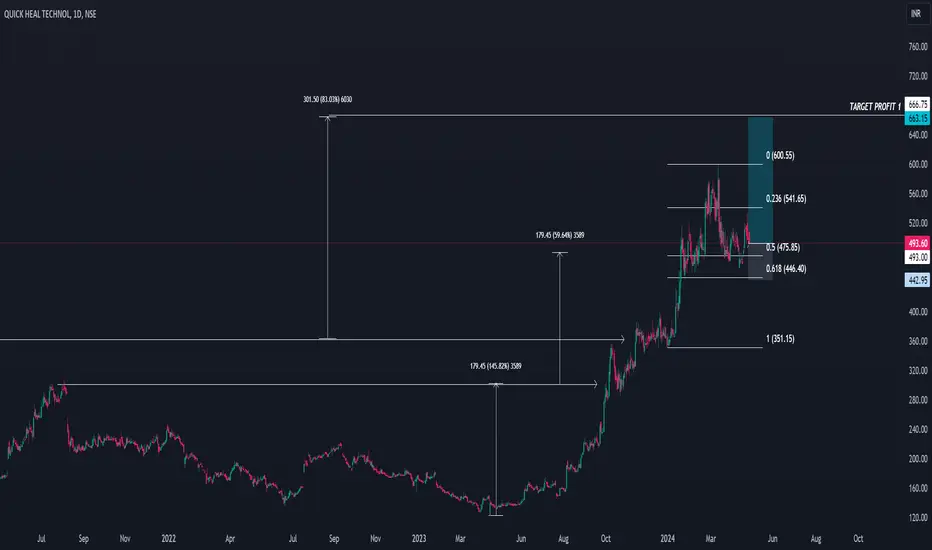
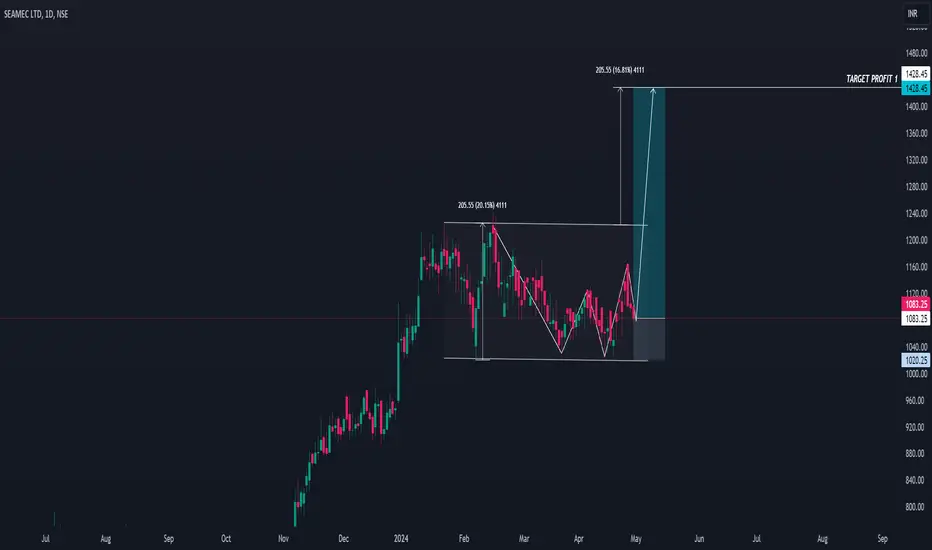
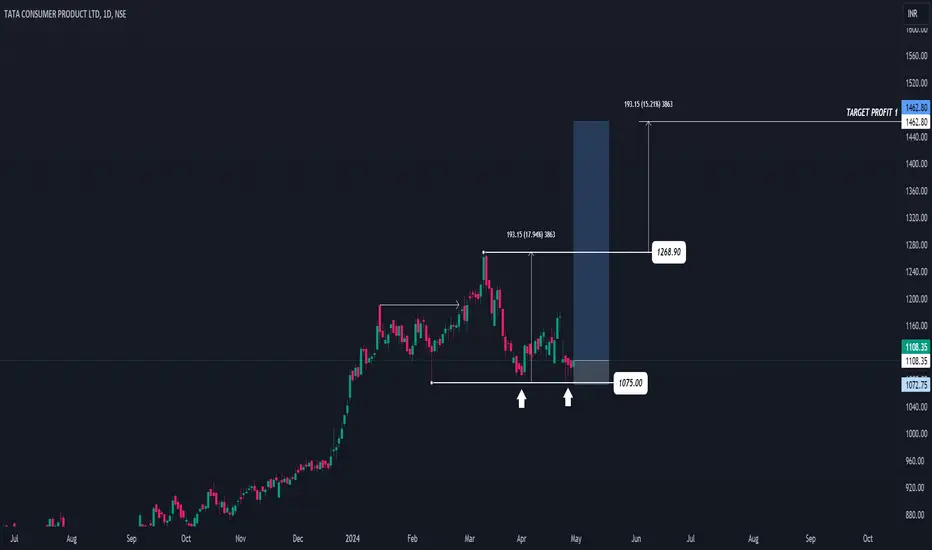
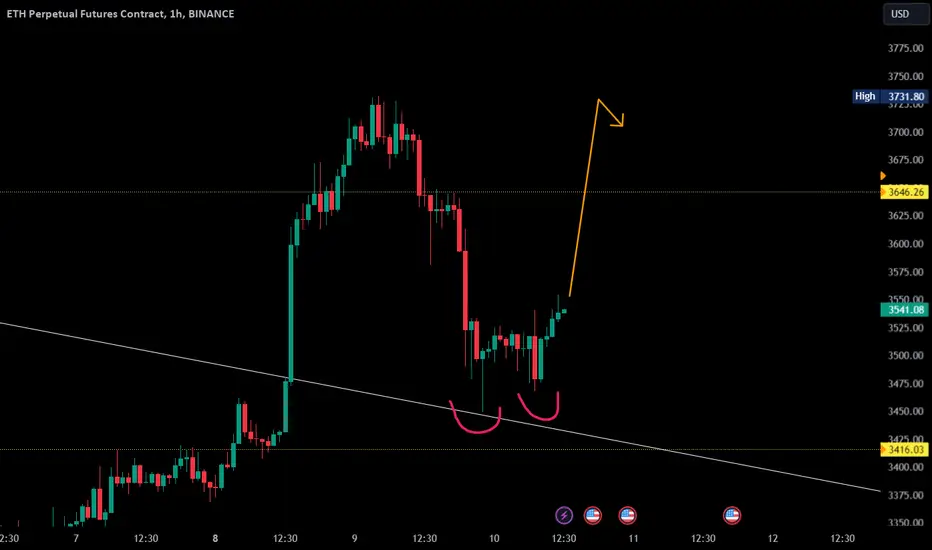
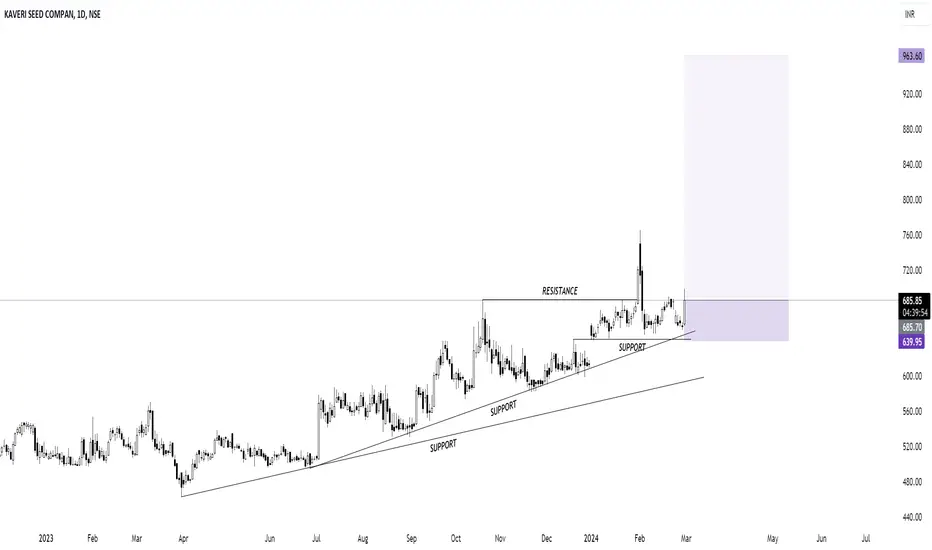
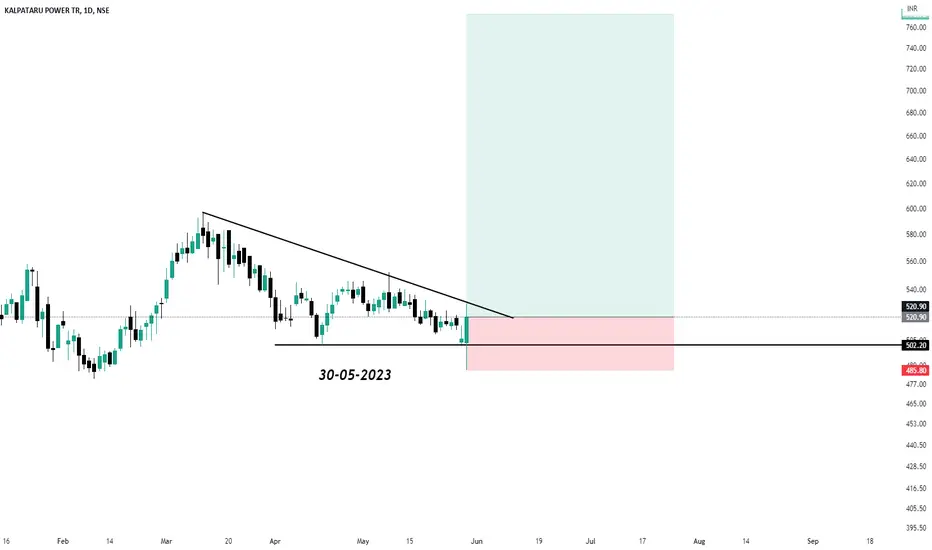
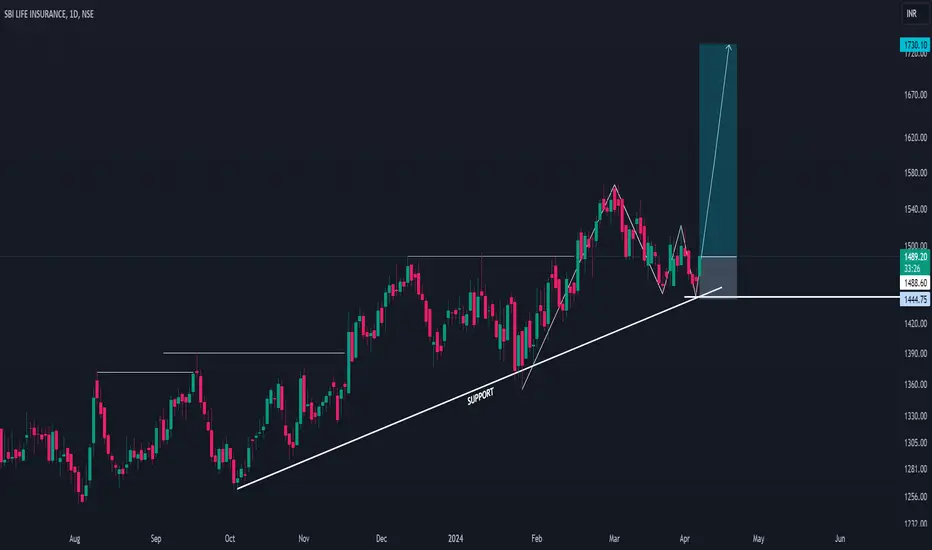
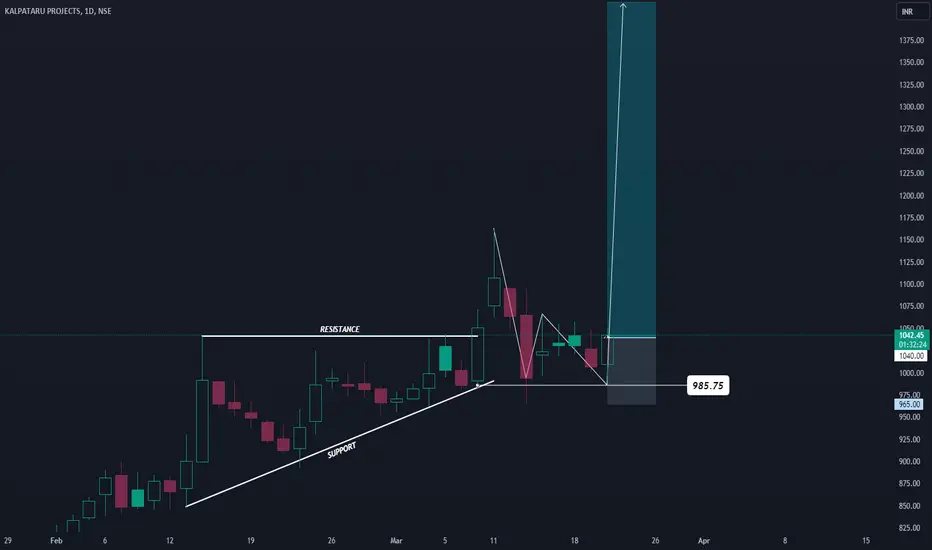
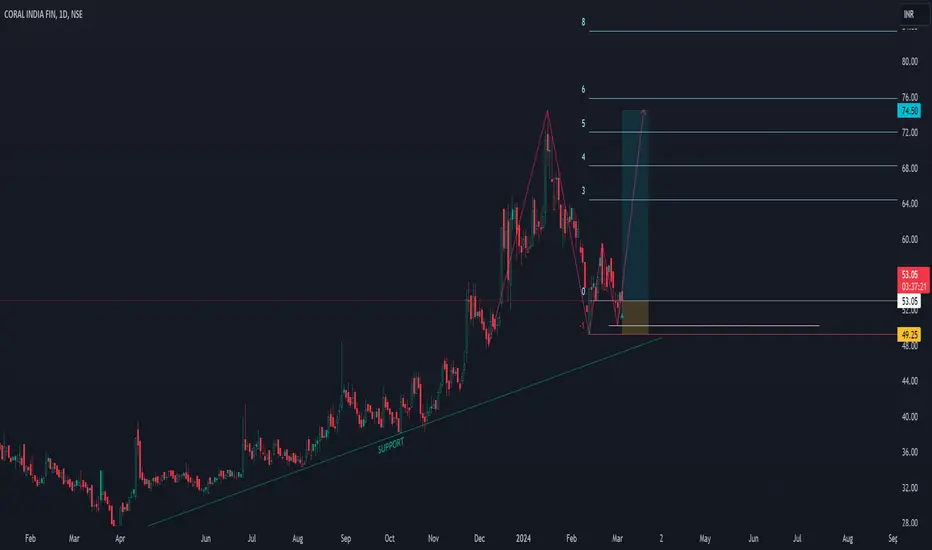
Double Bottom
#LINK/USDT FORMED DOUBLE BOTTOM PATTERN #LINK/USDT has recently shown a bullish shark and double bottom pattern, indicating a potential uptrend. The price has bounced from the buy liquidity support area at $11.5, suggesting a strong level of buying interest at that price point. This could signal a reversal in the current downtrend and a possible move towards higher price levels.
Banking Stock - Keep An Eye - BANKBARODA📊 Script: BANKBARODA
📊 Sector: Banks
📊 Industry: Banks - Public Sector
Key highlights: 💡⚡
📈 Script has given breakout of Double Bottom pattern but didn't sustain keep an eye on it we may see good rally.
📈 One can go for Swing Trade above 284.
BUY ONLY ABOVE 284
⏱️ C.M.P 📑💰- 281
🟢 Target 🎯🏆 - 311
⚠️ Important: Always maintain your Risk & Reward Ratio.
✅Like and follow to never miss a new idea!✅
Disclaimer: I am not SEBI Registered Advisor. My posts are purely for training and educational p
DOUBLE BOTTOM ANALYSIS APCOTEXINFD 04-10-2024BUY : 463 TO 400
TARGET : 667 TO 681
Reason For Buying This Script :
In this script it has formed double bottom and it is d called as ABCD pattern in monthly time frame. One neckline barker and close above 562 and the next target up to 667.
Note :
Above given levels are based on monthly & weekly time frame . So be patience it will take some months to achieve the target.
BITCOIN into Bullish Flag SignalAs per 4-hr. chart Analysis,
#Bitcoin movement starts again into #BullishFlag Pattern after finished of Double Bottom "W-Pattern". Now CRYPTOCAP:BTC next Target towards $80k before #Halving, and many chances to reach out around $75k to FWB:77K upto this weekend.
Lets see, what's happen next,
But, Trade wisely by using #StoppLoss and always #DYOR
As well..
LIKE COMMENT SHARE those given charts...
BITCOIN on Double Bottom - W PatternAs per hourly charts,
from last 4-5 days, #BITCOIN and complete #Crypto market moving as per market many scenario's of news and sentiments including india's #FUD of #OKX closed down their services as well another great news with #Kucoin exchange starts complete services in india.
Now as per that scenario, CRYPTOCAP:BTC #HeadAndShoulder pattern is not completed its final cycle but it moving towards now for Double Bottom "W" Pattern to completing soon, and as per that scenario it will be again
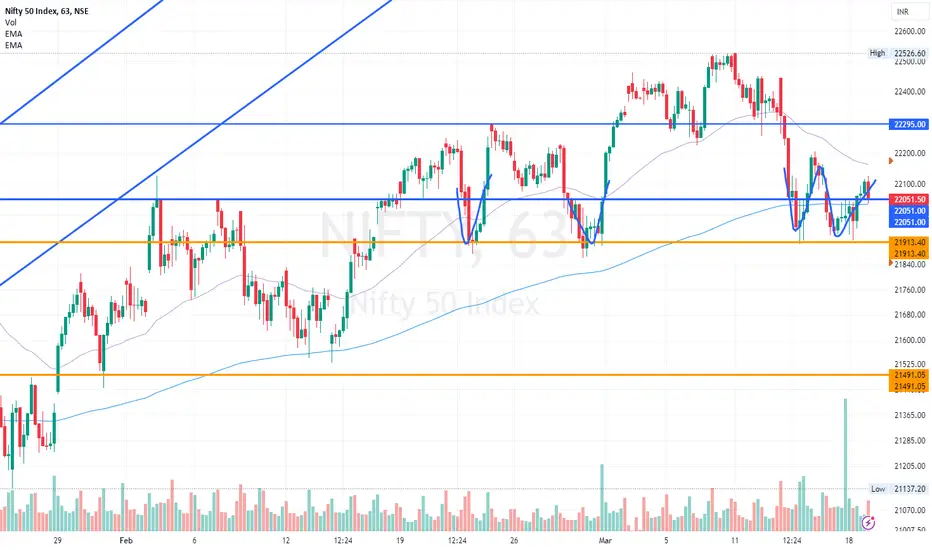
18 Mar ’24 — Is Nifty above or below 22051? Check Chart closelyNifty Analysis - Stance Bearish⬇️
Recap from yesterday: “The only reason we pushed through the resistance yesterday was because of NiftyIT. And today NiftyIT started with cuts of -0.9%. Do you agree with me now that the main villain is NiftyIT which is preventing Nifty50 for a smooth directional trend?”
4mts chart
Is Nifty above or below 22051? I must change the stance from bearish to neutral if it's above. If it's below - then the bearishness continues. As per the chart, Nifty closed at 220