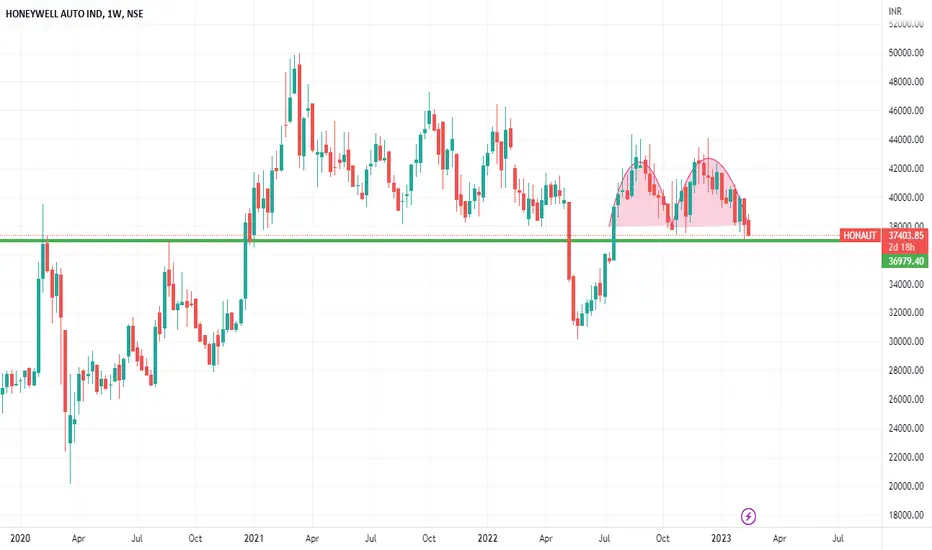
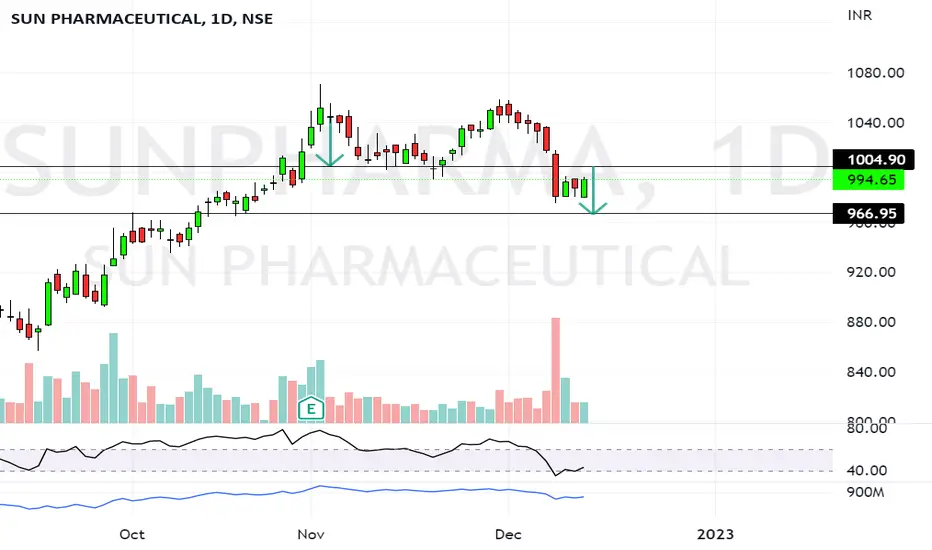
ASIANPAINT IN BEARS BRUSH ???!!!Chart does insist me the above titled opinion
Reasons
In Monthly timeframe, Asian paints looks like, is in formation of a DOUBLE TOP!!! ( Making HIGH(Jan 2022)and LOWER HIGH(Sep 2022) respectively)
(shown as image attached in the chart)
1. Asian paints has been travelling in Ascending channel pattern(red and green) taking support at respective levels from 2019.
2. Now currently its is in the down swing in a descending channel(white trendlines).
3. January 2023 Monthly candle - going to be the decider for further move.(if it closes below 2900- we can confirm the bearishness further)
4. In daily time frame, it has formed a Head & Shoulders pattern and given BREAKDOWN!!!
5. By H&S pattern, Target gets to about 200 points(to 2850 level).
6. Green line down near 2900 is acting as support from 2020.
7. DOUBLE TOP (Monthly timeframe) will mostly likely be confirmed if the Green line gets broken.
8. Let's wait and watch whether the monthly candle breaks the green line or not!!!
Asian paints is one of the stocks which has not reached the 52 week high (during recent rally of market)!!!
Take SL as day candle closing out of the white channel.(3090) & Keep Trailing the SL!!
1st Target - 2900,
will update once it reaches this target.
If the Double top works as it does, Asian paints can see 2250 level soon.
Even if we don't trade now, It is better if we don't make any long term investment on Asian paints as of now.(as it is bearish)
Let's wait and watch how it moves!!! What this is going to teach us!!!
Note : Just sharing my view.....Not a Tip nor Advice!!!
Double Top
HCLTECH Rounding TopSell HCLTECH closing 1094.85 with 1130 then targets are 1065-1020.
Selling Reasong.
1 --> Create Double Top On TOP.
2 --> Rounding Top Form On TOP.
3 --> Break the Trendline.
4 --> Trendline is also Ready to break the 40.
5 --> ADX is show the Bearish move and -DMI is rise.
6 --> Volume is also show the Bearish Move.
HDFC Bank SMC Patterns Short Opportunity --------------------------------------DISCLIMER--------------------------------------------------
* All the information shared in this chart is provided for strictly educational purposes only.
* This chart is sharing information are based on the theory of technical analysis .
* This is not an offer to buy or sell stocks, futures , options, commodity, forex, interests or any other trading security.
* Back test yourself before jump into live market consult your financial adviser and use proper risk management.
------------------------------------------
HDFC Bank Level's
------------------------------------------
4Hr TF Double top with Rejection Candle
Resistance-- 1665/16670
(Target) Support -- 1648/1633/1608/1586
Trade : Sell at 1665 SL 1672 ( 7-8 Points SL)
Target will be : T1- 1648 / T2 - 1633 / T3 - 1608 / T4 - 1586
--------------------------------------------------------------------------------------------------------------------------------------------------------------------------
We are not a financial advisor and you should not construe any information discussed herein to constitute investment advice
This only for study purpose.
--------------------------------------------------------------------------------------------------------------------------------------------------------------------------
Thank you
Trading Cafe 24
Double top in PEL ???!!!Chart clearly depicts the pattern.
PEL - Primary trend is Bearish.
Double top - with 2nd top having high lower than the 1st top .
Previously there was a double bottom like formation, but the 2nd bottom low was lower than the 1st bottom's low.
Let's see whether this double top works or not !!!!
Entry only after the breakdown of the white dashed trendline..
Target about 80 points according to double top pattern.(760 level)
SL above the high of the breakdown candle...(only closing price)
Note - Just sharing my view....not a tip nor advice!!!!
PShort
Dogecoin short-Double top formingDogecoin is forming a double top in 15m/1h time frame.A short trade can be initiated on breakout and may reach to the levels that has shown in chart.keep an eye.
Also,I know I am just posting very few in a month,but I try to post only some quality trades.So,please keep patience.But I will post frequently on other markets too from the upcoming year. Thank you.
Dogecoin short-Multiple trade setupDogecoin is forming some bearish trade setup these days.It may give us some great fall after the breakout.Here are two trade ideas-swing and intraday that I wanna share with you guys in detail.check below.
Trade 1: The first one is a swing trade.Dogecoin made a beautiful double top pattern in 1H time frame which broke out it's neckline(0.9684 level) downward and now is retesting from a lower level (0.09274) on a trendline.It is now at the breakout point of the trendline and if it breaks,a short trade can be initiated to the support level of 0.08012. You might have hold it for some days.keep an eye.
Trade 2:It's an intraday.A bearish pennant is made on 15m/1h time frame and about to break out.It can break downward to the level of 0.08894.if it breaks the pattern,a short trade could be taken there.follow the levels.
Make it happen,get some good profits.Happy Trading.