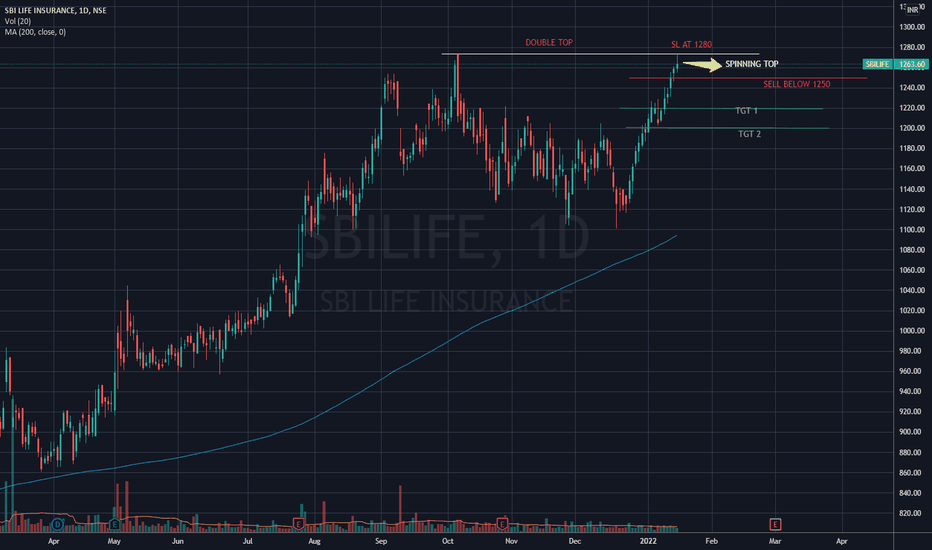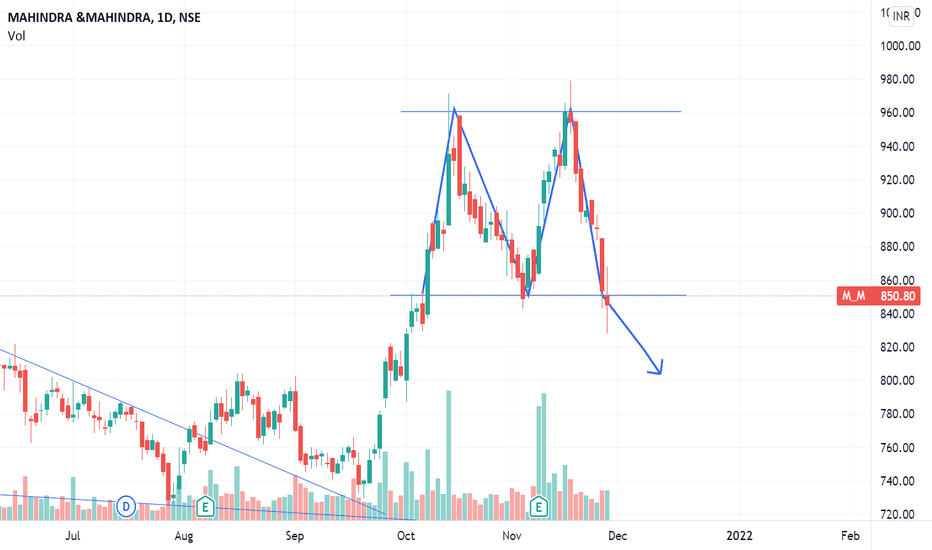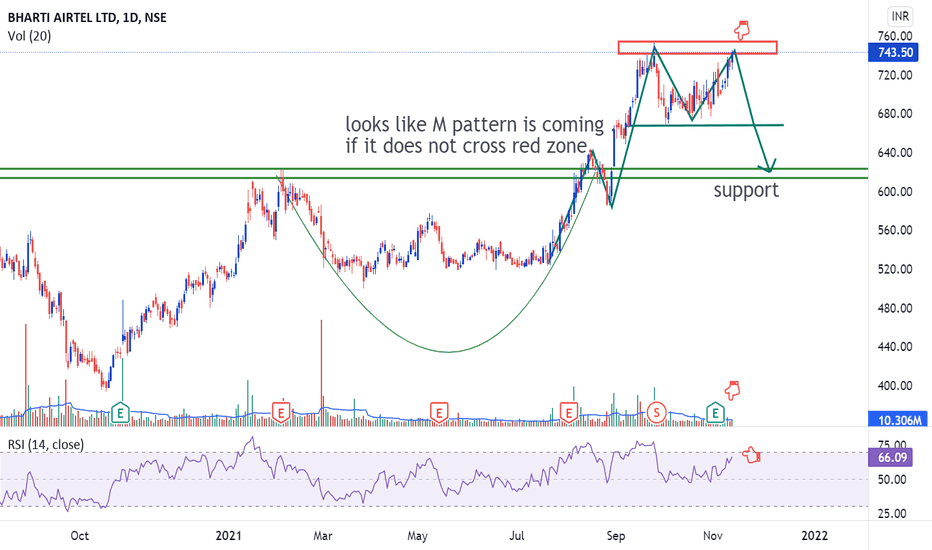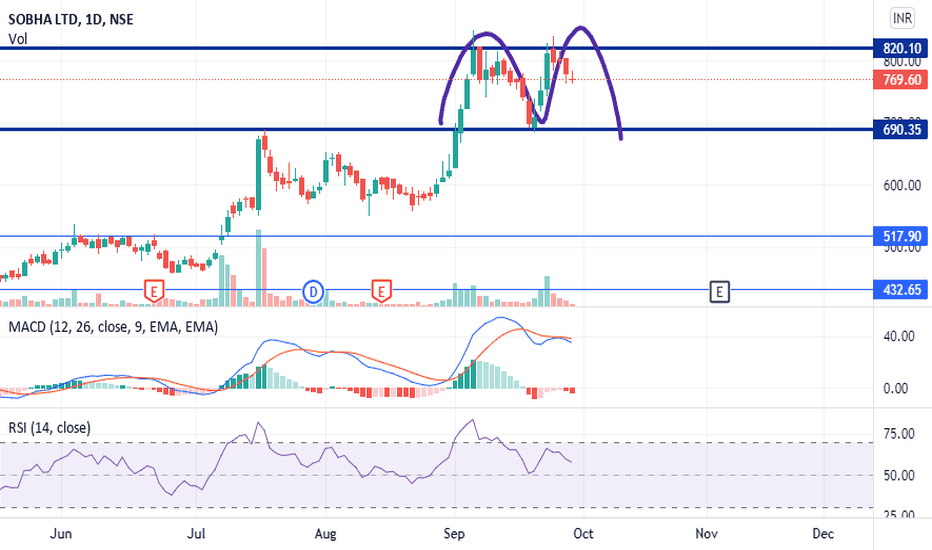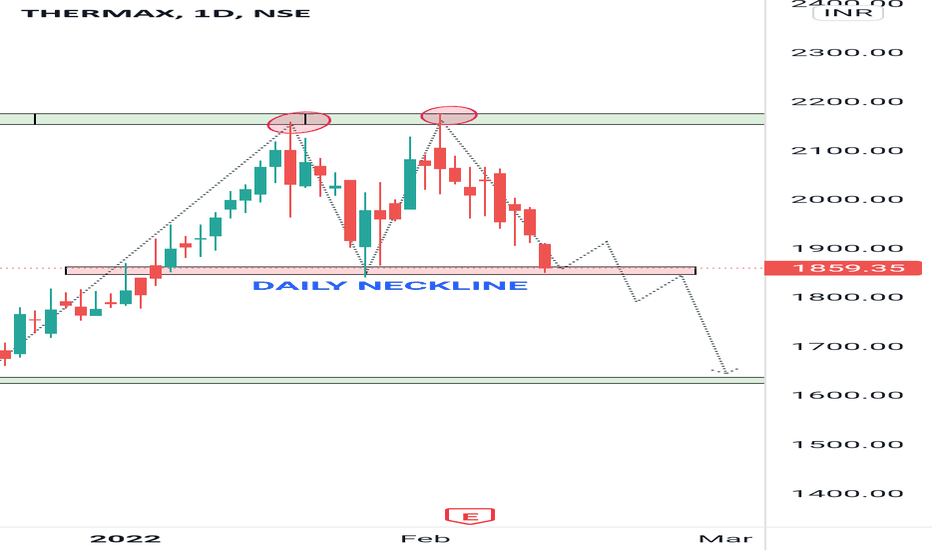
THERMAX on imp level!!!!!!After creating a double top thermax closed at neckline...all we need to do is wait for the break and retest in order to enter swing sell....this is not sure shot information it could possibly reverse as well...so please do your own analysis before taking trade..this is just my knowledge that i am sharing with u guys take it as a knowledge purpose...i hope it will help you understand market potential... THANKYOU:)
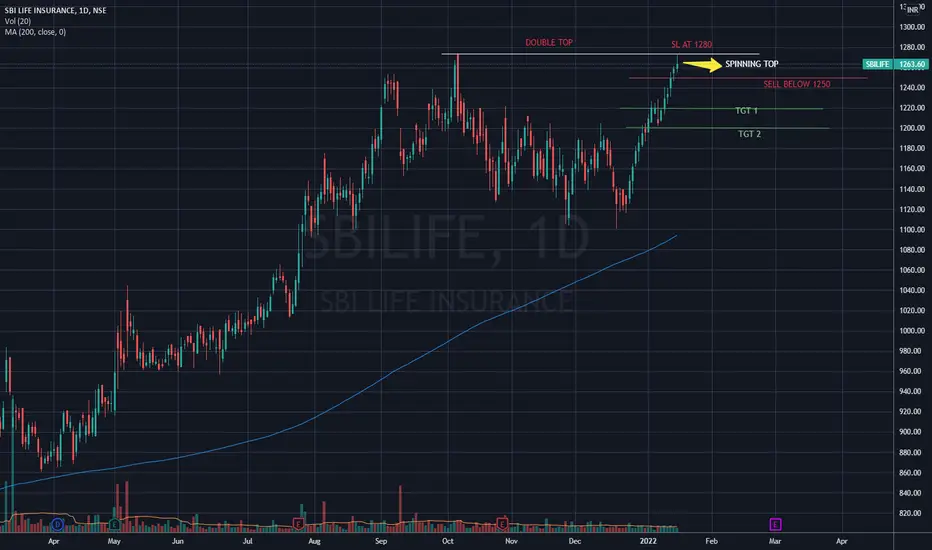
Double Top
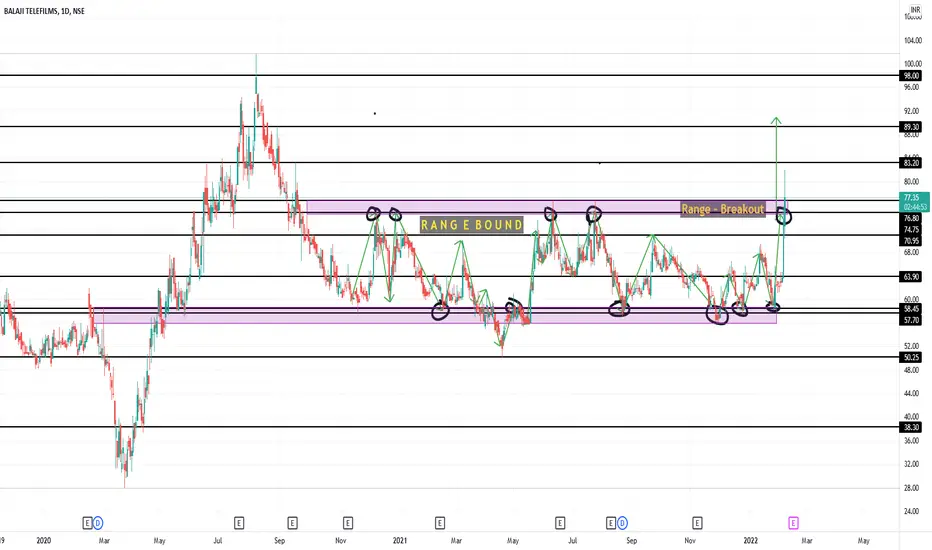
Balajitele - Range Bound - Range BreakoutNSE:BALAJITELE
BalajiTele
View : Bullish Shortterm - Medium Term - Long term
Structure : Range Bround
Range Breakout: Traders can enter in the direction of a breakout from a trading range.
To confirm the move is valid, Traders can use other indicators as per thier own wish.
Observation:
1. Range Breakout @ 75.00
2. Double / Multiple Bottom
3. Multiple support between 57 -58 indicates Balajitele can break the Upper range.
4. Range broken at 75.00 CMP 77.00 (7th February 12.40)
View:
Buy between 75 - 78
Stop Loss: 69.75 for long term
Target 83 - 89 - 92 - 96 - 95 - 100 + + + +
NIFTY MAKING A DOUBLE TOP ON 15 MIN CHARTNifty has been on a falling channel right from 3rd February. Today it is moving in another rising channel.
So for any up move it has to break out of the falling channel. Otherwise can go short on the break of the smaller rising channel.
It is a wait and watch situation.
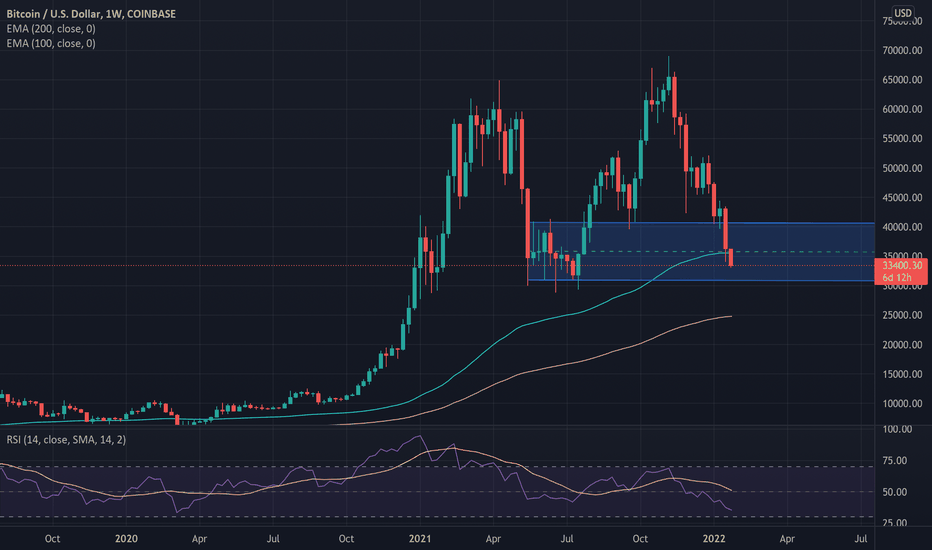
Weekly BTC-USD(24th January)Crypto markets continue to bleed as the total crypto Mcap plummeted by more than ~20% in the last week alone. Uncertainty in Russia and Ukraine also adding more fuel to this fire. Overall, the global markets are also trading in red from the start of this year and due to high correlation between both the markets, crypto markets plunged more than the Equity markets.
On the Weekly TF, BTC formed a big bearish candle and closed the week with more than ~16% declines but managed to close slightly above its 100-WEMA. At the time of writing, BTC made a new low for 2022 and is trading just above $33,500.
As per the current market scenario, bears are in full strength and every move by Bulls is being pushed back to lower levels, lack of bullish strength is mainly due to the continuous liquidations bulls have to face from the last 1-2 months.
BTC is already trading below its crucial psychological levels of $40K, however, the immediate support is present at $32K followed by $30K, but if BTC bears also managed to crash below $30K, then this will result in breakdown of the Double Top neckline structure, this can result in further downswing to continue for more 15% to 20%.
If the bearish trend continues, there will be minor pullbacks to the higher side which can be used to close your Long positions or enter into a new short trade. However, we can expect fresh buying in the range of $29.5K to $30.5K and hence a trend reversal or sideways trend can be expected before we break below the $30K level. The nearest hurdle is placed at $36,000 followed by $38K and then the major resistance at $40K.
Weekly RSI is trading at its lowest level since 2021 and Daily RSI is already in the Oversold zone which depicts that short term pullbacks can be expected in the near term.
Maruti Double Top or Further BreakoutMaruti is showing signs of Double Top pattern as it is at crucial resistance zone. If it is a clear breakout above 8400, then possibility of more upside. If it falls from here, it could move down forming Double Top pattern. There are some new regulations coming for EV in auto industry, It will be interesting to watch this out
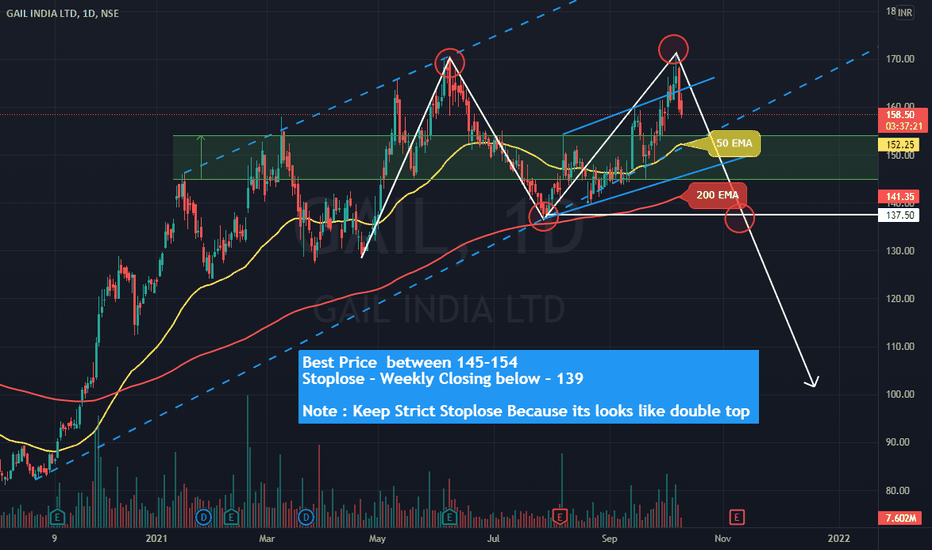
Best Price to buy 145-1541. Best Price between 145-154
2. Stop lose - Weekly Closing below - 139
3. Gail is trading inside a channel
4. Channel Support and 50 EMA Support
5. As per volume profile 145 and 154 has an huge volume so it may act as support/Resistance
Caution : Keep Strict Stop lose Because its looks like double top
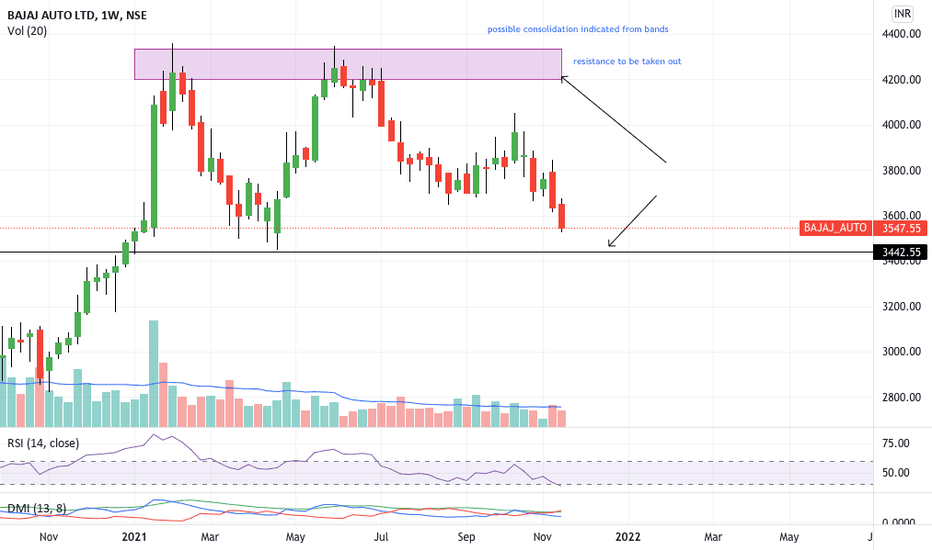
Bajaj Auto: Bearish potential weekly double top & -ve newsChart wise double top break down potential exit on weekly charts and any 3447 previous swing low broken
Could see more downfall. The momentum on short term and medium term has entered bear zones .Trend
Indicators also bearish on all timeframes. Bollinger band spill out happened on weekly charts as well indicator
bearishness ahead. Entry could be on daily on breach of the previous swing low support break.
Swing SetupEXPLANATION : This is a Daily time frame chart of UPL . The stock has been in a downtrend for days and has formed double top pattern . If give a strong breakdown and broke its demand zone with volumes and has retested the same. I am bearish on this stock for the coming days . If taken support from demand zone we buy at the bottom and sell at the top , I am bullish on this stock for the coming days . Enter as per your setup .
If you like the analysis give a Like // Follow for more updates , let me know in comments below :)
Swing SetupEXPLANATION : This is a Daily time frame chart of ULTRACEMCO . The stock has been in a downtrend for days and has formed kind of a head and shoulder pattern . If give a strong breakdown and broke its demand zone with volumes and has retested the same. I am bearish on this stock for the coming days . If taken support from demand zone we buy at the bottom and sell at the top , I am bullish on this stock for the coming days . Enter as per your setup and sit tight to achieve the maximum target.
If you like the analysis give a Like // Follow for more updates , let me know in comments below :)