MPLT: Quiet accumulation before the next move?MapLight Therapeutics is not among the most discussed names on NASDAQ, which is exactly why it deserves attention. The company operates in the biotechnology sector, focusing on innovative therapies targeting neurological and psychiatric disorders. Biotech stocks often experience sharp moves when expectations begin to shift, and MPLT may be approaching one of those moments.
From a fundamental perspective, investors remain focused on the progress of the company's clinical programs, upcoming development milestones, and potential partnerships. Positive updates related to trials or regulatory progress could significantly improve sentiment. At the same time, biotechnology investments carry elevated risks, including clinical setbacks, funding requirements, regulatory uncertainty, and the possibility of future dilution.
From a technical standpoint, this analysis is based on the daily timeframe. Following an explosive rally earlier this year, the stock entered a prolonged consolidation phase and successfully defended the 25–26 support area on multiple occasions. The repeated buying interest around this zone suggests that larger participants may be accumulating positions rather than abandoning the trend.
Price is currently trading near 27.75 and attempting to build a new upward structure after breaking the short-term corrective trendline. As long as MPLT remains above the 25.20 support level, the bullish scenario remains intact. The first upside objective is located near 31.40, corresponding to the 0.382 Fibonacci level and the upper boundary of the recent range. A breakout above this area could open the way toward 35.00. If momentum accelerates and buyers maintain control, the next major target sits near 41.00.
The alternative scenario becomes relevant if the stock loses the 25.20 support zone and establishes acceptance below it. Such a move would weaken the bullish structure and increase the probability of a deeper correction. Until that occurs, buyers continue to hold the strategic advantage.
In my opinion, MPLT presents an interesting risk-to-reward setup. The market has already demonstrated a willingness to defend key support, and the current consolidation may represent preparation for the next impulsive move. The reaction around the highlighted levels should reveal whether accumulation is indeed taking place.
This publication reflects my personal opinion and should not be considered investment advice.
Economic Cycles
Nifty - Swing Short📉 Short Setup: High RR Play at Resistance
Looking at the hourly chart, price is testing a key level that offers an excellent risk-to-reward ratio for swing bears.
🔍 Trade Details:
The Trigger: The Yellow Line is acting as major resistance. Looking for hourly swing short entries around this zone.
Risk/Reward (RR): A highly favorable 1:4 ratio.
Invalidation / Stop Loss:
Aggressive: An hourly candle close above the trigger candle.
Conservative (Safest): 23302, as marked by the short position drawing on the chart.
⚠️ Disclaimer: This is for educational purposes only and does not constitute trading or investment advice. I am not responsible for your profits or losses. Always manage your risk properly.
NIFTY 50 Educational Study: 144 Day Time Cycle & Key Price Zones📊 NIFTY 50 - GANN TIME CYCLE STUDY 📊
Current: 23,659
Key Time Cycles From 05 Jan '26 High:
1. 02 Apr '26 = 87 Days / 59 Bars
2. 29 May '26 = 144 Days / 96 Bars - Upcoming Cycle
Important Price Zones Observed:
Resistance Zone: ~23,840
Support Zone: ~23,325
Price is currently consolidating between these zones.
Gann Principle: 144 = 12x12 = Master Number
144 calendar days complete from 05 Jan to 29 May.
Historical observation: Market tends to show increased volatility and potential trend changes near major time cycles.
This chart is shared for studying time cycles and price structure only.
---
⚠️ Disclaimer: This is only for educational and learning purpose. Not a buy/sell recommendation. Not financial advice. Do your own analysis and consult a SEBI registered advisor before any decision.
Marksans - Demand & Supply + Cosolidation studyNSE:MARKSANS
Higher Time Frame (HTF)
Stock while correction phase hold by 6M Demand area and then reacted
At past Demand area, stock start consolidation reveals that selling pressure is no more exists.
As its basing currently, we consider trend on higher TF as Sideways (No more Down Trend)
Volume profile also give confirmation of high volume activity in consolidation (basing)
RSI on Weekly TF showing up thrusting strength.
Daily TF
Price first pause the selling pressure with good volume (A)
Smart Money not allowed to let price further down by passive buying (B)
As liquidity exhausted, shows a rapid up move confirms Big fish intrest
Price make new short term high where price fall again in consolidation area (C)
Price again shows down move but low volume and made Sweep of B >> Exposes the smart money interest price band area
Now price is reacted well to daily demand zone, assuming the long up move soon to be start
Point C may be reject price once and give little pullback as its pending area
Expected price to be run till marked Monthly supply zone.
Summery:
Price was reacted from Half Yearly Demand area and in consolidation phase right now. Soon it will break out of base and may run till monthly supply area as whole basing indicated nice area of accumulation by smart players.
=================================================================================
⚠️ DISCLAIMER :
I am NOT a SEBI-registered investment advisor. This is a personal technical observation for educational purposes only. It is NOT a recommendation to buy, sell, or hold any security. Trading involves substantial risk of loss. Consult a SEBI-registered advisor before making investment decisions.
NOT A RECOMMENDATION: This post is strictly for educational purposes to demonstrate price action principles and observation skills. I am NOT a SEBI-registered Investment Advisor or Research Analyst. Many time I was proven failed in past.
NO CALL TO ACTION: Do not treat this as a "Buy," "Sell," or "Hold" instruction. No specific price targets or stop-loss levels are being provided.
MARKET RISK: Equity investments are subject to market risks. Past performance and chart patterns do not guarantee future results.
PERSONAL DISCLOSURE: I may have a personal interest or position in this stock. My views are personal and should not be used as a basis for financial decisions.
ADVICE: Always consult a qualified and SEBI-registered financial professional before investing your capital.
GU BULLISH IDEAPrice has taken in the liquidity which is previous day low and also prices mitigating 4h order block and it’s also Wednesday, so I am expecting price to reverse from this point and go take the high that I have marked as target!
IT CAN GO DEEPIN NYO SO MANAGEACCORDINGLY I MIGHT ADD MORE POSITIONS!
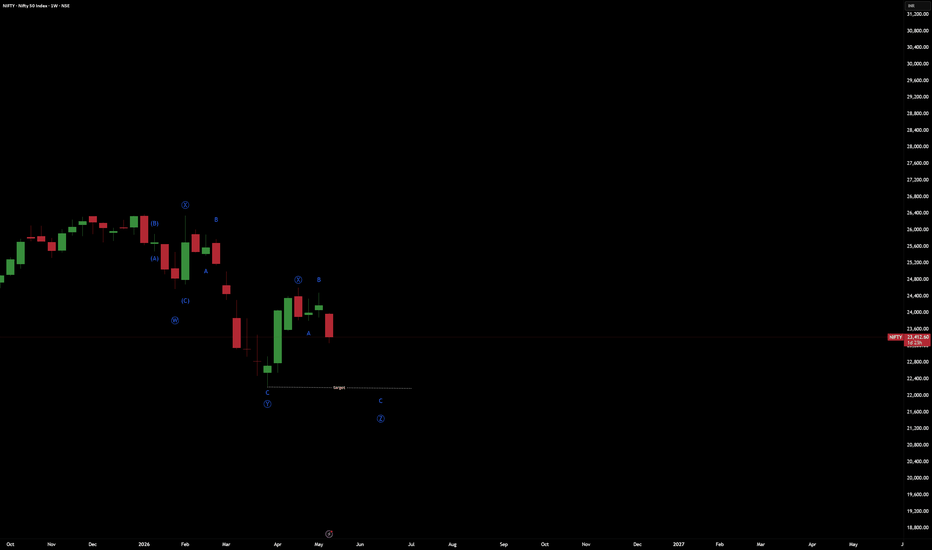
nifty ( alternate )The weekly chart suggests that each decline is unfolding in a complex three-wave corrective structure, forming a W-X-Y-X-Z pattern. Based on this alternate Elliott Wave count, the market currently appears to be in Wave C of the final Wave Z. If this interpretation is correct, Wave Z could produce the strongest phase of fear and capitulation, leading to maximum panic before the larger correction is fully completed.
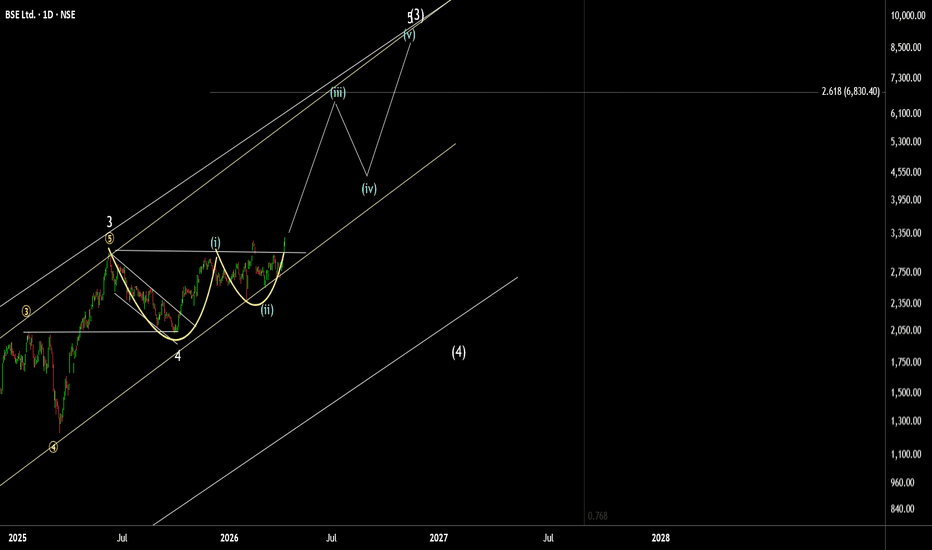
Stage 2 Brekout. Wave 3 CandidateNSE:BSE Stage 2 Breakout. Breaking out of Cup and Handle Pattern.
Getting Ready for Wave 3 Rally. Strong Rally Can Emerge out of Base Breakout.
The stock Is Showing Bullish Momentum and High Relative strength.
Trend Indicator showing Ultra Bullish Readings.
The Stock can Produce strong Momentum and Fast Rally.
Market Overview — 4H Box Structure & Cycle AlignmentLet’s start with the cycles to understand the bigger picture and know exactly what we’re doing.
My analysis style is simple and structured. I avoid complex concepts and focus on clarity, so the market structure is easy to understand and actually usable.
🔄 Cycle Structure:
HWC (Higher Wave Cycle): Bearish 🔽
MWC (Middle Wave Cycle): Range 🔁
LWC (Lower Wave Cycle): Bullish 🔼
MWC gives us clues about short-term direction.
Right now, short-term momentum is bullish, but the overall higher timeframe bias remains bearish.
At this stage of the structure, I’m more interested in short positions.
📦 4H Box Structure:
As long as price remains inside the 4H box, decisions should come from lower timeframes.
Small fluctuations shape the next move.
Inside a box, don’t look for miracles.
The real move usually comes after the breakout, when higher timeframe momentum expands.
Box Low: 62,535
Box High: 70,981
For earlier breakout entries, trendlines can be used.
Upper trendline: 4 touches
Lower trendline: 3 touches
On the last touch of the upper trendline, volume was decreasing on lower timeframes while price was pushing higher.
That was an early sign of weakness and potential downside.
⏳ Current Trading Plan:
At the moment, the 15-minute timeframe has not formed a clear structure for me to trade.
No structure = no trade.
I’m waiting for price to build the setup I need. I don’t force trades.
I’m also not using daily candles here, because we’re operating inside lower timeframe volatility.
This is intrabox movement.
Risk management is critical in this environment.
And most importantly: don’t overtrade.
Low timeframe noise can destroy discipline if you let it.
📌 If there’s a specific coin you want analyzed, drop it in the comments.
⚠️ Without proper risk management, you're just a ticking time bomb.
Bullish Bias Intact — Gap Fill Reversal Loading This WeekAs outlined in my pre-session analysis, the higher-timeframe bias remains clearly bullish — price action is simply confirming the plan. The market opened with a gap that is still unfilled, and inefficiencies like this rarely stay untouched. Expect a controlled reversal to fill the gap within this week — potentially initiated from Tuesday’s move, otherwise likely toward the weekly close.
If you agree with the analysis, comment below after the price action confirms.
USDCAD | 1H Market Structure OutlookUSDCAD is currently trading within a well-defined short-term distribution range after engineering a strong impulsive rally from the late-January lows. The recent expansion into the 1.3700 handle appears to have tapped into a premium supply zone, where price printed rejection wicks, signaling the presence of institutional sell-side liquidity.
From an SMC / ICT perspective:
Price swept relative equal highs before showing displacement to the downside, hinting at a classic buy-side liquidity grab.
The rejection from the marked supply suggests smart money may be positioning for a retracement toward inefficiencies left below.
Internal structure is beginning to shift bearish on the lower timeframe, though confirmation would require a decisive break of structure (BOS) beneath the 1.3620 support.
Key Levels to Watch
Supply / Premium: 1.3695 to 1.3710
Intermediate Support: ~1.3620 (range floor)
Higher-Timeframe Demand: 1.3580 to 1.3600, aligning with the visible demand block and potential mitigation zone.
Projected Path
If price fails to reclaim the supply region, the probability favors a corrective move lower, potentially delivering a measured draw on liquidity into the demand zone. A brief pullback into a lower high followed by continuation would further validate bearish order flow.
Invalidation Scenario:
Sustained acceptance above 1.3710 would negate the bearish premise and open the door for continuation toward higher liquidity pools.
Bias: Short-term bearish while below supply, with expectations of liquidity engineering toward discounted pricing.
EURUSD | 15M | Smart Money Concept OutlookMarket Structure:
Price is currently delivering a short-term bullish repricing following a displacement from the internal range low near 1.1775. The sequence of higher highs and higher lows confirms an intraday shift in structure, suggesting that buy-side liquidity has been engineered to facilitate a move into premium pricing.
Liquidity Narrative:
The recent impulsive leg cleared multiple internal liquidity pools, including prior equal highs and resting stop clusters. Price is now trading directly into a well-defined supply zone that aligns with a higher-timeframe premium array. This region is a classic smart money distribution pocket where late buyers often become liquidity for institutional positioning.
Order Flow & Imbalance:
The rally shows clear displacement characteristics with minimal overlap, leaving behind inefficiencies that may act as a magnet should price rotate lower. Additionally, the current consolidation beneath resistance resembles a potential buy-side liquidity build-up. A sweep of these highs would complete the liquidity engineering phase before a probable bearish expansion.
POI (Point of Interest):
Premium supply zone: ~1.1830 to 1.1845
Internal resistance acting as a distribution ledge
Untapped sell-side liquidity resting below 1.1780
Execution Model:
The preferred scenario involves a liquidity sweep above the short-term highs followed by bearish market structure shift on the lower timeframe. Confirmation through displacement and fair value gap formation would strengthen the short thesis.
Draw on Liquidity:
If the distribution unfolds as anticipated, price is likely to rebalance toward the sell-side liquidity pool near 1.1775, completing a premium-to-discount delivery cycle.
Invalidation:
Sustained acceptance above the supply zone with strong displacement would indicate continuation, signaling that the market is seeking higher external liquidity rather than distributing.
Summary:
Price is trading in premium territory after a liquidity-driven expansion. The environment favors patience, allowing smart money to reveal intent. Watch the highs carefully; what appears as breakout fuel often becomes the trapdoor.
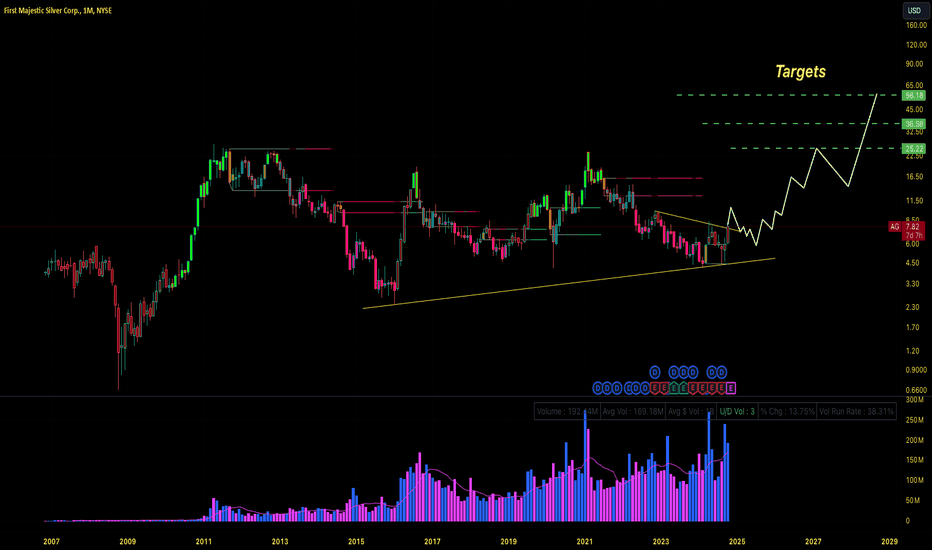
$AG setting up for a rip your face off rally #tothemoonFirst Majestic is a hated stock as of now, it also has the largest short position in the entire silver miners listed in NYSE. Bad sentiments and frustrated investors is a great combination to identify when a sector bottoms.
Looking at the price action as of now, especially from $4.5 to $7.8 it looks like a strong bullish reversal. Also this is a institution move, smart money is buying silently. Also with silver heading to new highs, which means that silver miners are turning healthy. Many silver miners are making decent margins already around 15-20% OPM, the higher silver prices go the more Free Cash Flow will be generated which will directly impact bottom line. And, the valuations are dirt cheap.
Reasons why like like First Majestic :
- Acquired Gatos Silver recently, by this deal the net AISC improves, i feel it should be around $20-18. Before acquisition NYSE:AG AISC was $25, Gatos Silver being a low cost producer should now cumulatively bring the AISC down.
- They also announced a share repurchase program which is a positive.
- They are the only silver miner with a Mint capacity, First Mint Store. Unlike other mints, which are either government-owned or privately held. Good addition to capture the entire value chain.
Well at current valuation and where the silver price is at its hard for me to see the downside. So i may be biased. I will only exit this scrip if i see Silver go below $23. That is my exit criteria.
Disclaimer : This analysis is purely for education. As i am invested in this scrip I may be biased. Don't take this as an investment advice. Please consult your financial advisor before any speculative investments.
When Fear Peaks, Emotion Speaks – Market Mood Index at an ExtremToday, the market entered a rare emotional extreme.
The Market Mood Index (MMI) dropped to 10, a level that reflects deep fear and emotional exhaustion. Readings like this don’t come from logic or long-term conviction — they emerge from panic, uncertainty, and forced selling.
Such moments are uncommon and often represent sentiment capitulation, where emotion dominates decision-making and clarity temporarily disappears.
This is not a prediction and not a buy or sell call.
It’s a reminder that markets are driven by human behavior first and analysis later.
Awareness matters most when emotions run highest.
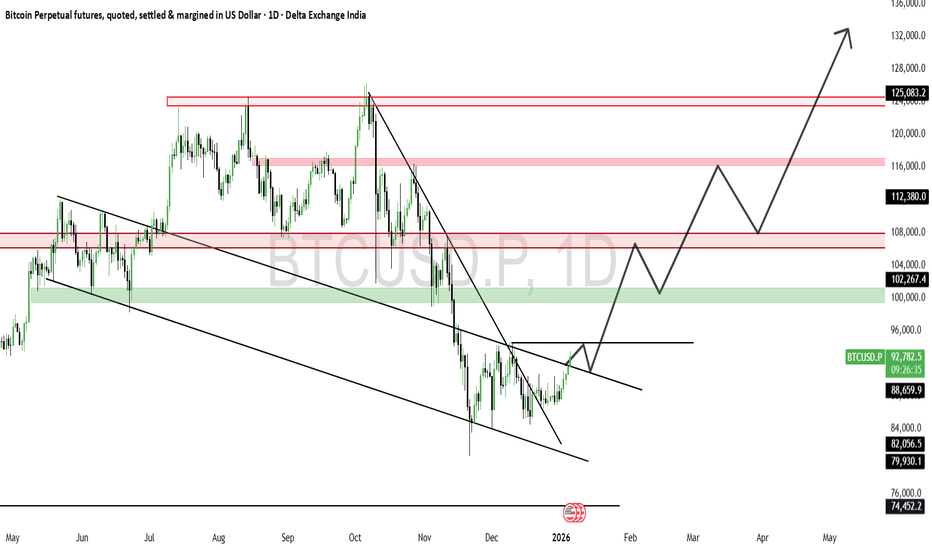
#BTC.P Up for next super cycle?
BTC is in a corrective downtrend within a defined channel and is currently reacting from a higher-timeframe demand zone. The setup anticipates a potential trend reversal contingent on a confirmed breakout and acceptance above the descending trendline and mid-range resistance. Upside expansion is expected only after structure flip and consolidation; failure to hold demand invalidates the bullish bias. This is a conditional re-accumulation setup, not a blind bottom call.
If you ignore this than it's your choice INDEX:BTCUSD
I am also shocked
every November closed in green in Year on year based than november near to end then it means v shape bounce is ready to in 6 days
please do your own research before taking any trade.
i am not financial advisor
risk is real stay practical
please feel free to ask any questions
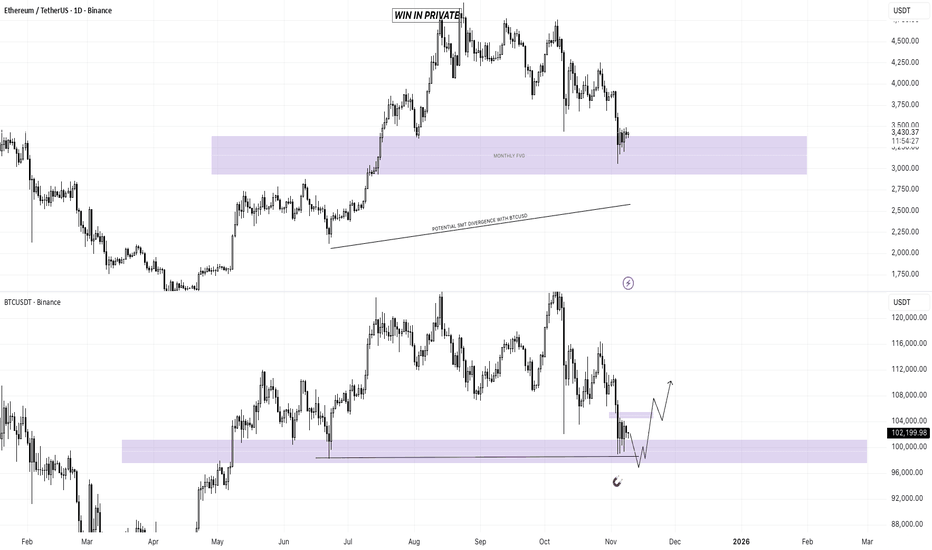
CRYPTO WEEKLY OUTLOOK 10/11/25 - 17/11/25Wassup Lads! So crypto is clearly in a downtrend as of now targeting pending daily sell side liquidity but it's also in a monthly key level that is a fair value gap, so what I am expecting price to do now is take out the pending lows on the daily timeframe on BTCUSDT and inverse the daily fair value gap, this would also cause an SMT Divergence with ETHUSDT signalling a shift in orderflow. So right now it's headed lower.
This is my plan,
1. Sell to the lows
2. Wait for an inversion of the daily bearish fair value gap on BTCUSDT, to confirm a reversal for buys.
Remember to -
1. Manage Risk
2. Do your own research
3. Stay Disciplined
FIL 4H Technical Analysis — Cycle & Key Levels Overview📊 Cycle Structure:
HWC (Higher Wave Cycle): Bullish 🔽
MWC (Middle Wave Cycle): Range 🔁
LWC (Lower Wave Cycle): Bearish 🔼
📌 Market Context & Structure:🔽
FIL is moving within a box-like consolidation after a recent upward move.
Volume shows slight weakening, suggesting potential for a controlled breakout.
Key resistance is around 0.0245–0.0250, previously tested 3 times.
A trendline on the 4H chart has had 4 touches; the 3rd touch aligns with this resistance, reinforcing its significance.
🎯 Trade Considerations:
Long Opportunity: Breakout above 0.0250 could provide a solid long entry if confirmed with volume.
Short / Pullback: If price fails at the trendline or resistance, short-term pullbacks are possible. Keep stops tight due to LWC bearish pressure.
The current box could act as an accumulation zone; watching for a confirmed breakout is key.
📌 If you want a specific coin analyzed, drop a comment and I’ll do it for you.
⚠️ Without proper risk management, you're just a ticking time bomb.
— PXA