Bitcoin Analysis: Downtrend Likely to ContinueBitcoin Analysis
Date: June 24, 2026
4-Hour Timeframe (Overall Analysis):
We are currently in a downtrend on Bitcoin. The red line represents the main bearish movement, while the green line shows the corrective phase of this downtrend.
It appears that the corrective phase may have completed, and we are potentially ready for the second wave of the downward move.
Volume analysis supports this view: volume increases on every decline and decreases during upward moves. This clearly confirms that volu
Economic Cycles
XAUUSD | Leading vs Extended Diagonal — Two Paths Toward Wave A Gold is currently trading in a region that may represent the final stage of a larger bearish cycle and the beginning of Wave A within a higher-degree corrective structure.
The aggressive scenario anticipates a Leading Diagonal developing with a classic 5-3-5-3-5 internal structure. In this case, the fifth wave could either become truncated or briefly extend below the current lows before completing the decline.
The conservative scenario allows for the development of an Extended Diagonal, where
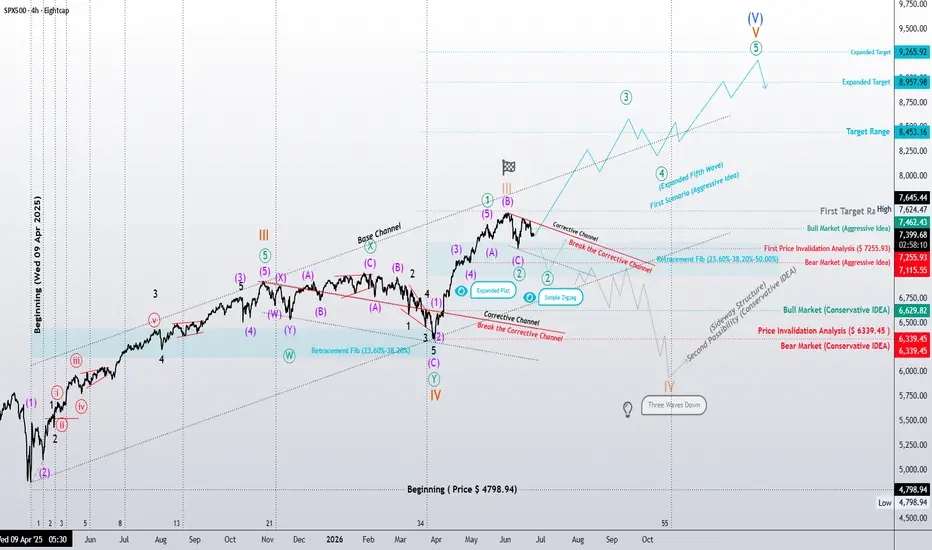
Beyond Elliott Wave: The Macro Correlation PlaySPX500 4H Strategic Analysis
Attention Traders,
Here is my latest deep-dive into the SPX500 4H chart. We aren’t just looking at price action; we are reading the “blueprint” of market energy.
Technical Breakdown:
The current structure presents two high-probability paths:
The Aggressive Scenario: A potential Expanded 5th Wave completion, targeting key liquidity zones at 8,957 and potentially reaching as high as 9,265.
The Conservative Scenario: A transition into a larger Wave IV sideways st
BTC/USD — Multi-Cycle Fibonacci AnalysisTechnical Side of the Book
Looking at Bitcoin's entire price history on the monthly chart, three distinct bull cycles emerge:
Cycle 1: From 2015 to 2018. Peak was $20k and bottom was $3k which is Fibonacci 0.382.
Cycle 2: From 2019 to 2021. Peak was $65k and bottom was $16k which is between Fibonacci 0.382 and 0.5.
Cycle 3: From 2023 to 2026. Peak was $118k and we're reaching to bottom.
The pattern is consistent, every post-peak bear market has found its bottom between the 0.382 and
SPX500 Structural Analysis: Aggressive vs. Conservative ScenarioThe current analysis of the SPX500 presents two distinct technical outlooks, depending on the completion status of the larger-degree Wave III:
1. The Aggressive Scenario (Targeting Wave V Extension)
In this view, the market is still in the process of completing Wave 5 of 5 of a higher-degree Wave 3. The primary objective is to capture the extension of Wave V. Within this framework, any current pullbacks are viewed as brief, shallow, and impulsive corrective moves, serving only to provide the ne
ETH IS HATED. NOT DEAD!NO BELIEF.
NO ATTENTION.
PERFECT.
CRYPTOCAP:ETH is testing the same long-term weekly structure that marked previous major resets.
The indicator is back near the zone where the market usually gives up. This is not euphoria. This is a hated reset. The crowd will come back after price makes belief easy again. Not dead. On trial.
with Weekly RSI
Bitcoin Cycle Location: Old Cycle Top as SupportThis is not a shortterm trade idea.ıtis a cycle location framework.
The key point of this chart is simple Bitcoin is not only correcting from the 2025 high. It is testing one of the most important structural zones of the entire cycle.
The 2021 cycle top area, roughly the 58K–69K zone, was the ceiling of the previous cycle. After Bitcoin reclaimed that area in 2024, the market entered a different structural regime. The old cycle top stopped being only historical resistance and started acting as
Crude Oil Near Key Support as Low Inventories Could Fuel DemandUS oil inventories remain relatively low by historical standards. If crude oil continues to decline, lower prices could encourage SPR replenishment, as officials have previously indicated interest in buying at lower prices, while also supporting stronger commercial demand. That gap from March 1st near 67 remains the first major downside level to watch.
Grega
EURUSD – The Fractal Geometry of the Grand SupercycleIn navigating the current complexity of the EURUSD structure, the divide between our “Aggressive” and “Conservative” scenarios boils down to a question of fractal resolution.
The Aggressive Outlook: We are currently evaluating the potential for an extended Double Zigzag. Should the initial wave indeed manifest as a Leading Diagonal, we must strictly adhere to the internal 5-wave structure of Wave A. We are currently observing the corrective phase with precision, ensuring the integrity of the Wa
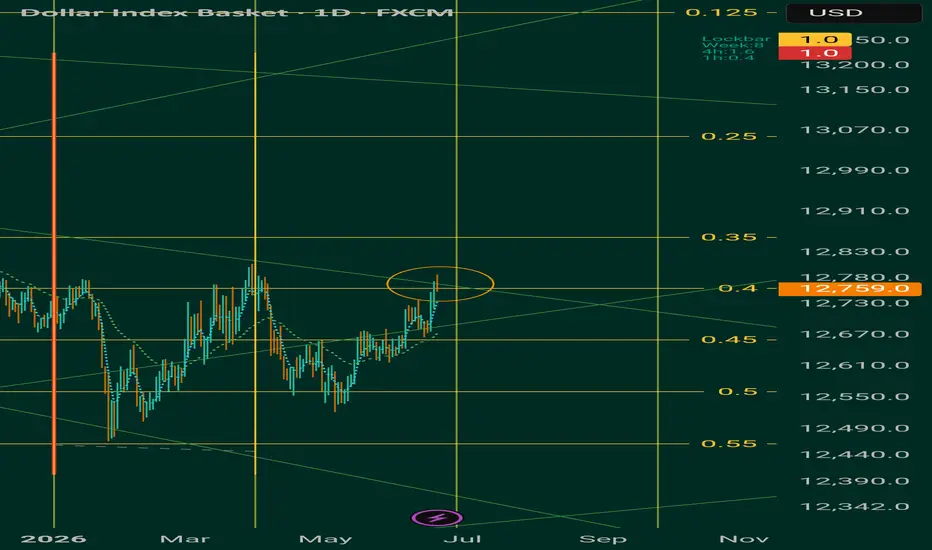
Usdollar high before spike downThrough some technical analysis, pattern recognition, and quarterly cycle coming up. I believe we are either seeing the current usdollar high before a spike down, or to see a spike down lower before price makes new recent highs. Either way usdollar will spike down is me belief.
I'm using time and price levels to determine this. Typically quarterly breaks of the year gives you good highs and lows for the next cycle.
Let us see how it plays out.
EURUSD – Weekly Structural Update: Grand Supercycle RoadmapAnalysis Snapshot:
The weekly chart reveals the internal mechanics of the EURUSD long-term bearish structure. We are currently navigating a critical juncture within the ongoing Grand Supercycle correction, where the market is testing the boundaries of established corrective channels.
Two Paths, One Objective:
Scenario A (Aggressive): The Impulse Count
This outlook focuses on the potential for a 5-wave impulsive decline. The price action is currently showing signs of accelerating towards lower
EURUSD – Weekly Structural Update: Grand Supercycle RoadmapAnalysis Snapshot:
The weekly chart reveals the internal mechanics of the EURUSD long-term bearish structure. We are currently navigating a critical juncture within the ongoing Grand Supercycle correction, where the market is testing the boundaries of established corrective channels.
Two Paths, One Objective:
Scenario A (Aggressive): The Impulse Count
This outlook focuses on the potential for a 5-wave impulsive decline. The price action is currently showing signs of accelerating towards lower
EURUSD: Grand Supercycle Perspective & Structural OutlookOverview:
Analyzing the EURUSD on a monthly timeframe requires a macro-structural approach. The key focus remains on the interpretation of the price action post-2008 (the cycle peak), whether it defines an Impulsive decline or a complex Corrective structure.
Scenario 1: The Aggressive View (Impulsive Count)
Structure: This count interprets the decline from the 2008 peak as an Impulsive move (5-wave structure).
Current Phase: The market has completed the first three sub-waves. We are currently
THE COMPLETE STORY OF BITCOIN CRASHESTo understand Bitcoin, you cannot only look at today’s price. You have to look at the entire story. This is not a nostalgia thread. This is a media psychology archive.
What did mainstream media write during every major Bitcoin crash?
What did people believe?
What did Bitcoin critics say?
What fear did the crowd surrender to?
And where did the courageous decision appear?
Because bottoms are not built only by price. Bottoms are built by fear. And nobody sells fear better than mainstream media.
EURUSD: Post-Liquidity Sweep Structural Alignment (PDL to EQ)The Macro Thesis: Context & Target
This execution model interfaces with a high-horizon liquidity cycle on the EURUSD 4-Hour and 1-Hour horizons. To ensure absolute objectivity, the campaign is broken down into verified structural phases rather than speculative bias.
1. Price expanded into a deep higher-timeframe matrix, sweeping past the Previous Daily Low (PDL) and piercing the 1D-Support floor
2. The Draw on Price (Target): Immediate structural targets are mapped to the 1H/4H Equilibrium vec
XAGUSD: Detailed Technical AnalysisScenario 1: Aggressive (Turquoise Count)
Core Hypothesis: The price action indicates the completion of Wave A as a Leading Diagonal. This implies that the subsequent market behavior should unfold as a corrective structure.
Current Stage: The analysis suggests that the market is presently engaged in the formation of Wave B, which represents the initial corrective leg following the diagonal impulse. This phase is characterized by its corrective nature, typically unfolding in a three-wave pattern
Textbook Diagonals: Converging Leading Diagonals or Extended StrTextbook Diagonals: Converging Leading Diagonals or Extended Structures?
In today’s technical breakdown of XAUUSD, we are observing textbook Diagonals that are dictating the current market structure. We are evaluating two critical paths:
The Aggressive Scenario (Cyan - Converging Leading Diagonal): This Leading Diagonal formation signals that the market has entered a corrective phase. We are treating this as the initiator of a Zigzag correction, which could manifest as either a simple or a com
BTC 1H: Two Windows of OpportunityThe chart shows one of the mirror patterns I use.
Currently, the model projects two windows of opportunity:
🟨 Window 1
June 9, 2026
7:48 AM – 10:12 PM
🟨 Window 2
June 10, 2026
12:00 PM – 9:00 PM (approx.)
As always, the time window alone does not indicate direction. The interesting thing is to observe how the price reacts if it reaches any of the pivot price levels during those time intervals.
Resistance/Upper Levels
• 68,000 – 67,400
• 67,000 – 66,300
• 64,400
• 63,100 – 62,900 ⭐️ (especia
Key Timings and levels for BTC (Short-term!)In addition to June hosting a notable concentration of cyclical activity, the cycle clusters suggest that this week may act as an important inflection point for the market.
Within the week, two dates stand out due to their elevated concentration of cycles and, therefore, their potential to create trading opportunities:
17/06/2026
20/06/2026
⏰ Key timing windows for June 17
05:00 UTC-4
13:00 UTC-4
17:00 UTC-4
These hours may coincide with changes in direction, momentum shifts, breakouts, or i
Sell Bitcoin and Altcoins during 2025 and don't look back!Hello Everyone,
This is my first public post since the last one, which I published on Sep 28, 2022, and you can see that here:
My cycle analysis (TA) proved spot-on the last time I accurately predicted Bitcoin’s behavior. To avoid overcomplicating things, I’ll keep this brief.
As the yearly chart indicates, we’ve seen a consistent pattern: a three-year bull market followed by a one-year bear market. History appears poised to repeat itself, and we’re now entering the final phase of the curren
BSBusdt Reclaims Strength After Successful Base FormationBSB appears to have completed a corrective decline into a strong base zone and is now showing signs of re-accumulation. The recent rebound from the lows suggests buyers are stepping back in, while the current structure points toward the beginning of a new impulsive advance. As long as price remains above the highlighted re-accumulation zone, the bullish outlook remains intact.
The projected wave structure indicates a potential five-wave expansion, with the first major objective targeting the su