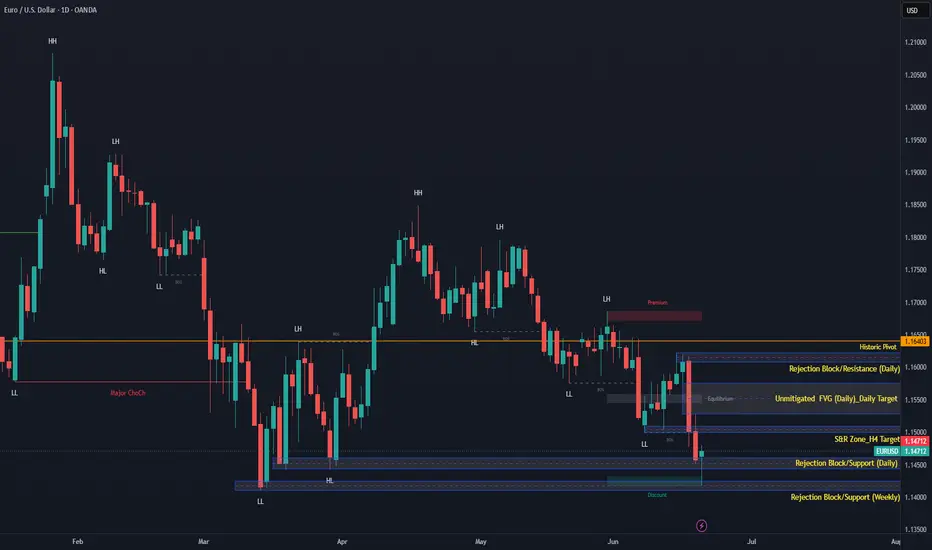
EURUSD Structural Report: Weekly Closing AuditHello Traders, here is my take on the current EURUSD structural outlook.
1. High-Horizon Structure Violation
Macro Anchor: Multi-year dealer range (1.20831 to 1.01779), this displacement confirms a sustained high-horizon bearish expansion phase.
The weekly candle cycle has officially printed a solid structural close beneath the macro 1.14110 baseline.
2. Low-Horizon Imbalance Defended
Daily terminal mapping confirms absolute institutional dominance. Price delivery executed a precise mitigati
Economic Cycles
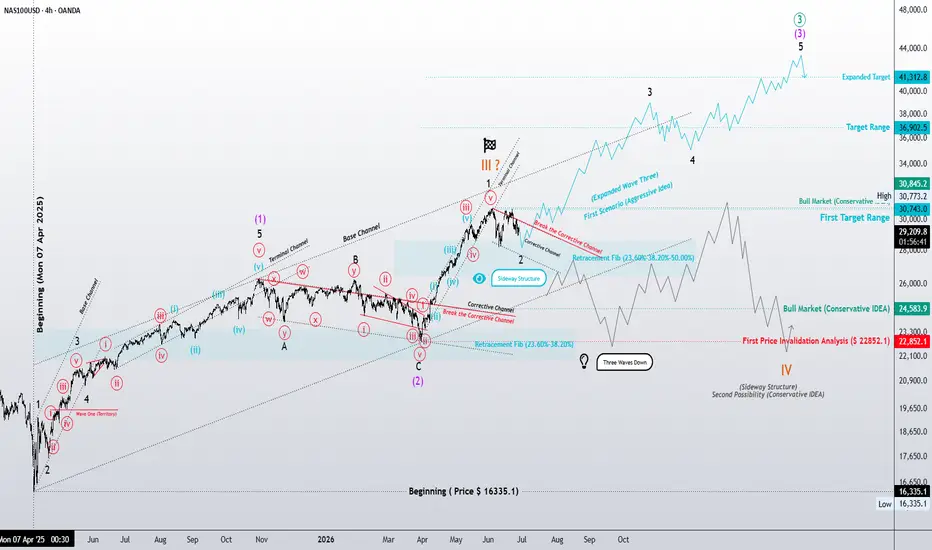
NASDAQ | Daily & 4H Elliott Wave Analysis: Structure Over BiasNASDAQ | Daily & 4H Elliott Wave Analysis: Structure Over Bias 📊
In this week's NASDAQ analysis, I'm maintaining two structurally valid Elliott Wave scenarios. The purpose isn't to predict what the market should do, but to identify where it may currently reside within the broader wave sequence.
The debate here isn't necessarily about direction. It's about position.
Scenario 1 — Aggressive Thesis: The Extended Wave III Expansion
The aggressive interpretation continues to favor a nested 1-2 wa
Nasdaq Daily Chart: A Duality of Market ScenariosIn today’s daily analysis of the NASDAQ, I’m navigating two distinct scenarios. As a market analyst, the truth often lies in how we manage these conflicting perspectives:
1. The Aggressive Thesis (Nested 1-2s):
Focusing on the internal architecture of nested 1-2 waves. This approach assumes the index is in a pure “Power Mode,” where successive impulse structures suggest we are deep within a massive, ongoing Wave 3. In this view, any pullback is merely fuel.
2. The Conservative Thesis (Wave 3
ALTSEASON IS TESTING THE DOOR.This is Altcoin Dominance excluding the top 10.
Not Bitcoin. Not Ethereum. Not the largest names. broader altcoin market.
The same structure mattered before the 2017 and 2021 rotations. Both times, the market looked quiet before breadth started to expand. Now the broad altcoin layer is pressing against the multi year downtrend again. This is not confirmation yet. But it is the exact chart I watch before altseason becomes obvious to the crowd. One coin pumping is noise. Breadth is the signal.
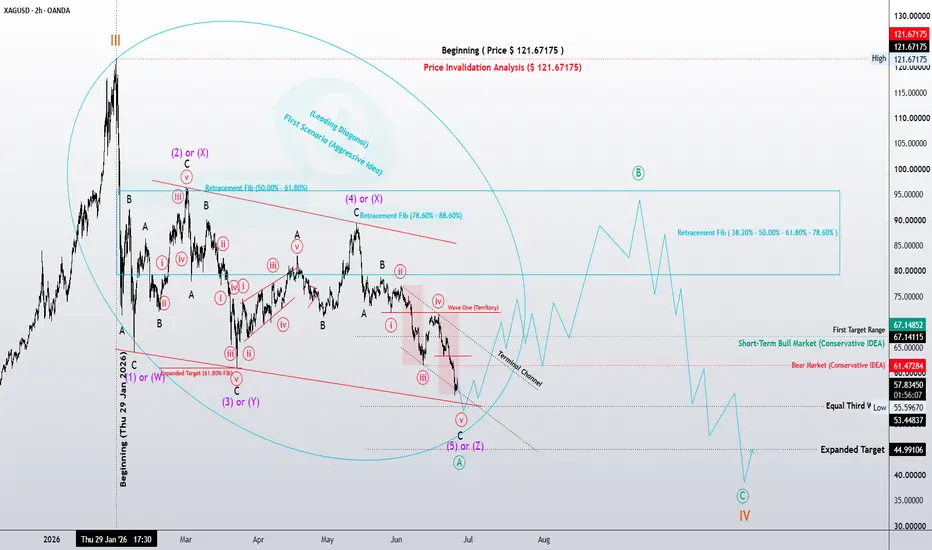
$XAGUSD | Structure Research 3.3.3.3.3 or 5.3.5.3.5 Bar ChartThe market is not always what it appears to be.
At first glance, the current Silver structure can be interpreted as a Leading Diagonal — supported by wave overlap, converging boundaries, and corrective characteristics within waves 2 and 4.
However, there is another possibility worth exploring.
What if this entire formation is actually a Double or Triple Zigzag completing the final stage of a much larger corrective sequence?
From an Elliott Wave perspective, both counts remain valid.
What co
$XAUUSD | Structure Research 3.3.3.3.3 or 5.3.5.3.5 Bar Chart
The market is whispering something...
But is everyone hearing the same message?
At first glance, the current formation can be interpreted as a Leading Diagonal — a pattern often seen near the beginning of a new trend.
However, there is another possibility worth considering.
What if this entire structure is actually a complex Triple Zigzag disguising itself as a diagonal?
From an Elliott Wave perspective, both interpretations remain valid.
Wave 3 is not the shortest wave, overlap is presen
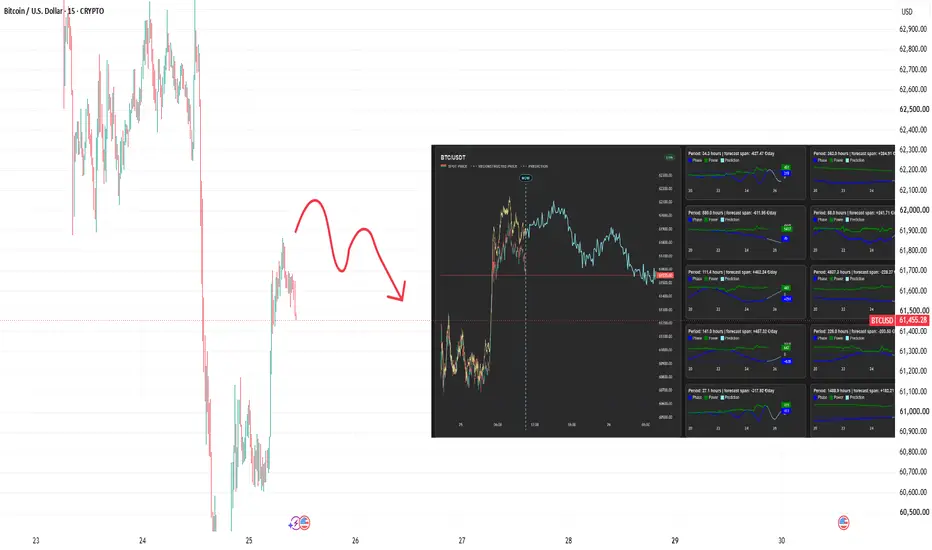
BTC update 25.06.26-24h Market Forecast (Wavelet Decomposition)Hi traders,
the previous day’s Bitcoin forecast indicated a generally sideways market, showing no strong directional bias either upward or downward. However, while the directional neutrality held in a broad sense, the shape of the forecast did not fully match the actual price evolution.
In reality, the price first experienced a sharp drop, deviating significantly from the predicted path. Interestingly, however, the market later recovered and returned close to the model’s implied equilibrium
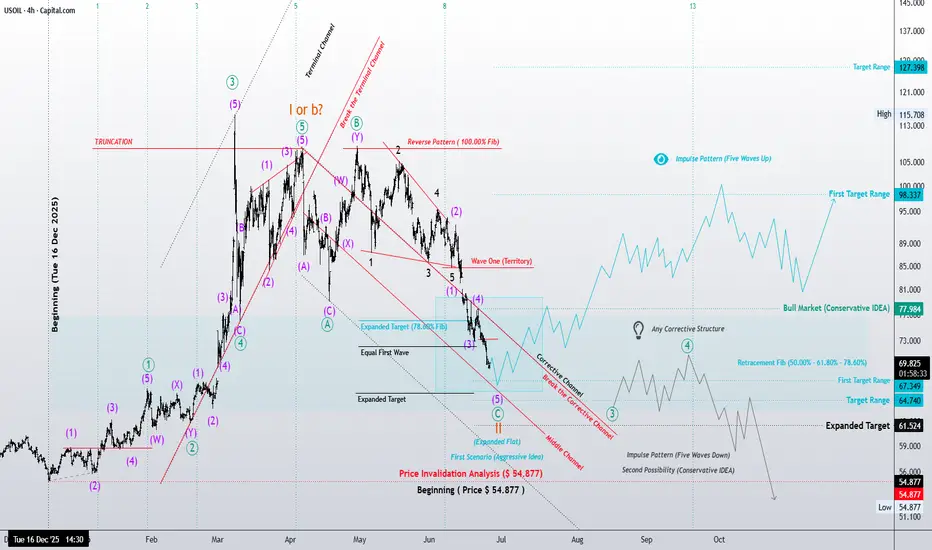
US Oil – 4H Elliott Wave UpdateTwo valid scenarios remain on the table.
The aggressive view suggests that an initial five-wave impulse has already formed from the 54.877 low. If correct, the current decline is likely Wave (2), developing as an Expanded Flat correction. Wave C appears to be approaching completion through its final subdivisions, potentially setting the stage for a strong bullish reaction. Under this scenario, reaching the first target zone and at least matching the length of Wave (1) would be a reasonable expe
Dollar Index (DXY) Elliott Wave view: Bullish Sequence The Dollar Index (DXY) maintains an incomplete bullish sequence from the January 27, 2026 low, supporting expectations for further upside. The projected target lies within the 100%–161.8% Fibonacci extension range, measured from that low, pointing toward 102.7–106.0. This zone provides a clear technical framework for anticipating continued strength.
From a short‑term perspective, the rally that began on May 29 is unfolding as a five‑wave impulsive Elliott Wave structure. Within this advance, wa
EURUSD Structural Report: Weekly Market Preview1. Macro Narrative & Daily Footprint (1D)
The primary macro trajectory for EURUSD remains structurally bearish, driven by high-level institutional capital flows favoring the USD. The market recently expanded downward to target a critical multi-month internal sell-side liquidity pool anchored at 1.14110.
Liquidity Absorption: During the Friday morning session liquidity cycle, price aggressively pierced the daily support zone (~1.1460) and swept deep into the Weekly Rejection Block (~1.1420), com
US Oil – Daily Elliott Wave PerspectiveFrom my current Elliott Wave interpretation, Wave (II) appears to be developing as a classic Zigzag correction.
Wave A likely formed as a Leading Diagonal, while Wave B unfolded as a corrective Zigzag structure. If this count is correct, the next phase should be an impulsive Wave C. Since diagonals typically consume more time than impulses, Wave C could develop with greater momentum and at a faster pace.
My focus is not on predicting news events, agreements, or conflicts. Those factors may inf
BTC Regression CurveTrolololo's BTC log regression curve bitcointalk.org BITSTAMP:BTCUSD has been practically spot on for the general trajectory of BTC. I've created % deviations from that log curve to give an idea of how under or overpriced BTC is. The last time we touch the -75% deviation was in 2020 at the ~3800 usd low and 2022. It stayed under for less than 2 days both times and shot back up to at least the -70% deviation. Hitting the -75% deviation for me is a signal that we've hit the bottom. I guess we
ETHUSDT Macro Analysis: Deciphering the Wave (II) Corrective StrETHUSDT Macro Analysis: Deciphering the Wave (II) Corrective Structure
Date: June 24, 2026
1. Executive Summary & Methodology
This analysis is strictly executed on a Closing Price (Line) Chart to filter out intraday volatility and candlestick noise. By isolating the closing price action, we aim to achieve a high-fidelity view of the underlying structural geometry and the macro-wave cycles. Our primary objective is to pinpoint the terminal phase of the Wave (II) corrective cycle.
2. Technical S
ETHUSD Technical Analysis: The Flat Correction OutlookDate: June 24, 2026
1. Current Structural Overview
Based on recent chart data, ETHUSD is currently navigating the final stages of a Regular Flat corrective pattern. The price action is presently within wave ‘c’ of a bearish 5-wave impulsive structure, which aims to complete the higher-degree wave (II) on the macro timeframe.
2. Price Targets and Scenarios
Primary Scenario (Regular Flat): The current bearish momentum is projected to find support near the $865 level (aligning with the parity of
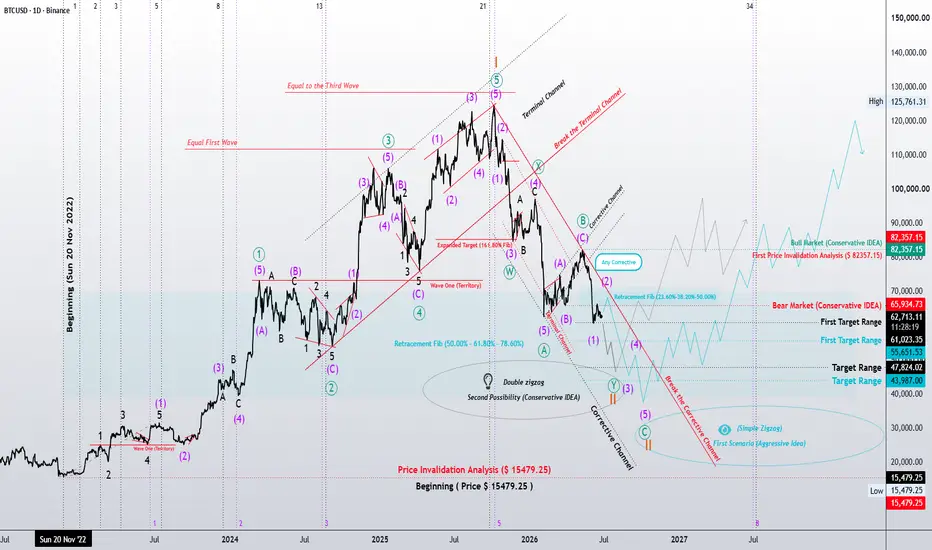
One More Low Ahead... But What Structure Is Bitcoin Building?Bitcoin is approaching a critical decision zone where the structure of Wave II matters more than the next few candles.
Both scenarios still allow for one more push lower.
The difference is not whether a new low can occur.
The difference is how the market gets there.
The conservative scenario assumes that Wave II is nearing completion and only requires one final corrective leg before the larger bullish cycle resumes. Under this view, the correction consumes less time, reaches its final low so
The Market Knows the Answer... We're Waiting for the StructureBitcoin is approaching a critical point where the structure of Wave II matters more than short-term price fluctuations.
The question is not whether Bitcoin will eventually move higher.
The real question is whether Wave II has already completed—or if the market still requires one final corrective sequence before the next major advance begins.
Under the conservative scenario, the current correction is already near completion. In this view, the market is preparing for the next impulsive phase, a
BTC update 24.06.26-24h Market Forecast (Wavelet Decomposition)Hi traders;
the reconstructed price level remains below the current market price, suggesting that the market is still trading with a positive premium relative to the model, likely due to additional short-term noise.
The spectral decomposition shows a balanced picture. The ten strongest spectral components are almost evenly split between bullish and bearish contributions, largely offsetting each other:
111.4 h: +449.74 €/day
43.4 h: −425.6 €/day
178.5 h: −409.74 €/day
580.0 h: −348.01 €/day
69.
XAGUSD | The Final Wave Is Whispering... Are You Listening?The higher timeframes already outlined the broader direction.
Now the 4H chart reveals the final details.
At this stage, the focus is not on calling an exact bottom. The objective is identifying the completion zone of a Leading Diagonal and waiting for the market to confirm the next structure.
The current decline remains consistent with a 5-3-5-3-5 Leading Diagonal count.
As long as the Elliott Wave rules remain intact, the primary count remains valid.
Wave (5) may be approaching completion
Bitcoin Analysis: Downtrend Likely to ContinueBitcoin Analysis
Date: June 24, 2026
4-Hour Timeframe (Overall Analysis):
We are currently in a downtrend on Bitcoin. The red line represents the main bearish movement, while the green line shows the corrective phase of this downtrend.
It appears that the corrective phase may have completed, and we are potentially ready for the second wave of the downward move.
Volume analysis supports this view: volume increases on every decline and decreases during upward moves. This clearly confirms that volu
XAUUSD | Leading vs Extended Diagonal — Two Paths Toward Wave A Gold is currently trading in a region that may represent the final stage of a larger bearish cycle and the beginning of Wave A within a higher-degree corrective structure.
The aggressive scenario anticipates a Leading Diagonal developing with a classic 5-3-5-3-5 internal structure. In this case, the fifth wave could either become truncated or briefly extend below the current lows before completing the decline.
The conservative scenario allows for the development of an Extended Diagonal, where
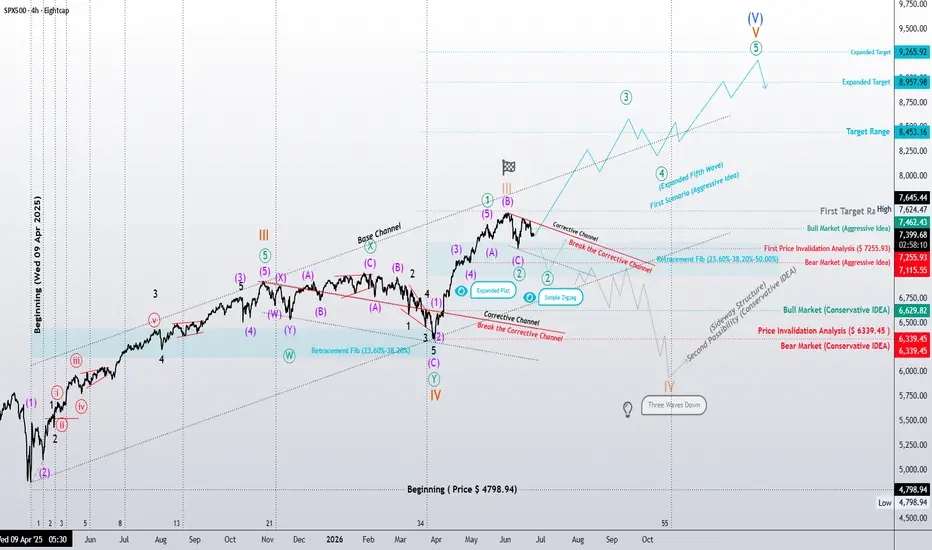
Beyond Elliott Wave: The Macro Correlation PlaySPX500 4H Strategic Analysis
Attention Traders,
Here is my latest deep-dive into the SPX500 4H chart. We aren’t just looking at price action; we are reading the “blueprint” of market energy.
Technical Breakdown:
The current structure presents two high-probability paths:
The Aggressive Scenario: A potential Expanded 5th Wave completion, targeting key liquidity zones at 8,957 and potentially reaching as high as 9,265.
The Conservative Scenario: A transition into a larger Wave IV sideways st