USDCAD: H4 Bearish CRT Retracement PlayThe displacement already happened.
Now the market is deciding whether this is reaccumulation… or redistribution.
USDCAD printed a clear H4 Bearish CRT, shifting the short-term narrative and establishing a defined dealing range between the candle’s high and low. Right now, price is rotating lower after the impulse, and the focus shifts toward how it reacts around the equilibrium.
Current framework:
H4 Bearish CRT established
Price expected to retrace toward the 50% equilibrium of the CRT candle
Midpoint acting as key decision zone
High and low of the CRT candle defining the active range
My expectation:
Price taps into the 50% level and attempts to find support. If buyers fail to defend equilibrium, then the probability increases for a continuation lower toward the low of the H4 CRT candle.
That’s the important part:
The midpoint reaction determines the next bias.
Key idea:
Strong displacement candles create ranges that institutions respect.
The equilibrium becomes the battlefield.
Most traders focus only on direction.
But the real edge comes from watching how price behaves inside the range.
Acceptance above equilibrium keeps recovery alive.
Failure opens the door for another leg lower.
Community ideas
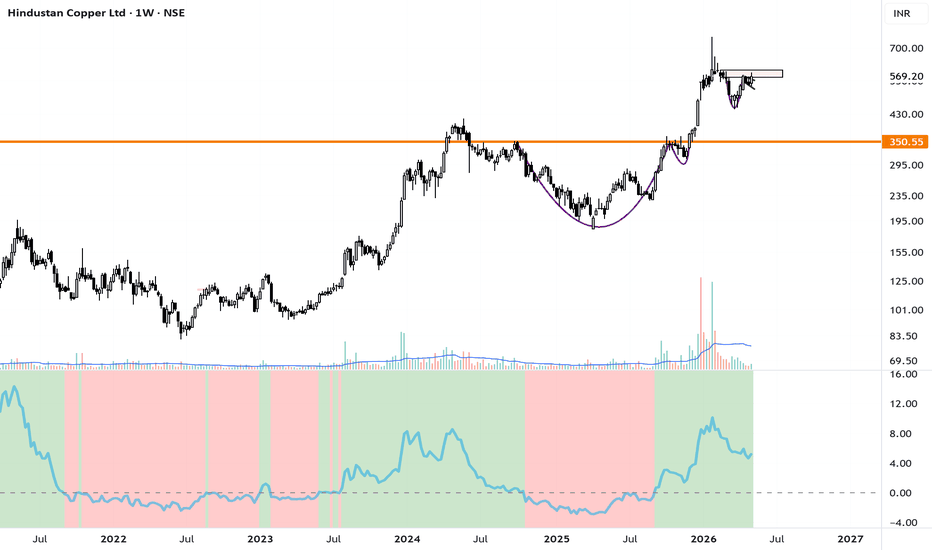
HINDCOPPER: Base-on-Base Breakout SetupThe Core Thesis: Absorption at All-Time Highs
Hindustan Copper is exhibiting textbook Stage 2 leadership. After a massive impulse move earlier this year, the stock has spent several weeks consolidating in a tight Stage 2 Base. The "squat" observed over the last two weeks—narrow price action on low volume—is a strong signal that selling pressure has dried up and institutional hands are in control.
Technical Breakdown
Moving Average Alignment: The stock is in a "Perfect Stack." It is trading firmly above all key moving averages (10, 20, 50, and 200-week). The 10-week EMA is acting as steep dynamic support, currently trending near 534.
Relative Strength (RS): RS is exceptionally strong. HINDCOPPER has delivered over 150% returns in the last year, consistently outperforming the Nifty Metal index and the broader market.
Copper Tailwinds: Global copper prices remain resilient due to a structural deficit and demand from EV infrastructure and renewable energy grids. LME Copper is forecast to remain elevated through 2026.
Volume Exhaustion: The last two weeks of "squatting" on low volume confirm that supply is being absorbed at these higher price levels.
Tactical Trade Plan
Entry Trigger: A decisive breakout and weekly close above the 582 resistance level.
Stop-Loss (SL): 521 (Weekly close basis). This protects the position below the immediate structural support and the 10-week EMA.
Target 1: 680 (Projected trend extension).
Target 2: 760 (Test of the 52-week Weak High).
Final Note for Traders
Hindustan Copper is a marquee play on the global energy transition. With plans to triple ore production by 2030, the long-term structural story is as strong as the technical chart.
Disclaimer: For educational purposes only. Maintain strict risk management.
Suryoday Small Finance Bank – Long-Term Breakout SetupSuryoday Small Finance Bank – Long-Term Breakout Setup (1W Chart)
Key Observations
1. Multi-month consolidation between ₹125 – ₹160 has been broken decisively.
2. Strong bullish weekly candle supported by a massive volume spike.
3. Price has also moved above the long-term descending trendline resistance.
4. Accumulation signs were visible for several months before the breakout.
5. Momentum structure now favors bulls as long as price sustains above breakout levels.
Important Levels
a. Immediate Resistance: ₹217
b. Major Resistance: ₹298
c. Breakout Zone / Support: ₹160 – ₹162
d. Demand Zone: ₹145 – ₹150
Risk Management
i. Traders should wait for follow-through buying or a successful retest of the breakout zone.
ii. Risk Management
iii. Weekly closing below ₹150 may weaken the breakout structure.
This setup reflects a classic:
✅ Silent accumulation
✅ Volume expansion
✅ Range breakout
✅ Trendline breakout
If momentum sustains, this could mark the beginning of a fresh medium-to-long-term uptrend.
Not financial advice. Trade with proper risk management.
Regards
Bull Man
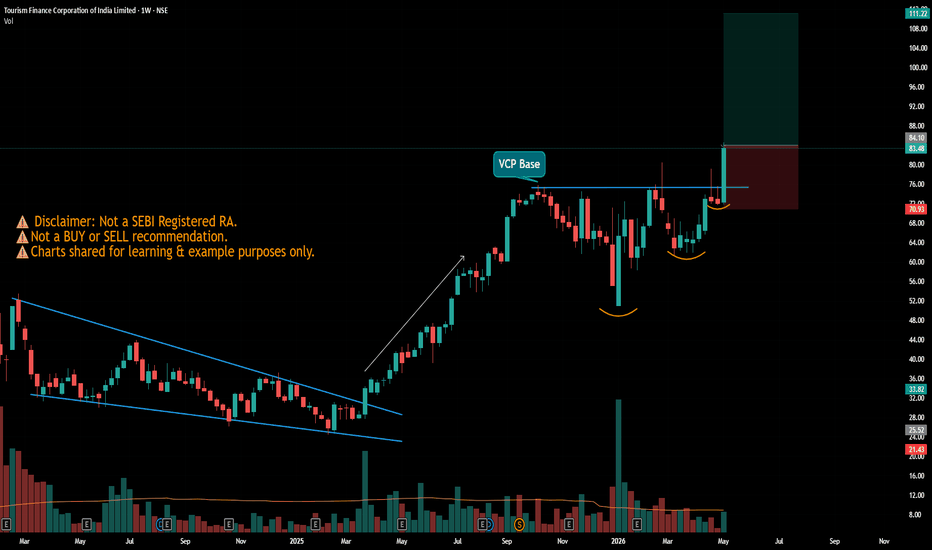
#TFCILTD - BreakOut in Weekly Time FrameScript: TFCILTD
Key highlights: 💡⚡
📈 BreakOut in Weekly Time Frame
📈 Volume is less during Breakout (Negative)
📈 RS making 52WH
📈 MACD Bounce
If you have any doubts about the setup, drop a comment and I’ll reply.
✅ Boost and Follow to never miss a new idea!✅
⚠️ Important: Always Exit the trade before any Event.
⚠️ Important: Always maintain your Risk:Reward Ratio as 1:2, with this RR, you only need a 33% win rate to Breakeven.
⚠️Disclaimer: I’m not SEBI Registered RA. Charts shared for learning & example purposes only.
Eat🍜 Sleep😴 TradingView📈 Repeat 🔁
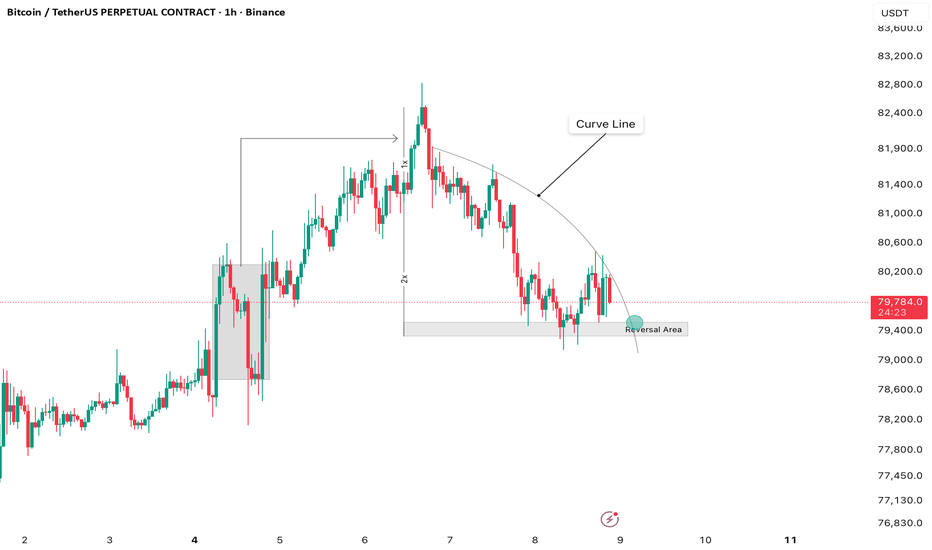
1-hour chart analysis for Bitcoin/TetherUS Perpetual (BTCUSDT.P)Bullish Scenario: If the $79,500 area holds without strong candle closes below it, a retest of the local highs at $82,000 and eventually $84,500 is likely.
Strategy: Look for a "Sweep and Reclaim" or a bullish engulfing candle within the reversal area before entering. Always follow the 1% risk management rule for capital
Structure: After a strong rally from roughly $78,000, Bitcoin encountered heavy resistance near the $82,800 local high. The subsequent "Curve Line" (arch-like pattern) represents a cooling phase into the current support zone.
Resistance: The primary hurdle remains the $82,200 – $85,300 zone. A decisive 1-hour close above $80,850 would signal a reclaim of the stair-step bullish structure.
Support (Reversal Area): The current gray box near $79,500 acts as a "demand zone" where buyers have previously stepped in.
Grasim Industries: A Titan Reclaiming Its PeakGrasim Industries Ltd (NSE: GRASIM) is currently one of the most compelling stories in the Indian large-cap space. As the flagship company of the Aditya Birla Group, it has evolved from a simple textile manufacturer into a diversified powerhouse with dominant positions in Viscose Staple Fibre (VSF), Chemicals, and building materials through its subsidiary, UltraTech Cement.
As of May 8, 2026, the stock is trading near ₹2,968, reflecting a robust recovery and a strategic pivot toward new growth engines like the "Birla Opus" paints division.
Technical Analysis: The Chart Speaks
The provided weekly chart reveals a textbook "Ascending Channel" and a significant breakout attempt:
Long-Term Trend: Since mid-2022, the stock has been respecting a consistent upward-sloping channel (the grey shaded area). Every touch of the lower boundary has historically acted as a "buy-on-dips" opportunity, while the upper boundary has served as a profit-booking zone.
The 2026 Shakeout: In early 2026, the stock experienced a sharp "throwback" toward the ₹2,500 level (the green horizontal support line). This area successfully cushioned the fall, aligning with the 52-week low and providing a launchpad for the current rally.
Current Breakout: The most recent candles show a decisive surge. The price has not only reclaimed the ascending channel but is currently testing a multi-year resistance zone near ₹2,970 – ₹2,980.
Volume & Momentum: The volume bars at the bottom indicate steady participation during the recovery phase, suggesting that institutional interest is returning ahead of the Q4 FY26 earnings scheduled for May 20, 2026.
Fundamental Outlook: Beyond the Fibres
Grasim’s current valuation—trading at a premium P/E of approximately 42.6x—suggests the market is no longer viewing it as a commodity play, but as a high-growth consumer and industrial conglomerate.
Key Metric (May 2026) Value
Market Cap ~₹2,01,475 Cr
52-Week High/Low ₹2,979 / ₹2,502
Dividend Expected ₹10 per share (announced May 20)
Revenue (FY26 Est.) ~₹1.50 Lakh Cr
Growth Catalysts:
Birla Opus (Paints): The aggressive rollout of its paints business is the "X-factor." Early data for 2026 indicates market share gains are triple the industry growth rate, positioning Grasim as a serious challenger to established players.
Chemicals & VSF: As global supply chains stabilize, Grasim’s specialty sales in Cellulosic Fibres have reached a 26% volume share, driven by high export demand.
The UltraTech Factor: As the holding company for UltraTech Cement, Grasim continues to benefit from India's infrastructure boom and the government's housing initiatives.
Conclusion
Grasim is at a technical crossroads. A sustained close above ₹3,000 would mark a psychological and technical breakout into "Blue Sky" territory, potentially ending the years-long consolidation within the channel. For investors, the upcoming board meeting on May 20 will be the ultimate litmus test to see if the fundamentals justify this bullish chart pattern.
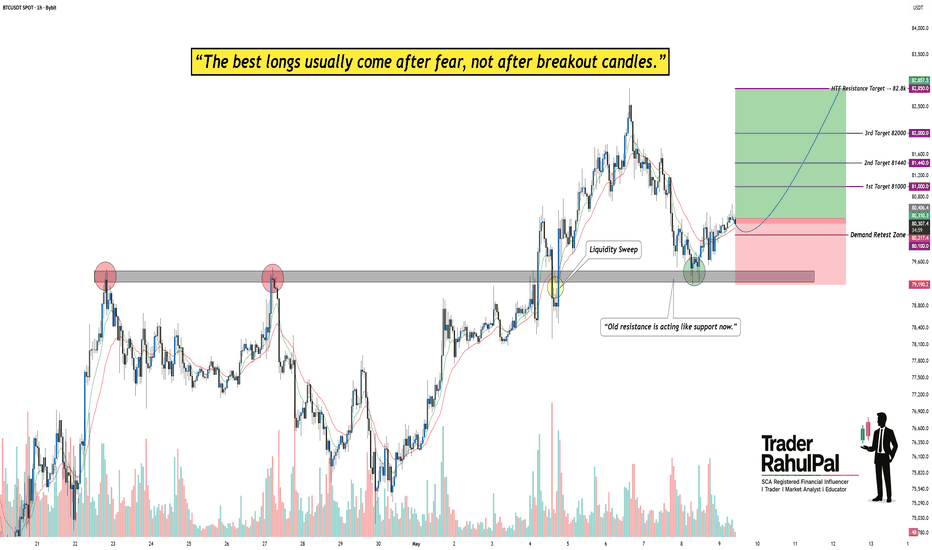
BTC Holding Key Demand Zone – Is $82.8K the Next Target?Bitcoin is once again showing strong bullish intent after successfully defending a major demand zone near the previous resistance area. The recent pullback appears healthy rather than bearish, and buyers are slowly regaining control above support.
The chart clearly shows that BTC respected the same resistance zone multiple times in the past before finally breaking above it. Now that area is acting as support, which is a classic bullish retest structure.
Market Structure Analysis
BTC previously faced rejection twice from the highlighted resistance zone around 79.0K–79.2K, making it an important historical level.
After the breakout, price entered a strong impulsive rally and created higher highs with strong bullish momentum.
The recent correction swept weak hands near support and immediately saw buying pressure return, indicating buyers are still active.
Current price action suggests BTC is attempting to build a new higher low above the breakout zone.
Volume & Momentum Insight
Volume increased heavily during the breakout rally, confirming genuine buyer participation.
During the retracement phase, selling pressure remained relatively controlled compared to the breakout move.
The bounce from support came with renewed bullish candles, showing demand is still present in the market.
Short-term moving averages are slowly curling upward again, supporting bullish continuation possibilities.
Bullish Scenario
If BTC continues holding above the 80K psychological zone, momentum could gradually push price toward the marked upside targets.
1st Target: 81,000
2nd Target: 81,400
3rd Target: 82,000
Final Target: 82,850
A sustained move above recent swing highs could accelerate bullish momentum further.
Bearish Scenario
If BTC loses the highlighted support region decisively, short-term bullish momentum may weaken.
A breakdown below 79.1K could trigger deeper profit booking and volatility.
Traders should avoid emotional entries if support fails to hold.
Rahul’s Insight
Most traders panic during healthy pullbacks inside an uptrend. But experienced traders understand that strong markets often revisit breakout zones before continuation.
The key here is not chasing green candles aggressively. The smarter approach is watching whether buyers continue defending the reclaimed support area.
As long as structure remains intact, dips may continue attracting demand.
If you found this analysis helpful, make sure to like, comment, and follow for more high-quality trading setups and educational content.
Disclaimer:
This analysis is shared for educational purposes only and should not be considered financial advice. Always manage risk properly and do your own research before taking any trade.
— @TraderRahulPal
SCA Registered Financial Influencer (Dubai, UAE)
HDFC Life - Near SupportsCMP 621.70 on 09.05.026
A sharp fall was seen in the stock price in recent weeks. Now it has been consolidating around the long term support projection around 580.
If sustains above 580, may go into a bullish phase ahead depending on the market conditions. Targets may be 680/730 or more.
The risk reward ration seems good around the present price. The setup fails if sustains below 580.
This illustration is solely my own view. It is shared for educational purposes. It is not a buy or sell recommendation. Please consult your financial advisor .
All the best.
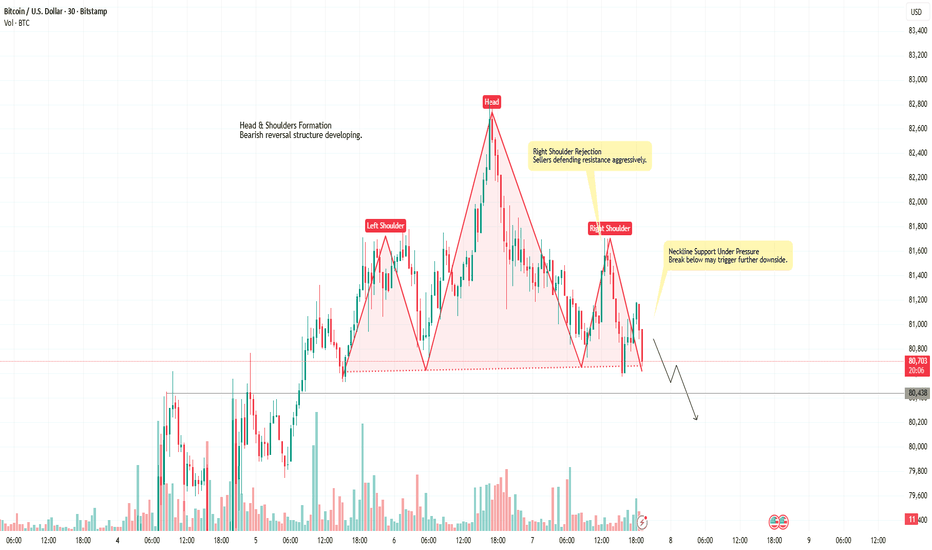
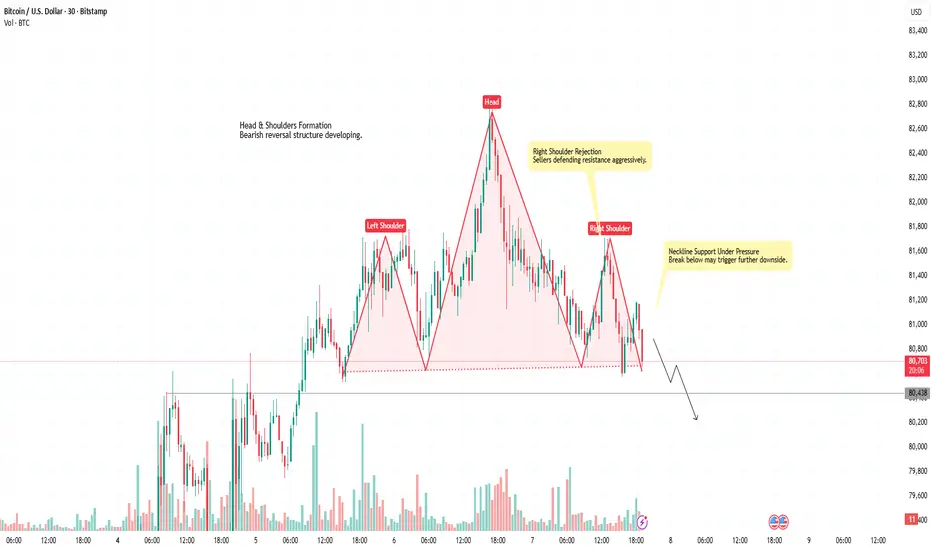
BTC Head & Shoulders Breakdown SetupBitcoin is showing signs of weakness after forming a textbook head & shoulders pattern near the local highs. The right shoulder failed to create a higher high, indicating fading bullish momentum and increasing seller control.
Price is currently reacting around the neckline support near 80,600. A strong candle close below this area could confirm the bearish breakdown and open the path toward lower support zones. Volume structure also suggests reduced buying pressure after the head formation.
As long as BTC remains below the 81,500 resistance zone, the market may continue facing short-term downside pressure. Any rejection from resistance could add momentum to the bearish continuation move.
BHARATFORG Price ActionThere are only 2 types of trading
1. Breakout &
2. Reversal
Chart does not require too much explanation for any idea, i post
BHARATFORG is in a strong bullish trend today after a sharp move higher.
Price is trading near the upper end of the day’s range, which shows buyers are still in control.
The stock is extended above its short-term averages, so momentum is strong but also a bit stretched.
That means continuation is possible, but pullbacks can be sharp.
If it holds above the breakout area, the trend remains positive.
If it loses intraday support, some profit-taking can follow.
Overall, today’s price action is bullish with strong momentum and a high-volatility feel.
NIFTY AUTO INDEXNIFTY AUTO INDEX
After making a low near 23560, the Auto sector showed a strong reversal and momentum started improving. The gap-up opening on 8 April indicated fresh buying interest from lower levels.
Price faced resistance near the 26700 zone multiple times and initially failed to sustain above it. After a healthy pullback towards the 25400 support area, buyers again stepped in and the index finally managed to break above the 26700 resistance zone.
Currently, overall market structure looks bullish with higher lows formation and improving price action. If price sustains above the breakout zone, there is probability of an upside move towards the nearest swing high zone around 28700-28800 levels.
The previous resistance zone may now act as support. Sustaining above this area will be important for continuation of bullish momentum.
Keep an eye on Auto sector stocks as strong sector momentum may lead to bullish moves in individual Auto stocks as well.
✅ If you like my analysis, please follow me here as a token of appreciation :)
in.tradingview.com/u/SatpalS/
📌 For learning and educational purposes only, not a recommendation. Please consult your financial advisor before investing.
Momentum in Amber Enterprises LtdFuture Segment Stock
Consumer Durables Sector Stock
Amber Enterprises India Ltd is showing a clear setup—an earlier uptrend, followed by a wide sideways range forming a head-and-shoulders pattern, and now a breakout with a textbook retest.
More importantly, the weekly RSI breakout suggests strong momentum can continue in the near term.
Caution: This is an F&O stock with relatively low liquidity and can be highly volatile, especially around results.
Note: This analysis is for educational purposes only and is not intended as a recommendation or trading advice.
# NLCINDIA NLC INDIA LIMITED
Multi-month consolidation breakout with strong volume expansion on weekly timeframe. Stock has given a clean breakout above major resistance zone after long accumulation.
Entry: Above ₹330 weekly closing basis
Stop Loss: ₹311
Targets:
🎯 Target: ₹419
Why this setup looks strong?
✅ Strong weekly candle breakout
✅ Volume expansion confirming buying interest
✅ Price trading above 21EMA & 50EMA
✅ Higher high – higher low structure intact
✅ Long consolidation breakout generally leads to strong trending move
Risk Reward:
Approx 1:3+ setup from breakout zone.
Trading Plan:
Wait for sustained move above breakout area and manage position with trailing upto 419.
⚠️ Disclaimer:
This post is shared only for educational and learning purposes. Charts, levels, and analysis are personal views and not investment advice or a recommendation to buy/sell any stock. Please do your own research and consult your financial advisor before taking any trade. Trading and investing in the stock market involve financial risk.
BHEL - Long Setup ONBHEL , after reaching to Resistance 3, stock may face some supply zone near to level 358 .
Technical indicators, RSI, MACD and ADX suggest lone bullish trend which may allow stock to reach next resistance which place at 450 level. While previous resistance will be primary support for this move.
Disclaimer : This analysis is intended solely for educational and informational purposes. It does not constitute financial advice or a recommendation to buy, sell, or hold any security. Market participants should evaluate risks independently and consult a licensed financial professional before making investment decisions.
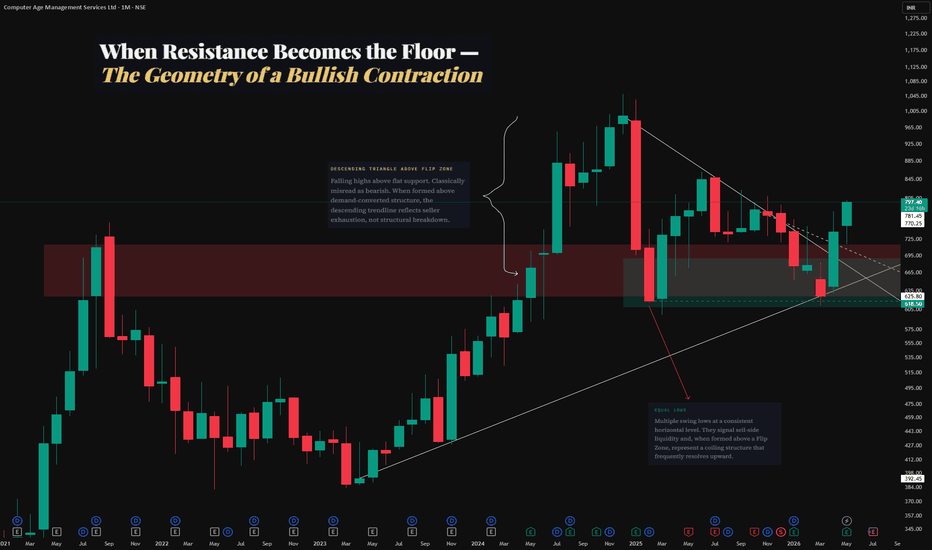
The Geometry of a Contraction Pattern01 The Anatomy of a Flip Zone
A Flip Zone is one of the most structurally significant phenomena in technical price action analysis. It describes a price zone,most meaningful when observed on the monthly time frame, that first acted as a formidable resistance ceiling over multiple touches, and subsequently, following a decisive Breakout Candle, requalified itself as a demand zone beneath price.
The mechanism is grounded in market memory. Institutional participants who previously defended that resistance level now shift their posture: the same supply that capped price on the way up becomes the structural support that cushions any retest on the way down. This conversion is not instantaneous - it is confirmed by how price behaves on its return visit to the zone.
Core Principle
A Flip Zone is not a line. It is a contextual reclassification of a prior supply cluster — validated only when price revisits the zone and structure holds.
02 The Breakout Candle — Structural Reclassification
The catalyst for the flip is the Breakout Candle: a high-momentum close that absorbs the overhead supply and clears the prior resistance zone with authority. This candle represents a decisive shift in the demand-supply equilibrium, What makes this candle consequential on the monthly time frame is the weight of the timeframe itself.
Structural Note
The quality of the flip is directly proportional to the quality of the breakout. A convincing, high-volume breakout candle creates a more structurally robust demand zone upon retest.
03 The Descending Triangle
Classical technical analysis characterizes the Descending Triangle as a bearish continuation pattern — a series of lower highs pressing against a horizontal support floor, with the implication of a downside breakdown. This characterization is correct in isolation.
The critical word is isolation.
When a descending triangle forms above a validated monthly Flip Zone, following a one-sided bullish rally, the structural context inverts the conventional expectation. What appears as distribution or topping is, in fact, a contraction pattern — price digesting its own momentum, compressing within a range where demand is structurally anchored beneath it.
Published for educational purposes only.
All concepts — Flip Zone, Equal Highs, Equal Lows, Descending Triangle, Breakout Candle — are referenced in the context of historical price structure analysis.
This is not financial advice. Past price behavior does not determine future outcomes.
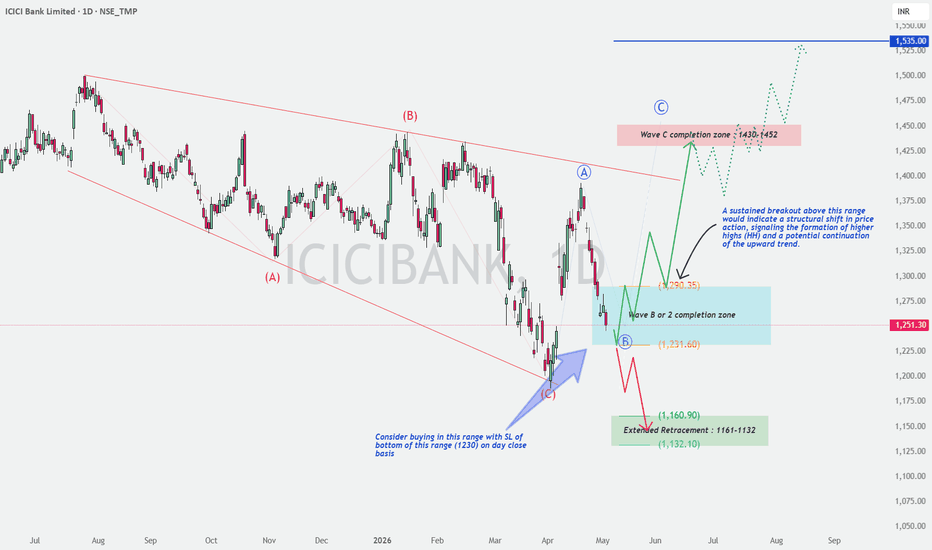
ICICIBANK : Time to buy? Outlook and Wave analysisThis analysis explores the current price action of ICICI Bank on the daily timeframe, focusing on structural transitions and potential wave completions. 📈
🔍 Technical Observation: The Corrective Phase
ICICI Bank has been operating within a large Descending Broadening Wedge pattern since late 2025. This structure typically represents a period of high volatility and corrective price action. Based on the chart, we have observed a completed ABC corrective cycle:
Wave (A): The initial downward impulse.
Wave (B): A corrective rally toward the upper trendline.
Wave (C): A final flush that bottomed out near the 1200 level in early April.
🏗️ Current Structure: The "Wave B or 2" Zone
Following the bounce from the Wave (C) lows, the price is currently navigating a critical decision zone. We are identifying the range between 1231.60 and 1290.35 as the "Wave B or 2 Completion Zone."
Educational Insight: 📘
If the price sustains above this zone, we transition into a bullish Wave 3 or Wave C impulse.
A failure to hold the lower boundary of this range suggests an Extended Retracement toward the 1132–1161 support cluster.
🎯 Key Levels & Trading Logic
Accumulation Zone: Consider entries within the current blue shaded box (approx. 1230–1250).
Risk Management: A strict stop-loss (SL) is recommended below the bottom of this range (1230) on a daily closing basis.
Bullish Confirmation: A sustained breakout above 1290.35 would indicate a structural shift, signaling the formation of Higher Highs (HH) and a potential rally toward the primary target zone.
Target Zone: 1430 – 1452 (Wave C completion zone), with an ultimate structural target of 1535.
🛡️ Risk Management Note
Trading corrective structures requires patience. Always wait for the price to react at defined zones rather than anticipating the move. Volume expansion on a breakout above 1290 will be the primary confirmation of bullish intent.
Disclaimer: I am not a SEBI-registered analyst. This analysis is for educational purposes only and does not constitute financial advice. Please conduct your own research or consult a certified professional before trading.
Disclaimer: Educational purposes only. Not SEBI registered.
NAM INDIA – Breakout Setup in ActionStock has been respecting a horizontal channel for a long time, with clear:
✔ Support zone near 780–800
✔ Resistance zone around 990–1000
After multiple rejections from the resistance (lower highs visible), price finally gave a strong breakout above 995 with momentum 🔥
What stands out:
✔ Multiple touches confirm strong base formation
✔ Sharp pullback followed by higher low near support
✔ Strong bullish candles leading into breakout
✔ Retest + hold near breakout zone (healthy sign)
Current View:
Price sustaining above 1000 zone = strength continues
This is a classic range breakout → trend continuation setup
Possible Scenario:
➡ Above 1000–1020: Momentum can push towards 1150–1200 zone
➡ Breakdown below 990: Weakness, possible retest of range
Trading Insight:
This is how strong moves begin —
👉 Long consolidation
👉 Clean breakout
👉 Retest
👉 Expansion p
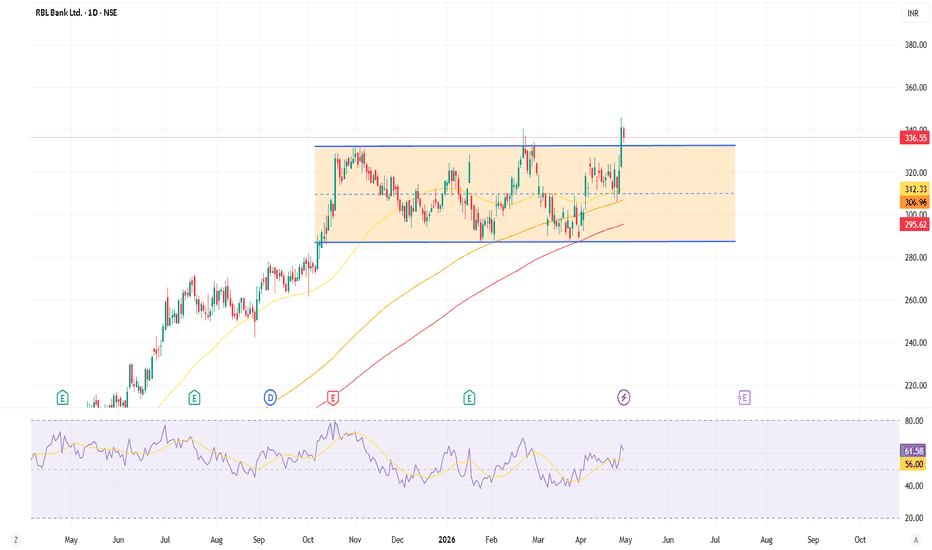
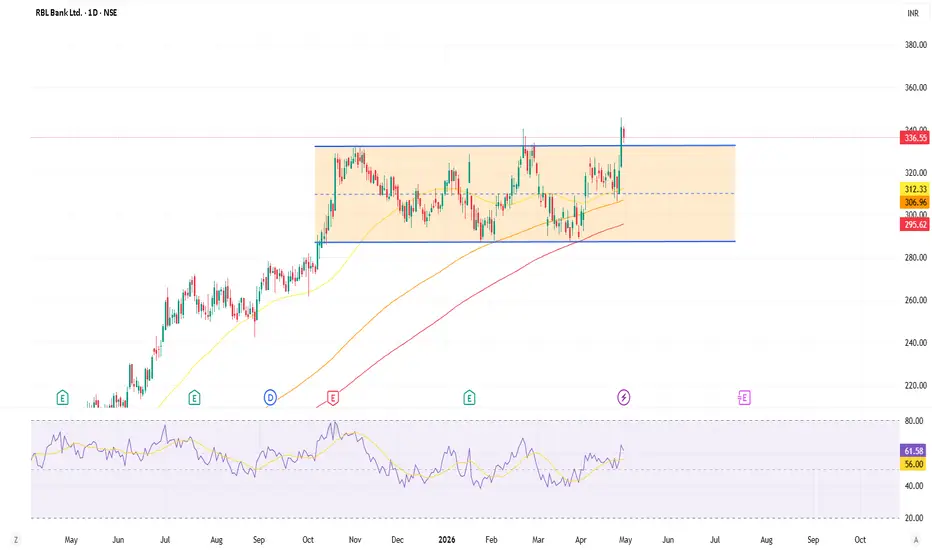
RBLBANKThe chart is self-explanatory and is shared for educational purposes.
RBLBANK has recently delivered a strong breakout from a long-term consolidation range (rectangle pattern). The stock is consistently trading above its key moving averages, with the 50, 150, and 200-period lines showing a positive slope.
Following the breakout above the resistance zone, the price action suggests that previous resistance is now acting as a floor. With the RSI maintaining positive momentum, the upward trend appears likely to continue as long as it holds above the breakout level.
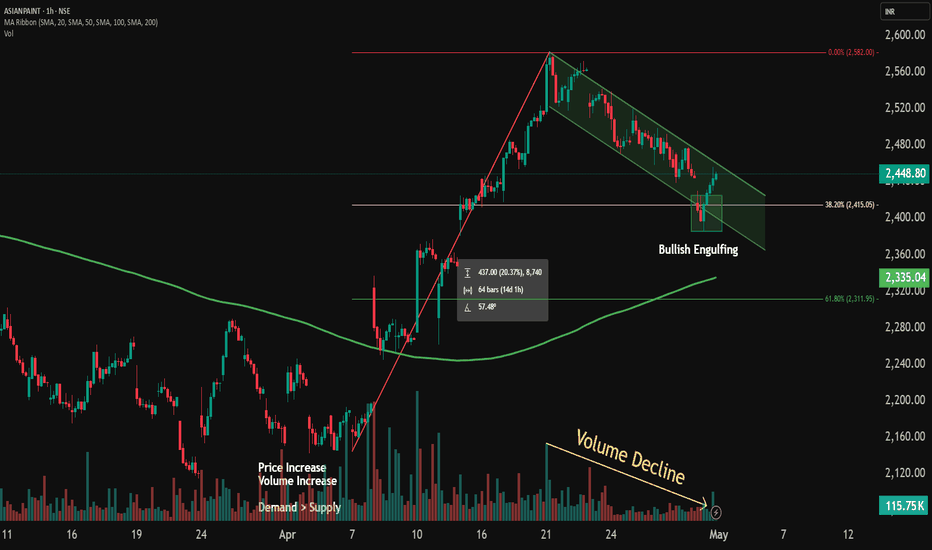
Asian Paints Ltd – Bullish Flag Setup (Hourly Timeframe)Stock: Asian Paints Ltd
Timeframe: 1 Hour
Setup Type: Bullish Flag with Pole
Technical Observation
Asian Paints is currently forming a Bullish Flag pattern on the hourly chart.
A strong bullish pole was created with large green candles supported by rising volume, indicating strong demand.
After the impulsive move, price entered a flag consolidation phase starting from 21st April.
The correction retraced approximately 38.2% Fibonacci level, which is a healthy pullback in an uptrend.
At this key level, a bullish engulfing candle appeared, suggesting buyers are stepping back into the market.
During the flag formation, volume declined gradually, indicating that the move is likely profit booking rather than trend reversal.
📈 Trend Confirmation
Price is trading above the 200 Moving Average, confirming the overall trend remains bullish.
Market structure supports continuation after consolidation.
🎯 Trade Plan
Entry: On breakout of the Bullish Flag (confirmation candle close)
Stop Loss: Below the flag low
Target: Measured move based on pole length projected from breakout point
⚠️ Expectation
If price sustains momentum and breaks above the flag resistance, we can expect a continuation of the uptrend with strong upside potential.
🧠 Conclusion
This setup reflects a classic institutional accumulation and continuation pattern.
Patience is key — wait for a confirmed breakout before initiating the trade.
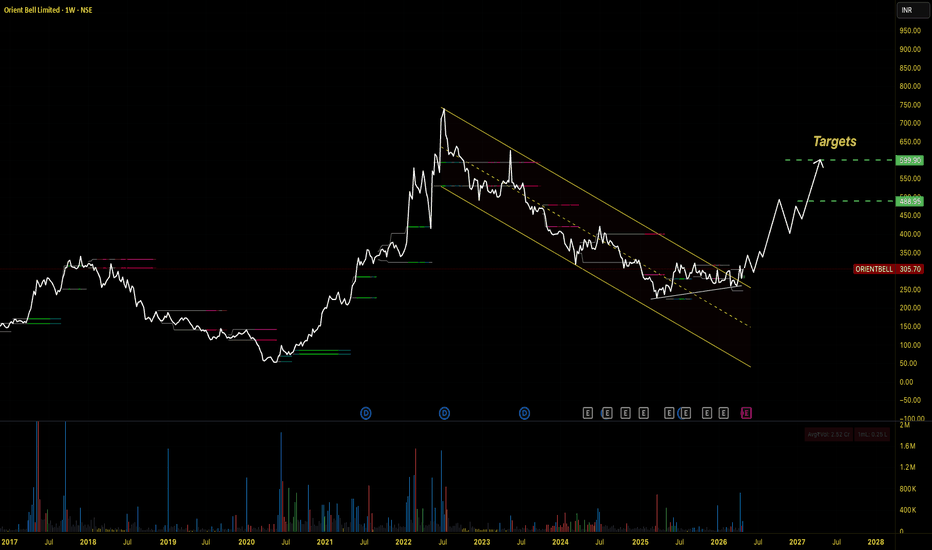
Orient Bell — Descending Wedge Breakout After 3-Year Downtrend Orient Bell has spent roughly 3 years (mid-2022 to early 2025) inside a well-defined descending wedge — a classically bullish compression pattern after a steep corrective decline from ~750 highs.
What's changed: Price is now breaking above the upper trendline of the wedge with expanding volume and weekly momentum turning. This week's +9% candle is the clearest structural confirmation since the downtrend began.
Targets:
T1: ₹488.95 (prior consolidation zone + wedge measured move)
T2: ₹599.90 (pre-breakdown supply zone)
T3: ₹700 (prior cycle highs)
Invalidation: Weekly close back below ₹250–240 (back inside the wedge) negates the breakout thesis.
Fundamental context: Orient Bell operates in the tiles segment, a cyclical play on real estate and housing demand. Kajaria Ceramics posted a good set of Q4FY26 results breaking a 4-quarter streak of volume stagnation, Mr. Ashok Kajaria mentioned that they saw recovery in demand and expect it to continue this financial year. Many players in Morbi have shut down operations due to high gas prices, labor issues and poor cash flows. He mentioned this would be beneficial for branded tile companies with multiple plant location. Orient Bell should also benefit from this tailwind, valuation is also dirt cheap as it's trading at 0.6x Mcap to Sales.
This is a technical setup note. Not investment advice. Do your own due diligence.
Reliance Date 01.05.2026
Reliance
Timeframe : Weekly
Cmp 1430
Target :- Looks like 20% upside from here
(Technical + Fundamental)
(1) Free Cash Flow (FCF) Positive: For the first time in decades, all major verticals—Energy, Retail, and Telecom—are projected to turn FCF positive simultaneously in 2026
(2) Reliance's Jamnagar refinery is one of the few in the world with a high enough Nelson Complexity Index (21.1) to process "hard sour" (heavy, high-sulfur, and acidic) crude like Venezuela's Merey grade.
(3) Because this oil is difficult to refine, it typically trades at a $6.50 – $8.00 discount per barrel compared to Brent crude. Therefore, this could add $3–$4 per barrel to RIL's Gross Refining Margins (GRMs).
(4) India's Venezuelan oil imports reached a six-year high. India received between 10 million and 12.5 million barrels of Venezuelan crude in April 2026. This is the highest monthly volume since February 2020
(5) Expected tariff hikes (approx. 15%) and the migration of users to higher ARPU (Average Revenue Per User) plans are set to drive 18%+ EBITDA growth in Jio.
(6) The retail arm is currently being optimized through store consolidations and a push into high-margin FMCG and Quick Commerce (JioMart), followed by IPO soon.
(7) India's retail market is set to cross $1.4 trillion by 2027. RIL is the primary proxy for this growth, with its retail EBITDA projected to nearly double.
Regards,
Ankur Singh
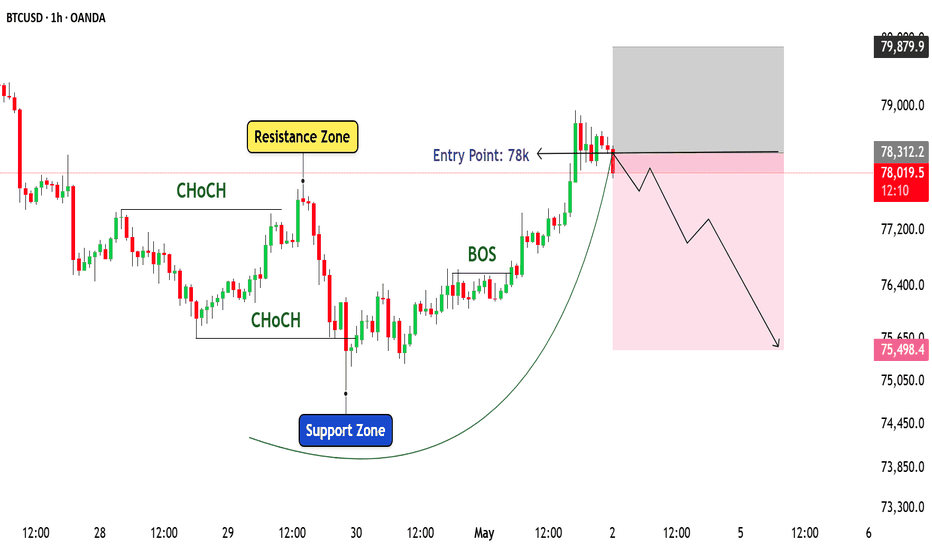
Bitcoin Range View: 78K to 75K Move ExpectedHi Traders, I hope you are doing well.
As today is Saturday, Bitcoin usually moves in a small range because market activity is low. Right now, price is near a strong resistance around 78K after a good upward move.
At this level, price is slowing down, which means sellers can enter here. If Bitcoin is not able to stay above 78K, then we may see a downward move.
As per simple view, price can fall towards the 75K area, which is a previous support zone. So, 78K is acting like a selling area, and 75K is a buying area.
If price stays above 78K and moves sideways, then the range can continue instead of falling. So, it is better to wait for clear confirmation before taking any trade.
This is only for learning purpose. Always manage your risk and avoid trading without proper plan.