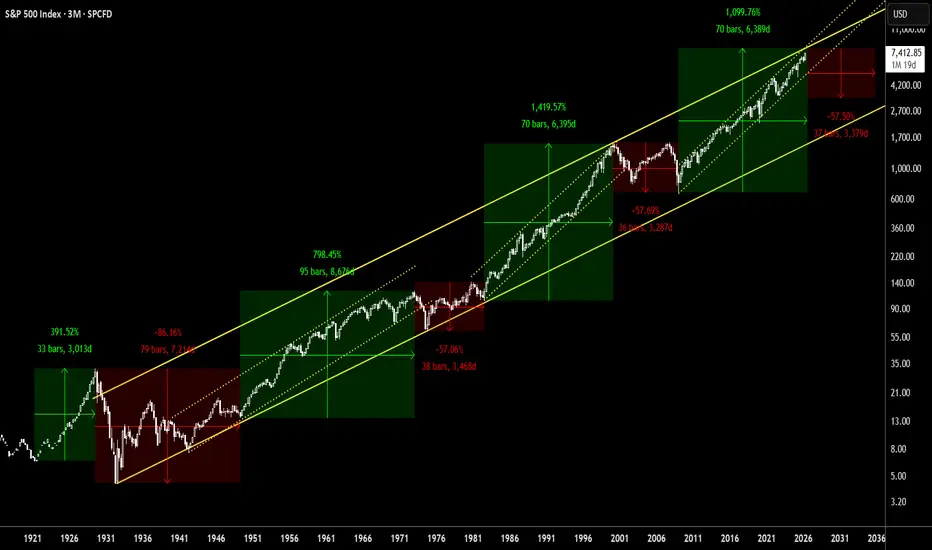
Lost Decade for the S&P 500 coming?The fierce rally in the SP:SPX is rapidly approaching upper part of the century-old trend line, as well as a decade-and-half old trend line.
This is an extremely rare moment where the froth in the markets are at the dangerously high levels. If history patterns are to be believed, we may enter a 9-10 years of lull markets with non-positive returns.
At between 7500-8000 level, the index may start going sideways before undergoing its overdue correction. Thus, 3500-8000 may become a large si
Community ideas
Ajanta Pharma (D): Bullish (Apex Squeeze & Pre-Breakout Setup)Timeframe: Daily | Scale: Linear
Ajanta Pharma is coiled in a massive compression zone, tightly squeezing against key historical resistance levels. Backed by excellent quarterly earnings and strong institutional accumulation, the probability of an upside breakout is highly elevated.
🚀 1. The Fundamental Catalyst (The "Fuel")
The rising volume and persistent upward pressure are directly linked to the recent Q4 performance:
> Earnings Beat: Strong top-line and bottom-line growth confirms t
Nifty at a Crucial Retest Zone: Bounce Back or Bigger Breakdown?Nifty is currently trading at one of the most important technical zones on the weekly timeframe. After facing rejection from the major resistance area near 26,000, the index witnessed a sharp correction and has now returned to its long-term rising support trendline. Interestingly, the previous support area is now behaving like resistance, which makes this region a critical decision point for the market.
The highlighted zone around 23,000–24,000 will likely decide the next major move. If buyers
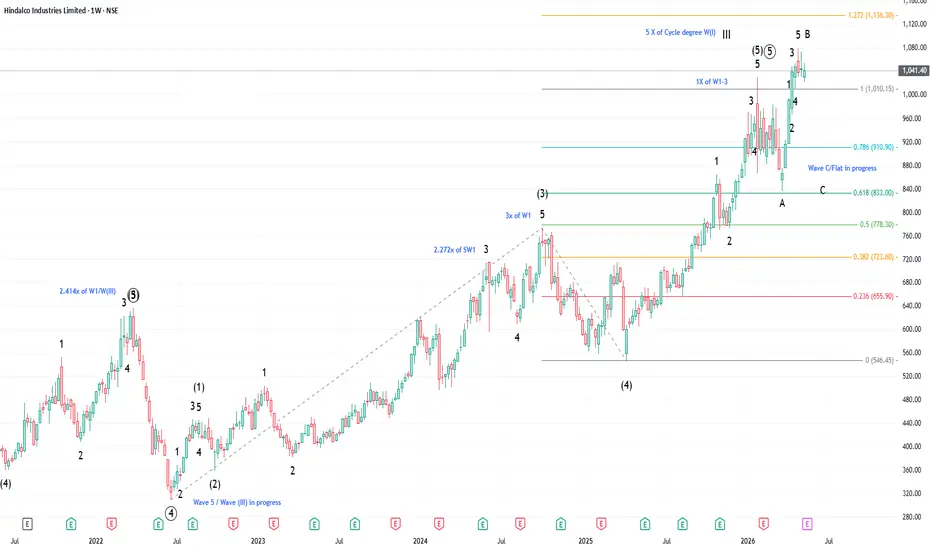
Hindalco Exit / Potential Wave 5 of primary degree completion
Weekly chart
Wave (III) of cycle degree has been in progress since Feb 2016.
Wave 1 (primary degree)/Wave (III) was completed in Jan 2018
Wave 2 (primary degree)/Wave (III) was completed in Mar 2020 (Zigzag)
Wave 3 (primary degree)/Wave (III) was completed in Mar 2022
Wave 3 formed at 2.414 X of Wave 1 (extended wave)
Wave 4 (primary degree)/Wave (III) was completed on 20 Jun 2022 (Zigzag)
Wave 5 (primary degree)/Wave (III) has been in progress since. The chart shows Wave 5 formation.
Detai
Natural gas mcxcrossing and closing strong day above 5 month downtrend line strong base made near 250 price range next resistance comes around 325 if manages to strong close above this levels can see big move in future towards 370-400 range in coming 3-4 month this is just view and not recommendation as NG next contract has too much premium .(This to be consider as just trend anticipation view .This are my personal views i might be wrong to .)
BTCUSD Pennant Structure | Waiting For FMFR SetupThe market is currently trapped inside a pennant structure, creating a compressed price range where both sides are active.
My main expectation here is an FMFR setup — First Move Fake Than Reversal. In this type of structure, the first breakout move is often a fake move before the market reverses strongly in the opposite direction.
Because of that, I am not measuring the full move yet. First, I want to see which side the market chooses for the initial fake breakout. Once that fake move appears,
#NLC - ATH BREAKOUT WITH SYMMETRICAL TRIANGLE PATTERN FORMATION🚀 Trade Idea: NLC
📍 Setup: ATH BREAKOUT WITH SYMMETRICAL TRIANGLE FORMATION IN MONTHLY TIMEFRAME
⚡Setup Quality: A
📈 Entry: Above ₹328
🛑 SL: ₹260
🎯 Targets: ₹390 / ₹440 / ₹510
ALPHA SETUP RATING:
OVERALL MARKET SCORE: 19/25 NEUTRAL
PRICE ACTION SCORE: 23/25 BULLISH
VOLUME SCORE: 22/25 BULLISH
MOMENTUM SCORE: 24/25 BULLISH
OVERALL SCORE: 88/100 A SETUP
NLC is expected to jump to the levels of 500 in the coming months as indicated by the price chart. Our personalised stock rating system has give
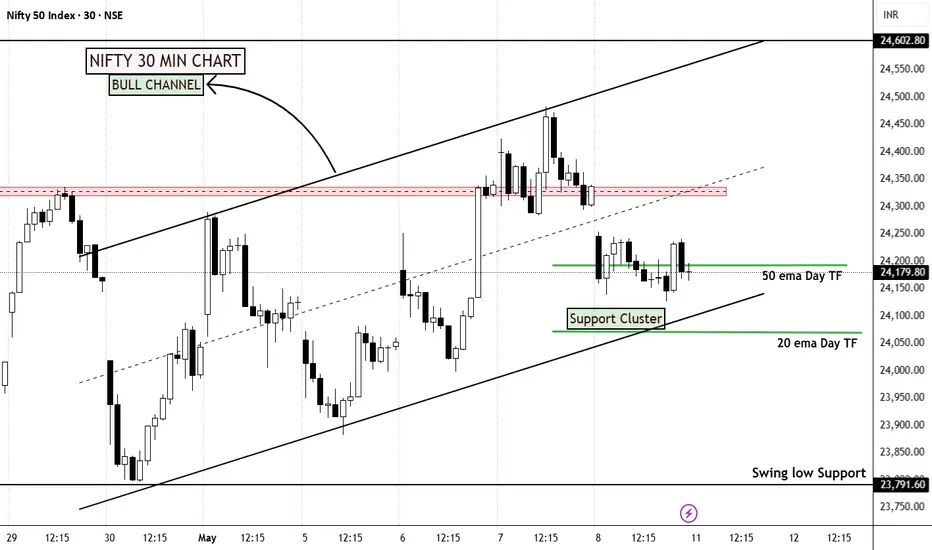
Nifty50 Short Term Analysis NSE:NIFTY 30 MIN CHART Analysis 📊
➖After Friday’s gap down opening, market spent the whole session in a tight range — showing clear indecision near important support zones.
👉Price is now trading near:
• Bull channel support
• 20 EMA Day TF
• 50 EMA Day TF
This creates a strong short-term support cluster.
👉Nifty Support Levels
24150–
24050 – EMA support cluster
23790 – Swing low support
👉Nifty Resistance Levels
24330 – Immediate resistance zone
24600 – Major supply zone
⚡️VIEW :-
• Marke
Nifty - Weekly Review May 11 to May 15The price is moving within the range of 23900 to 24480. Wide range movement is hard to break as the price can consolidate in this range for many days, unless there is some news to move the market.
Buy above 24140 with the stop loss of 24080 for the targets 24180, 24240, 24300, 24360, 24440, 24500, 24580 and 24620.
Sell below 23880 with the stop loss of 23940 for the targets of 23840, 23780, 23720, 23660, 23600 and 23520.
As per the daily chart, the price is neutral.
Always do your analysis befo
RVNL might move UpsideWith market stabilizing , we might see sector rotation and a potential move in railways sector. These are the technical reason/logic to support it.
1) Higher High and higher low formation indicating UPSIDE momentum
2) Trading above 50 & 20 EMA
3) Gap Cover Pending
4) Volume increased in recent days
5) Higher TF in weekly Pole & flag pattern formation
6) Favorable Risk Reward
(Note: I am neither responsible for anyone's profit or loss nor I'm a sebi registered RA, this only for educational pu
USDCAD: H4 Bearish CRT Retracement PlayThe displacement already happened.
Now the market is deciding whether this is reaccumulation… or redistribution.
USDCAD printed a clear H4 Bearish CRT, shifting the short-term narrative and establishing a defined dealing range between the candle’s high and low. Right now, price is rotating lower after the impulse, and the focus shifts toward how it reacts around the equilibrium.
Current framework:
H4 Bearish CRT established
Price expected to retrace toward the 50% equilibrium of the CRT candl
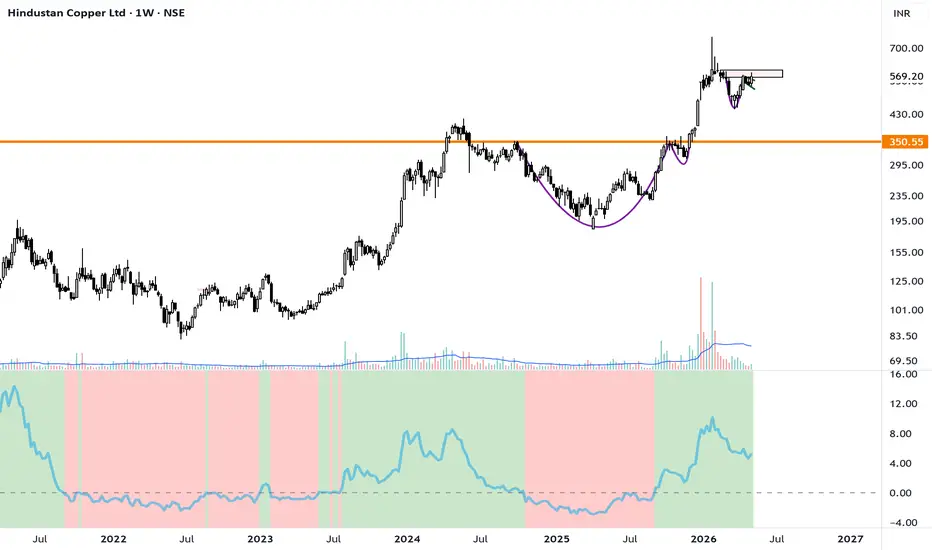
HINDCOPPER: Base-on-Base Breakout SetupThe Core Thesis: Absorption at All-Time Highs
Hindustan Copper is exhibiting textbook Stage 2 leadership. After a massive impulse move earlier this year, the stock has spent several weeks consolidating in a tight Stage 2 Base. The "squat" observed over the last two weeks—narrow price action on low volume—is a strong signal that selling pressure has dried up and institutional hands are in control.
Technical Breakdown
Moving Average Alignment: The stock is in a "Perfect Stack." It is trad
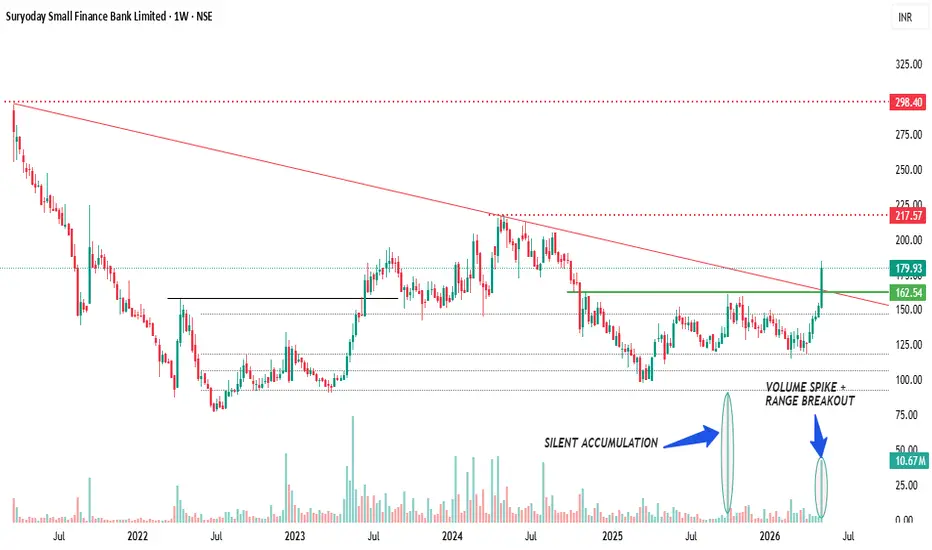
Suryoday Small Finance Bank – Long-Term Breakout SetupSuryoday Small Finance Bank – Long-Term Breakout Setup (1W Chart)
Key Observations
1. Multi-month consolidation between ₹125 – ₹160 has been broken decisively.
2. Strong bullish weekly candle supported by a massive volume spike.
3. Price has also moved above the long-term descending trendline resistance.
4. Accumulation signs were visible for several months before the breakout.
5. Momentum structure now favors bulls as long as price sustains above breakout levels.
Important Levels
a. Immedia
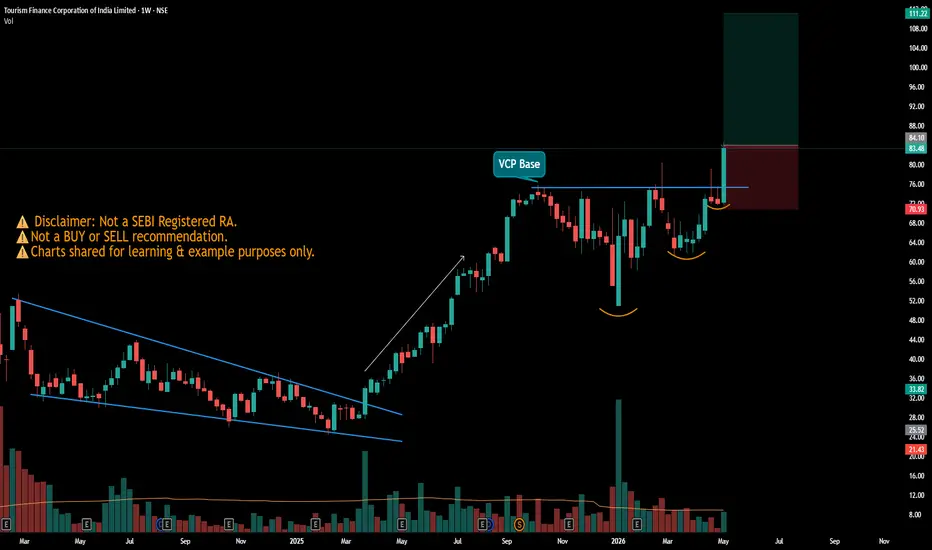
#TFCILTD - BreakOut in Weekly Time FrameScript: TFCILTD
Key highlights: 💡⚡
📈 BreakOut in Weekly Time Frame
📈 Volume is less during Breakout (Negative)
📈 RS making 52WH
📈 MACD Bounce
If you have any doubts about the setup, drop a comment and I’ll reply.
✅ Boost and Follow to never miss a new idea!✅
⚠️ Important: Always Exit the trade before any Event.
⚠️ Important: Always maintain your Risk:Reward Ratio as 1:2, with this RR, you only need a 33% win rate to Breakeven.
⚠️Disclaimer: I’m not SEBI Registered RA. Charts shared for lear
1-hour chart analysis for Bitcoin/TetherUS Perpetual (BTCUSDT.P)Bullish Scenario: If the $79,500 area holds without strong candle closes below it, a retest of the local highs at $82,000 and eventually $84,500 is likely.
Strategy: Look for a "Sweep and Reclaim" or a bullish engulfing candle within the reversal area before entering. Always follow the 1% risk management rule for capital
Structure: After a strong rally from roughly $78,000, Bitcoin encountered heavy resistance near the $82,800 local high. The subsequent "Curve Line" (arch-like pattern) represe
Grasim Industries: A Titan Reclaiming Its PeakGrasim Industries Ltd (NSE: GRASIM) is currently one of the most compelling stories in the Indian large-cap space. As the flagship company of the Aditya Birla Group, it has evolved from a simple textile manufacturer into a diversified powerhouse with dominant positions in Viscose Staple Fibre (VSF), Chemicals, and building materials through its subsidiary, UltraTech Cement.
As of May 8, 2026, the stock is trading near ₹2,968, reflecting a robust recovery and a strategic pivot toward new growth e
BTC Holding Key Demand Zone – Is $82.8K the Next Target?Bitcoin is once again showing strong bullish intent after successfully defending a major demand zone near the previous resistance area. The recent pullback appears healthy rather than bearish, and buyers are slowly regaining control above support.
The chart clearly shows that BTC respected the same resistance zone multiple times in the past before finally breaking above it. Now that area is acting as support, which is a classic bullish retest structure.
Market Structure Analysis
BTC previou
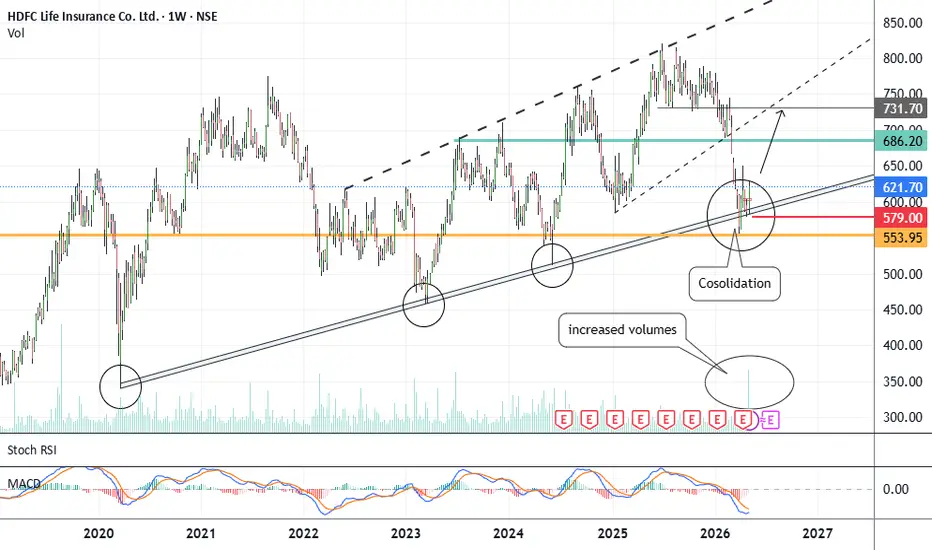
HDFC Life - Near SupportsCMP 621.70 on 09.05.026
A sharp fall was seen in the stock price in recent weeks. Now it has been consolidating around the long term support projection around 580.
If sustains above 580, may go into a bullish phase ahead depending on the market conditions. Targets may be 680/730 or more.
The risk reward ration seems good around the present price. The setup fails if sustains below 580.
This illustration is solely my own view. It is shared for educational purposes. It is not a buy or sell recomme
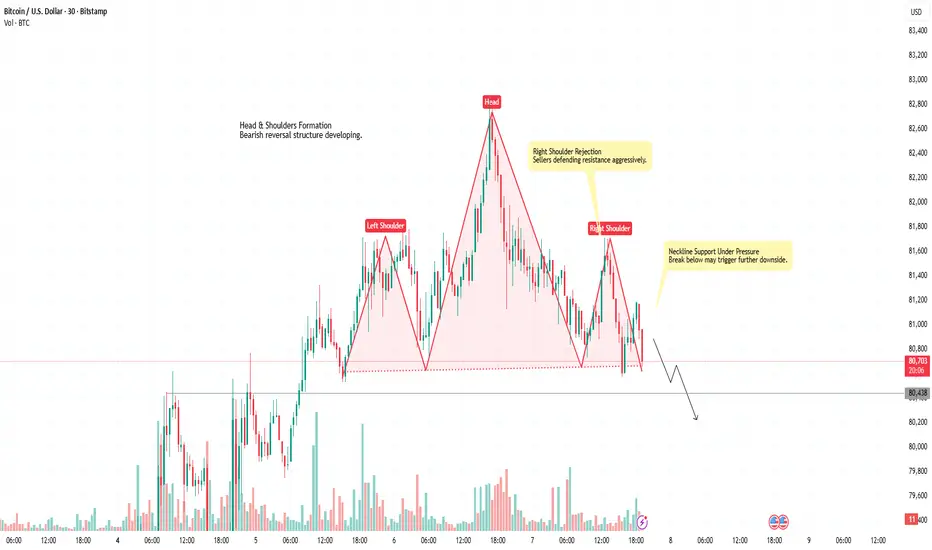
BTC Head & Shoulders Breakdown SetupBitcoin is showing signs of weakness after forming a textbook head & shoulders pattern near the local highs. The right shoulder failed to create a higher high, indicating fading bullish momentum and increasing seller control.
Price is currently reacting around the neckline support near 80,600. A strong candle close below this area could confirm the bearish breakdown and open the path toward lower support zones. Volume structure also suggests reduced buying pressure after the head formation.
A
BHARATFORG Price ActionThere are only 2 types of trading
1. Breakout &
2. Reversal
Chart does not require too much explanation for any idea, i post
BHARATFORG is in a strong bullish trend today after a sharp move higher.
Price is trading near the upper end of the day’s range, which shows buyers are still in control.
The stock is extended above its short-term averages, so momentum is strong but also a bit stretched.
That means continuation is possible, but pullbacks can be sharp.
If it holds above the breakout area,
NIFTY AUTO INDEXNIFTY AUTO INDEX
After making a low near 23560, the Auto sector showed a strong reversal and momentum started improving. The gap-up opening on 8 April indicated fresh buying interest from lower levels.
Price faced resistance near the 26700 zone multiple times and initially failed to sustain above it. After a healthy pullback towards the 25400 support area, buyers again stepped in and the index finally managed to break above the 26700 resistance zone.
Currently, overall market structure looks
Momentum in Amber Enterprises LtdFuture Segment Stock
Consumer Durables Sector Stock
Amber Enterprises India Ltd is showing a clear setup—an earlier uptrend, followed by a wide sideways range forming a head-and-shoulders pattern, and now a breakout with a textbook retest.
More importantly, the weekly RSI breakout suggests strong momentum can continue in the near term.
Caution: This is an F&O stock with relatively low liquidity and can be highly volatile, especially around results.
Note: This analysis is for educational purposes
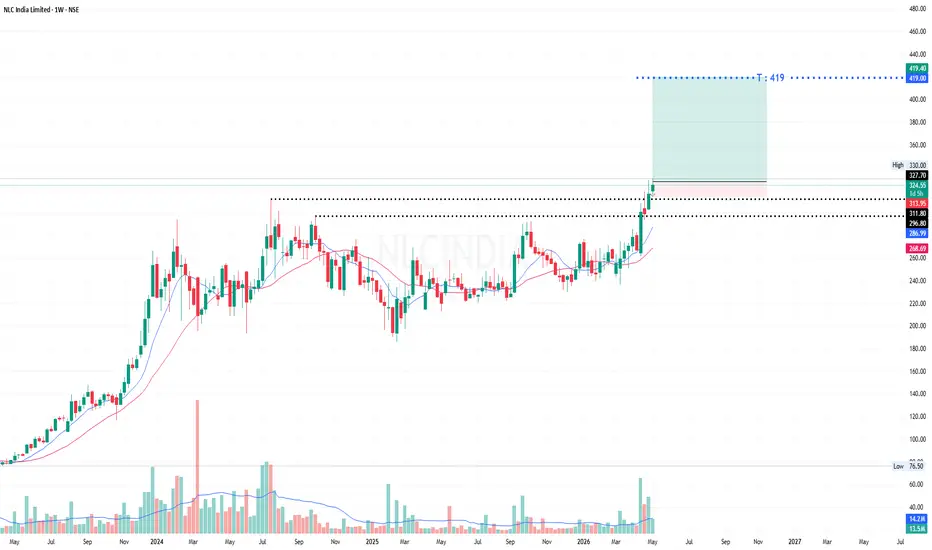
# NLCINDIA NLC INDIA LIMITED
Multi-month consolidation breakout with strong volume expansion on weekly timeframe. Stock has given a clean breakout above major resistance zone after long accumulation.
Entry: Above ₹330 weekly closing basis
Stop Loss: ₹311
Targets:
🎯 Target: ₹419
Why this setup looks strong?
✅ Strong weekly candle breakout
✅ Volume expansion confirming buying interest
✅ Price trading above 21EMA & 50EMA
✅ Higher high – higher low structure intact
✅ Long consolidation breakout general
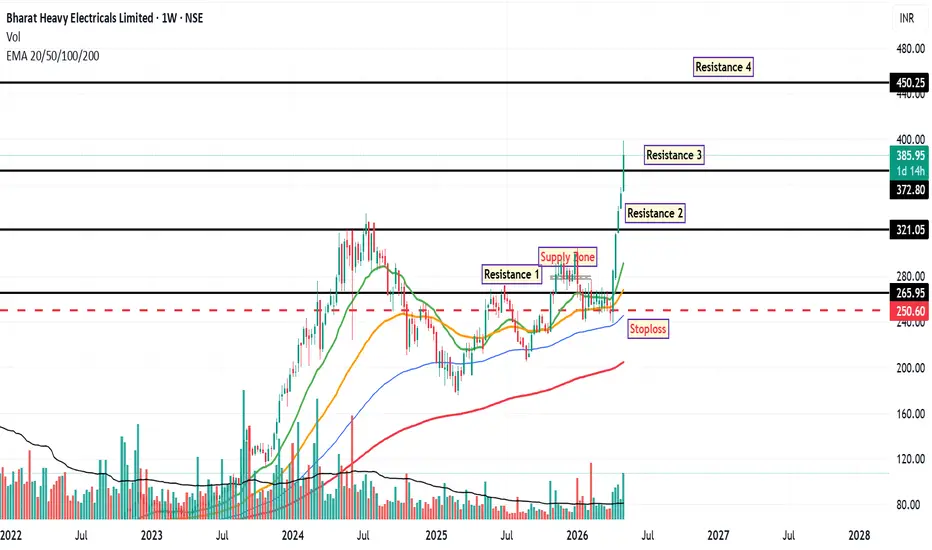
BHEL - Long Setup ONBHEL , after reaching to Resistance 3, stock may face some supply zone near to level 358 .
Technical indicators, RSI, MACD and ADX suggest lone bullish trend which may allow stock to reach next resistance which place at 450 level. While previous resistance will be primary support for this move.
Disclaimer : This analysis is intended solely for educational and informational purposes. It does not constitute financial advice or a recommendation to buy, sell, or hold any security. Market part