Nifty 50 Swing Trading setup - RRR 1:3Nifty swing trading setup analysis through Elliott wave Downside risk max 200 points target 600 point reaching possible on before 02/01/2026 maximum hold 2 weeks this setup useful for swing traders so go long at 25900-25800 Risk reward is good 1:3 Happy trading Journey
Community ideas
ICICIBANK – Bullish Setup (Short-Term)ICICIBANK – Bullish Setup (Short-Term)
ICICIBANK is showing strength and holding above key support.
Price action suggests a continuation move on the upside.
📈 Outlook: Bullish
🎯 Target: 1386 (short-term)
🛑 SL: Below recent swing low
Momentum looks positive; expecting price to move higher in the coming session.
ACC | On the Verge of a Breakdown? | Daily Chart | Bearish Bias
📉 Summary
ACC has been compressing into a descending structure, forming Lower Highs since 24 April 2025, while holding Equal Lows near ₹1770 since 03 March 2025.
Repeated tests (4+ times) of the same support zone have reduced its strength, hinting at a potential breakdown setup.
Price action suggests sellers are absorbing demand every time the stock revisits this level — a classic bearish continuation structure.
📌 Structure Breakdown
1. Lower Highs (24/04/2025 onward)
- Each rally has been weaker than the previous one - Shows sustained supply and lack of aggressive buyers.
2. Equal Lows at ₹1770 (03/03/2025 onward)
- Multiple tests → Support weakening.
Hammer-type candles here indicate buying attempts, not strength — repeated hammers near support often show demand exhaustion, not reversal.
3. No Recent Swing Lows
- Due to tight compression, reference swings are taken from the 2023 structure, which aligns well with projected breakdown targets.
📉 Trade View: Bearish (Daily Time Frame)
🔻 Breakdown Conditions (Mandatory)
Enter ONLY IF:
✔ Price closes below ₹1770
✔ Breakdown candle is a Thick Red Marubozu
✔ Volume is higher than the 20-day average
✔ Close is below support, not just an intraday wick violation
This ensures you avoid a fake breakdown and enter only on momentum.
🎯 Bearish Targets (Based on 2023 swing levels)
1️⃣ ₹1730 – Initial target
2️⃣ ₹1680 – Next demand zone
3️⃣ ₹1570 – Major swing support from 2023; final target
Targets align with earlier swing reaction zones where price historically paused or reversed.
🛑 Stop Loss
Stop Loss:
High of the Breakdown Candle
(not the previous swing high — too far, reduces R:R)
This keeps the trade logical, tight, and rule-based.
📉 Final Thoughts
- ACC is nearing a classic descending compression pattern.
A decisive break below ₹1770 could open a clean downside move toward the mentioned targets.
But no breakdown → no trade.
Wait for confirmation — momentum + volume + structure alignment.
📝 Disclaimer
This analysis is created purely for educational and informational purposes and reflects my personal view based on simple price-action rules.
It is NOT investment advice.
Please do your own research or consult a registered financial advisor before taking any trade.
Trading and investing in the stock market involve risk. Manage your position size and follow strict stop losses.
📢 Support the Idea
If you found this analysis helpful:
👍 Boost the idea
⭐ Follow me on TradingView for more price-action based setups
💬 Comment below and suggest any stock you want me to analyse next — I’ll pick the best requests for upcoming ideas!
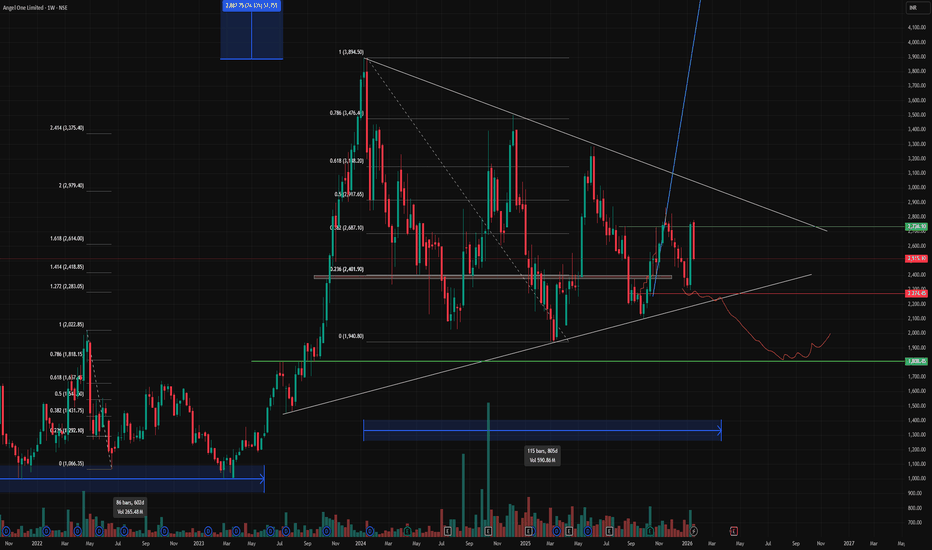
Angel One on the Edge: Long-Term Chart Points to 4800+The monthly chart of Angel One shows a well-defined broadening wedge pattern, where price has been repeatedly oscillating between a rising support line and a widening resistance zone. The structure has been forming for almost two years, indicating a long consolidation phase after a strong uptrend. Currently, the price is trading near the lower trendline support, which aligns with the long-term uptrend support. This zone is marked as the Buying Zone, suggesting that the risk-reward ratio is favourable for long-term buyers as long as the support remains intact.
A potential breakout above the upper wedge resistance may trigger a strong upside rally. The first major level on the upside is the Reversal Target around 3050, which is the initial confirmation level. If price sustains above this, the momentum may carry it towards the Breakout Target near 3500, which represents the first official breakout swing. Once this level is surpassed, the trend may accelerate towards Target 2 around 3900, indicating continuation of the long-term bullish structure. The complete projected move from the pattern height signals a Final Projected Target around 4840, which is the long-term positional upside expectation.
On the downside, the setup remains valid only while the price trades above the lower trendline region. A sustained close below the marked failure level would invalidate the pattern, signalling potential weakness and a breakdown of the long-term bullish structure. However, until that failure zone is breached, the pattern continues to favour a bullish breakout scenario with upward projections as highlighted.
Glenmark Pharma shows a strong uptrend with periodic correctionsGlenmark Pharma has been moving in a clear weekly uptrend where each strong rise has been followed by a period of consolidation before the next move. This sequence appears three times on the chart, marked as rally and correction phases.
After the most recent rise, price has entered a narrow downward channel. This forms a flag structure, which is a common type of consolidation during an ongoing trend. Volume has reduced during this period, which is normal in this kind of structure.
A break above the upper boundary of this channel may indicate that the consolidation is ending and that the trend is ready to continue. The measured distance of the previous rise has been added on the chart to show a possible future level if the trend resumes.
This idea is based entirely on the repeating structure of rally, pause and continuation that is visible on the weekly time frame.
Follow for more clean charts and structured price action studies.
VST Tillers"Here’s a quick breakdown of a beautiful daily setup on VST Tillers.
After a strong 75% move earlier, the stock spent months forming a tight re-accumulation base.
Low volatility… higher lows… and price is surfing the 8 and 21 EMAs perfectly.
Last few days?
Super tight candles… almost no volatility… that’s the market telling you something big is brewing.
We also got a clean retest with stronger volume, which shows demand stepping in and weak hands getting shaken out.
The stock is now sitting just below its all-time high — and that’s where the best breakouts happen.
Here’s my plan:
I’ll buy only if the stock breaks above 5775 with strong volume.
If it doesn’t break out… I don’t touch it.
Simple.
Patience is a position.
This is how I approach swing trading."
If you want, I can also:
Minda Corp: A Technical Breakout Story with Strong FundamentalsThe chart reveals a compelling multi-year growth trajectory. From 2013 to 2023, Minda traded within a well-defined upward channel, building a strong foundation between ₹100-400 levels. The real excitement began in 2023 when the stock broke out of a decade-long accumulation pattern.
The most significant technical development occurred in late 2024, when Minda consolidated in a rectangular pattern between ₹450-650 before breaking out decisively. This consolidation after a strong rally suggests healthy profit-booking followed by renewed institutional interest. The current price of ₹588 sits just above this breakout zone, indicating the beginning of a potential new leg upward.
Two ambitious targets have emerged from this technical setup:
Trend-based Target: ₹890 – derived from the measured move of the breakout pattern
Momentum-driven Possibility: ₹1,037 – an extended target if bullish momentum accelerates
The stock's ability to maintain above the ₹590 level (current resistance-turned-support) will be crucial for validating this breakout.
As a diversified auto component manufacturer with exposure to wiring harnesses, switches, alloy wheels, and increasingly EV components, Minda is well-positioned to benefit from both traditional automotive growth and the ongoing electrification trend . The company's partnerships with global OEMs and its expanding footprint in export markets provide additional growth levers.
Smart Money Accumulating BDL — Are You Watching This Setup?Hello Traders!
Today’s analysis is on Bharat Dynamics Ltd. (BDL) where a clear Reversal from Bottom Setup is developing. After weeks of sideways consolidation, the stock has formed a clean Rectangle Accumulation Pattern right above a strong demand zone. The latest Hammer candle appearing inside this zone adds strong confirmation that buyers are stepping in again.
Why this setup is special?
Multiple rejections from supply and repeated buying from demand create a classic accumulation range.
The recent hammer candle shows rejection of lower prices and signals potential reversal strength.
Sideways accumulation after a downtrend often leads to strong breakout rallies when demand overpowers supply.
Levels to Track:
The best entry zone lies between 1425–1410, aligning perfectly with demand. As long as price stays above 1360, the structure remains intact. On the upside, the first target sits near 1492, followed by 1560, and finally a breakout extension target around 1635, where previous supply reacts strongly.
Rahul’s Tip:
Every strong rally begins with silent accumulation. Patterns like this look slow at first, but once the breakout hits, momentum often surprises traders who were waiting too long.
(Analysis By @TraderRahulPal | More analysis & educational content on my profile. If this helped you, don’t forget to like and follow for regular updates.)
Disclaimer:
This analysis is for educational purposes only and should not be taken as financial advice. Please do your own research or consult your financial advisor before investing.
USD/CHF in Daily time frameBy Wave Analysis, Initial move to little upside for the target1 mentioned in the chart. Once the "E" wave of Triangle pattern completed, then strong impulse of downside to Target 2 is expected.
Technically the pattern is ready for big move, but fundamentally ADP and Federal fund's rate will decide the direction. If both are in alignment then perfect move of downside is expected. Or else change in structure is possible.
IGL – Structure & Pattern Breakdown🔻 1. Long Rising Trendline Breakdown
Price respected a multi-touch rising trendline, but recently:- Trendline support is broken.
Breakdown candle closed below the line Indicates shift from bullish accumulation → bearish pressure
Pattern Name: Rising Trendline Breakdown
Breakdown Level: ₹192.
🔻 2. Multi-Month Symmetrical Triangle Failed Breakout
There was a symmetrical triangle on the upper side:- Lower highs, Higher lows, Squeeze structure.
Price attempted breakout but failed, rejecting near the 200-EMA zone.
This failed breakout usually leads to opposite direction sharp move, which is visible now.
Rejection Zone: ₹205 – ₹210.
🔻 3. Major Resistance Ceiling Still Intact
The long horizontal resistance around:- ₹220
…has rejected price multiple times, forming a strong supply zone. Only a close above 220 can start a major trend reversal. As long as price stays below 220, structure remains bearish-to-sideways.
🔻 4. Current Bias: Bearish Below 192
Breakdown below the rising trendline + EMA rejection = bearish bias.
Immediate Supports:- ₹185, ₹176, ₹168.
If these levels break, move toward ₹150 zone is possible.
NALCO (W) - Strongly Bullish - Fundamentally-Driven BreakoutTimeframe: Weekly | Scale: Linear
The stock has confirmed a major structural breakout, shattering a 2-year consolidation ceiling. This move is supported by a "trifecta" of bullish factors: a technical breakout to new ATHs, rising volume, and stellar quarterly earnings.
🚀 1. The Fundamental Catalyst (The "Why")
The breakout is fueled by strong business performance, which gives the technical move high conviction:
- Stellar Earnings: The company recently reported a ~35% surge in Net Profit (YoY) for Q2 FY26, driven by higher aluminum prices and operational efficiency.
- Dividend Yield: The announcement of a ₹4/share interim dividend has attracted yield-seeking investors.
- Expansion: A massive ₹30,000 Crore investment plan for smelter expansion and lithium acquisition is driving long-term re-rating.
📈 2. The Long-Term Structure
> The "Box" Breakout:
- Range: Between ₹137 (Support) and ₹263 (Resistance) .
- Consolidation: The stock spent 4 weeks coiling just below ₹263. This "buildup" right under resistance is a classic bullish sign—it shows buyers were absorbing all supply before the breakout.
> The Breakout: This week’s 5.07% surge with 54.78 Million volume is the "Ignition." By closing at a new ATH, the stock has entered "price discovery" mode.
⚠️ 3. Technical Correction: The "Double Top" Myth
- Current Status: Since the stock has broken and closed above the previous high (₹263), the Double Top pattern is invalidated (or "busted"). A busted bearish pattern is actually a powerful bullish signal, as it forces short-sellers to cover their positions, adding fuel to the rally.
📊 4. Technical Indicators
- EMAs: The PCO (Positive Crossover) state across Monthly, Weekly, and Daily timeframes confirms the trend is synchronized.
- RSI: Rising across all timeframes. Importantly, in a strong uptrend, an RSI above 60 is a sign of strength, not necessarily "overbought."
🎯 5. Future Scenarios & Key Levels
The stock is now in Blue Sky territory.
> 🐂 Bullish Case (Continuation):
- Trigger: Sustained trading above ₹263 .
- Target: ₹330 . This aligns with the technical extension of the consolidation range height added to the breakout point.
> 🛡️ Support (The Re-test):
- Immediate Support: ₹263. The previous "ceiling" is now the "floor." Any pullback to ₹263-265 is a high-probability buying opportunity.
- Stop Loss: A close below ₹240 would imply the breakout was a "fakeout" (Bull Trap) and invalidate the thesis.
Conclusion
This is a Grade A Setup . The "Double Top" fear is gone; the resistance is broken. Backed by record profits and heavy volume, the path of least resistance is toward ₹330 . Watch for the stock to hold the ₹263 level on any dips.
HINDCOPPER – Support at 38.2% Retracement With Reversal SignalHIHINDCOPPER has respected the 38.2% Fibonacci retracement level, indicating that buyers are active at this key support zone. The formation of a reversal candle (DOJI) at this level strengthens the probability of a reversal from the recent corrective decline.
Technical Highlights
Price retraced to the 38.2% Fib level, which is a commonly watched support during strong uptrends.
Reversal candle at support suggests selling pressure is getting absorbed.
Indicates renewed buying interest and potential continuation of the primary uptrend.
If momentum sustains, price may attempt to retest:
Immediate resistance: Recent swing high
Next resistance zones: Trendline / supply zones (depending on chart structure)
Technical Signals
✅ 1. Fibonacci Confluence
Price halted exactly at the 38.2% retracement, indicating the pullback is shallow.
Shallow retracements often occur in strong bullish phases.
✅ 2. Reversal Candle at Support
The reversal candle (hammer / bullish engulfing / pin bar depending on chart) shows:
Strong buying interest
Absorption of selling pressure
Start of upward momentum shift
✅ 3. Trend Structure
Higher-highs and higher-lows still intact.
Price holding above short-term moving averages
Trading Plan
📌 Entry
Two entry methods depending on your trading style:
Aggressive Entry:
Enter near the current market price after the reversal candle confirmation.
Conservative Entry:
Enter above the high of the reversal candle to avoid false signals.
📌 Targets
Target 1:
Retest of recent swing high
➡ Short-term target
ASTER - what going to happen?📊 ASTER/USDT Update
🔎 Technical Observation:
- The pair is trading within a descending channel/falling wedge pattern, indicating a period of consolidation after a sharp decline.
- Price action shows compression near the apex of this wedge, suggesting imminent volatility.
- The chart explicitly notes that the "Higher timeframe is still bearish," implying the current structure is a pause within a larger downtrend.
⚠️ Key Levels:
- Support: 0.8891, 0.8540
- Resistance: 1.2842, 1.3872
📉 Market Outlook:
- Neutral to Bearish bias technically, but the falling wedge is often a bullish reversal pattern if validated.
- Scenarios: A breakout above the red wedge resistance could trigger a relief rally toward 1.2842. Conversely, rejection here keeps the bearish trend intact, likely testing 0.8891.
💡 Trade Idea:
- The market is at a decisive bifurcation point. The high-probability setup awaits a confirmed candle close outside the wedge. A clean break above the wedge upper trendline validates a long position targeting the imbalance at 1.2842. However, if price fails to break out and loses the wedge bottom, the bearish continuation will swiftly target 0.6000 levels as indicated by the lower projection arrow.
✅ Closing Note:
Wait for the breakout confirmation to avoid chop; manage risk tightly as volatility expands.
Hikal: Trend Shift and Key LevelsThe stock of Hikal Ltd . experienced a significant breakdown below its major support level of ₹331 in July, marking a continuation of its bearish phase. After testing the discount zone which is now major support zone, the stock rebounded sharply with high trading volume, signaling renewed buying interest and possible accumulation.
A CHOCH pattern has been observed, which often suggests a shift from bearish to bullish structure when confirmed by price and volume behaviour. The stock has managed to close and sustain above the 50-day EMA, a key indicator of short-term trend strength and potential continuation of the uptrend.
The RSI is currently above 65, indicating strong bullish momentum and approaching overbought territory. A MACD bullish crossover along with a positive histogram further reinforces the upward bias.
Nearest Resistance: Around ₹280 (marked supply zone where selling pressure may emerge)
Support Zone: Below ₹217 (critical level for trend validation)
Intermediate Demand Zone: Recent breakout area near the 50-DEMA
Disclaimer: This analysis is intended for educational and informational purposes only. It does not constitute investment advice or a recommendation to buy, sell, or hold any financial instrument. Traders and investors should conduct independent research and consult a licensed financial advisor before making any decisions.
Jubilant Foodworks Near Long Term SupportJubilant Foodworks swiftly moving in a Parallel Channel since it got listed in the secondary market. Stock respected the channel's boundaries on several occasions. Now it is very near to its support on both log & linear (caption image) charts. Support zone range from 570 to 525 for double to four times returns probably in 1 to 1.5 years’ time duration.
Trade wisely, slow market movement can test trader/investor's patience and can lead to wrong decision. Always apply logical stop-loss for capital protection.
Disclaimer: I was allotted shares in the Jubilant Foodworks IPO (~2010) and sold them prematurely at nearly 2x, lacking wisdom back then. Holding till today would have delivered ~35x returns
Maruti: Rising Flag, Dropping ProbabilityStructure
The decline into Wave W is complete as a Regular Flat.
The rebound is a corrective Wave X, fully overlapping and contained within a rising channel.
Bias remains bearish as long as price trades inside this channel.
Wave Y Setup
Trigger: Breakdown below the channel near 16000.
Entry: Preferable after a break and retest of the lower channel line.
Target: Toward 15,260 to complete Wave Y.
Invalidation: A decisive close above 16,549 invalidates the bearish view.
Summary
The current rise is a corrective phase, not a trend reversal. The higher-probability outcome is a continuation lower into Wave Y unless the channel breaks to the upside.
Disclaimer: This analysis is for educational purposes only and does not constitute investment advice. Please do your own research (DYOR) before making any trading decisions.
Longs be cautious in M&MTF: Daily
CMP: 3645
The upmove from 2020 lows is at the maturing zone (as we are now trading in the 5th wave)
The upmove from April 2025 lows is also at the final leg and this impulse could end soon.
In simple price action terms, price has broken down from the sideways range (3660-3780) and the breakdown target for this range is 3540
Price is also trading inside the wedge/leading diagonal, a signature mark of the trend completion. Yet to breakdown from the wedge though.
Cloud Set up:
Price is above the cloud - Bullish
price is at the Base line Support
EMA:
Price has been constantly bouncing off from 50 DEMA. For now, it is placed at 3600 levels
Counts on Weekly TF
My Take:
Definitely not a place to go long.. but we should wait for a week or two for confirmation of the trend termination and good RR set up for short entry.
Disclaimer: I am not a SEBI registered Analyst and this is not a trading advise. Views are personal and for educational purpose only. Please consult your Financial Advisor for any investment decisions. Please consider my views only to get a different perspective (FOR or AGAINST your views). Please don't trade FNO based on my views. If you like my analysis and learnt something from it, please give a BOOST. Feel free to express your thoughts and questions in the comments section.
Breakout Setup Emerging in Strides Pharma Science Ltd#STRIDES
📈Pattern & Setup:
Strides Pharma is exhibiting a structural shakeout followed by a dry-volume pullback — a powerful combination often seen before a fresh breakout.
The stock recently shook out weak hands near 830–850, reclaimed the trendline, and is now trading above it with a strong bullish candle. Volume on the pullback was notably low, implying a lack of supply — a bullish sign of re-accumulation.
A decisive move above 940 could trigger a momentum breakout targeting the 1075–1080 zone.
📝 Trade Plan:
Entry: Fresh entry above 940–945 on volume confirmation.
🚩Stop-Loss: 880 (below recent structural low).
🎯Targets:
Target 1 → 1000 (minor resistance).
Target 2 → 1079 (pattern projection, ~18–19% upside).
💡Pyramiding Strategy:
Enter first lot above 940–945.
Add above 975 continuation breakout, trail SL to 905.
Add final lot above 1020, trail SL to 950.
🧠Logic Behind Selecting this Trade:
This setup captures a reaccumulation phase after a shakeout — where smart money reenters post a temporary liquidity flush. The dry-volume pullback and structural recovery hint at a bullish continuation pattern building up, with strong reward-to-risk potential.
Keep Learning. Keep Earning.
Let’s grow together 📚🎯
🔴Disclaimer:
This analysis is for educational purposes only. Always do your own due diligence before making any investment or trading decisions.
#BreakoutStock #Stocks #Nifty #StridesPharma