ACC | On the Verge of a Breakdown? | Daily Chart | Bearish Bias
📉 Summary
ACC has been compressing into a descending structure, forming Lower Highs since 24 April 2025, while holding Equal Lows near ₹1770 since 03 March 2025.
Repeated tests (4+ times) of the same support zone have reduced its strength, hinting at a potential breakdown setup.
Price action suggests sellers are absorbing demand every time the stock revisits this level — a classic bearish continuation structure.
📌 Structure Breakdown
1. Lower Highs (24/04/2025 onward)
- Each rally has been we
Community ideas
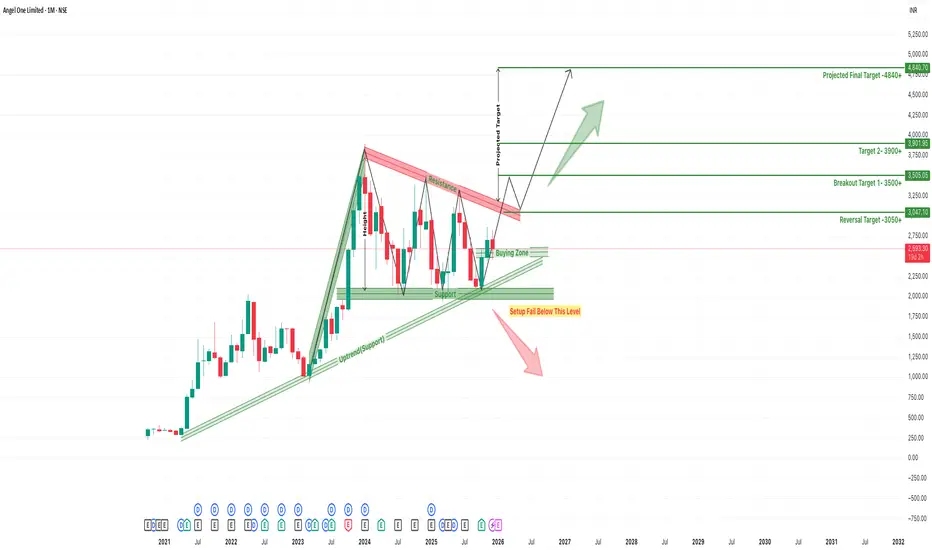
Angel One on the Edge: Long-Term Chart Points to 4800+The monthly chart of Angel One shows a well-defined broadening wedge pattern, where price has been repeatedly oscillating between a rising support line and a widening resistance zone. The structure has been forming for almost two years, indicating a long consolidation phase after a strong uptrend. Currently, the price is trading near the lower trendline support, which aligns with the long-term uptrend support. This zone is marked as the Buying Zone, suggesting that the risk-reward ratio is favou
Glenmark Pharma shows a strong uptrend with periodic correctionsGlenmark Pharma has been moving in a clear weekly uptrend where each strong rise has been followed by a period of consolidation before the next move. This sequence appears three times on the chart, marked as rally and correction phases.
After the most recent rise, price has entered a narrow downward channel. This forms a flag structure, which is a common type of consolidation during an ongoing trend. Volume has reduced during this period, which is normal in this kind of structure.
A break abov
VST Tillers"Here’s a quick breakdown of a beautiful daily setup on VST Tillers.
After a strong 75% move earlier, the stock spent months forming a tight re-accumulation base.
Low volatility… higher lows… and price is surfing the 8 and 21 EMAs perfectly.
Last few days?
Super tight candles… almost no volatility… that’s the market telling you something big is brewing.
We also got a clean retest with stronger volume, which shows demand stepping in and weak hands getting shaken out.
The stock is now sitting
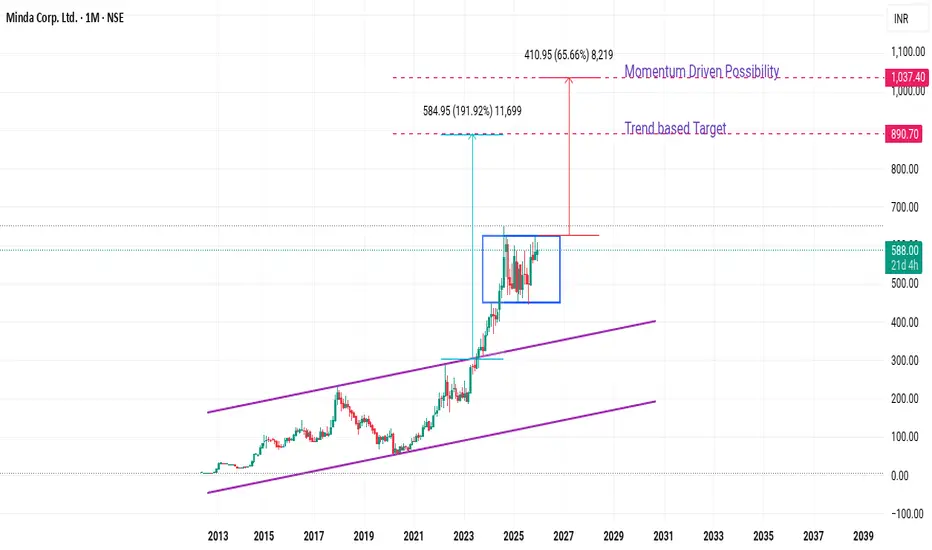
Minda Corp: A Technical Breakout Story with Strong FundamentalsThe chart reveals a compelling multi-year growth trajectory. From 2013 to 2023, Minda traded within a well-defined upward channel, building a strong foundation between ₹100-400 levels. The real excitement began in 2023 when the stock broke out of a decade-long accumulation pattern.
The most significant technical development occurred in late 2024, when Minda consolidated in a rectangular pattern between ₹450-650 before breaking out decisively. This consolidation after a strong rally suggests hea
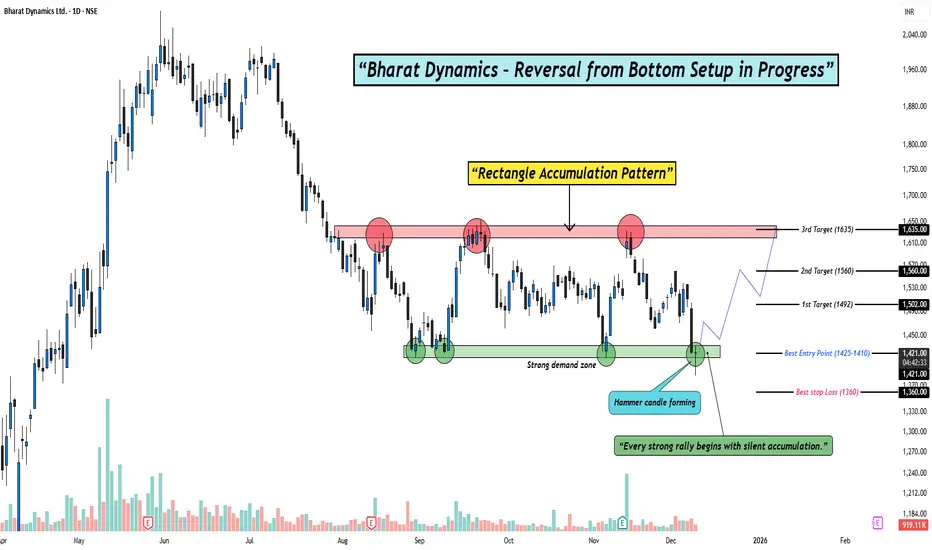
Smart Money Accumulating BDL — Are You Watching This Setup?Hello Traders!
Today’s analysis is on Bharat Dynamics Ltd. (BDL) where a clear Reversal from Bottom Setup is developing. After weeks of sideways consolidation, the stock has formed a clean Rectangle Accumulation Pattern right above a strong demand zone. The latest Hammer candle appearing inside this zone adds strong confirmation that buyers are stepping in again.
Why this setup is special?
Multiple rejections from supply and repeated buying from demand create a classic accumulation ran
USD/CHF in Daily time frameBy Wave Analysis, Initial move to little upside for the target1 mentioned in the chart. Once the "E" wave of Triangle pattern completed, then strong impulse of downside to Target 2 is expected.
Technically the pattern is ready for big move, but fundamentally ADP and Federal fund's rate will decide the direction. If both are in alignment then perfect move of downside is expected. Or else change in structure is possible.
IGL – Structure & Pattern Breakdown🔻 1. Long Rising Trendline Breakdown
Price respected a multi-touch rising trendline, but recently:- Trendline support is broken.
Breakdown candle closed below the line Indicates shift from bullish accumulation → bearish pressure
Pattern Name: Rising Trendline Breakdown
Breakdown Level: ₹192.
🔻 2. Multi-Month Symmetrical Triangle Failed Breakout
There was a symmetrical triangle on the upper side:- Lower highs, Higher lows, Squeeze structure.
Price attempted breakout but failed, rejecting near
NALCO (W) - Strongly Bullish - Fundamentally-Driven BreakoutTimeframe: Weekly | Scale: Linear
The stock has confirmed a major structural breakout, shattering a 2-year consolidation ceiling. This move is supported by a "trifecta" of bullish factors: a technical breakout to new ATHs, rising volume, and stellar quarterly earnings.
🚀 1. The Fundamental Catalyst (The "Why")
The breakout is fueled by strong business performance, which gives the technical move high conviction:
- Stellar Earnings: The company recently reported a ~35% surge in Net Profit
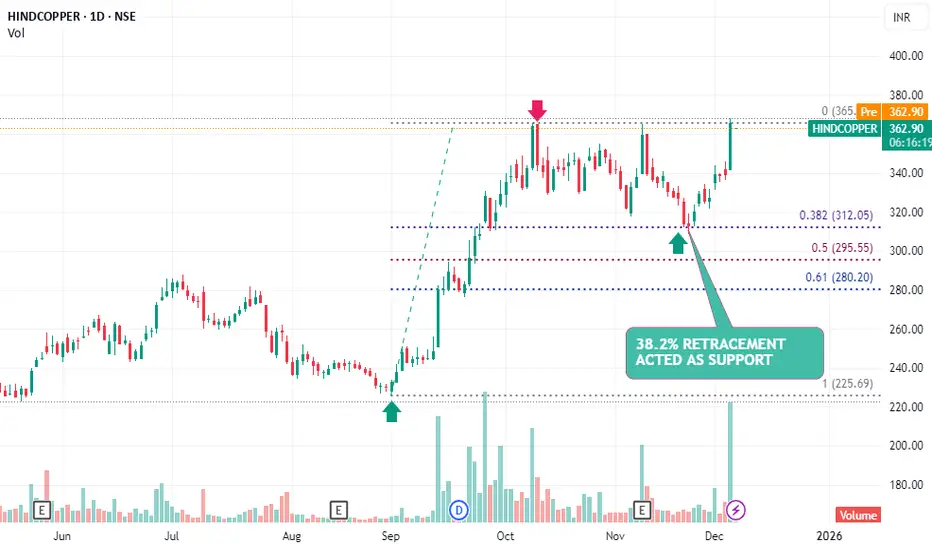
HINDCOPPER – Support at 38.2% Retracement With Reversal SignalHIHINDCOPPER has respected the 38.2% Fibonacci retracement level, indicating that buyers are active at this key support zone. The formation of a reversal candle (DOJI) at this level strengthens the probability of a reversal from the recent corrective decline.
Technical Highlights
Price retraced to the 38.2% Fib level, which is a commonly watched support during strong uptrends.
Reversal candle at support suggests selling pressure is getting absorbed.
Indicates renewed buying interest and potenti
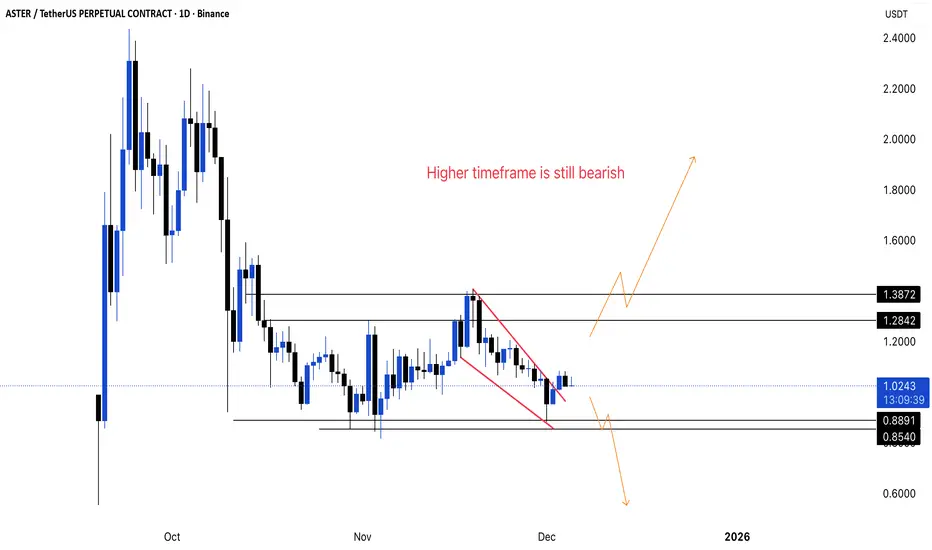
ASTER - what going to happen?📊 ASTER/USDT Update
🔎 Technical Observation:
- The pair is trading within a descending channel/falling wedge pattern, indicating a period of consolidation after a sharp decline.
- Price action shows compression near the apex of this wedge, suggesting imminent volatility.
- The chart explicitly notes that the "Higher timeframe is still bearish," implying the current structure is a pause within a larger downtrend.
⚠️ Key Levels:
- Support: 0.8891, 0.8540
- Resistance: 1.2842, 1.3872
📉 Market
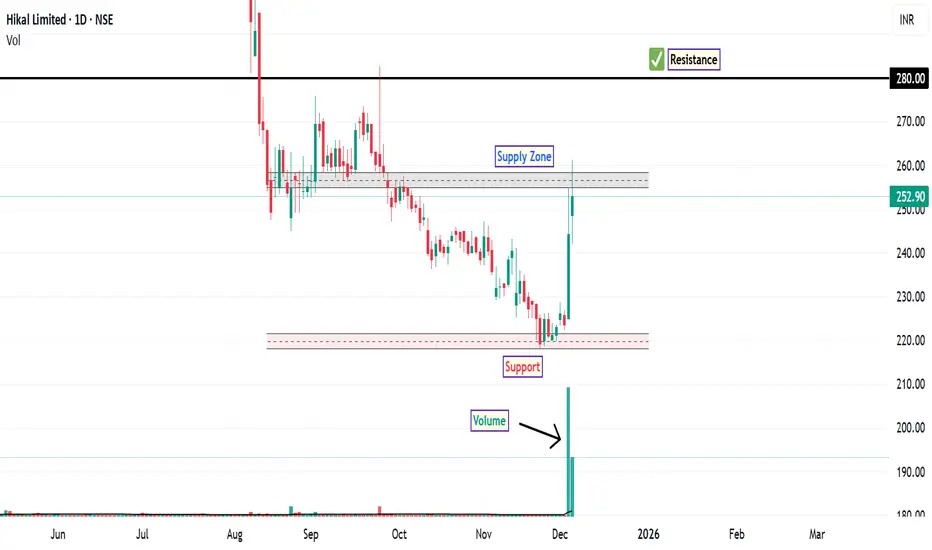
Hikal: Trend Shift and Key LevelsThe stock of Hikal Ltd . experienced a significant breakdown below its major support level of ₹331 in July, marking a continuation of its bearish phase. After testing the discount zone which is now major support zone, the stock rebounded sharply with high trading volume, signaling renewed buying interest and possible accumulation.
A CHOCH pattern has been observed, which often suggests a shift from bearish to bullish structure when confirmed by price and volume behaviour. The stock has managed
Jubilant Foodworks Near Long Term SupportJubilant Foodworks swiftly moving in a Parallel Channel since it got listed in the secondary market. Stock respected the channel's boundaries on several occasions. Now it is very near to its support on both log & linear (caption image) charts. Support zone range from 570 to 525 for double to four times returns probably in 1 to 1.5 years’ time duration.
Trade wisely, slow market movement can test trader/investor's patience and can lead to wrong decision. Always apply logical stop-loss for capit
Maruti: Rising Flag, Dropping ProbabilityStructure
The decline into Wave W is complete as a Regular Flat.
The rebound is a corrective Wave X, fully overlapping and contained within a rising channel.
Bias remains bearish as long as price trades inside this channel.
Wave Y Setup
Trigger: Breakdown below the channel near 16000.
Entry: Preferable after a break and retest of the lower channel line.
Target: Toward 15,260 to complete Wave Y.
Invalidation: A decisive close above 16,549 invalidates the bearish view.
Summary
Longs be cautious in M&MTF: Daily
CMP: 3645
The upmove from 2020 lows is at the maturing zone (as we are now trading in the 5th wave)
The upmove from April 2025 lows is also at the final leg and this impulse could end soon.
In simple price action terms, price has broken down from the sideways range (3660-3780) and the breakdown target for this range is 3540
Price is also trading inside the wedge/leading diagonal, a signature mark of the trend completion. Yet to breakdown from the wedge though.
Cloud Set up:
Pr
Breakout Setup Emerging in Strides Pharma Science Ltd#STRIDES
📈Pattern & Setup:
Strides Pharma is exhibiting a structural shakeout followed by a dry-volume pullback — a powerful combination often seen before a fresh breakout.
The stock recently shook out weak hands near 830–850, reclaimed the trendline, and is now trading above it with a strong bullish candle. Volume on the pullback was notably low, implying a lack of supply — a bullish sign of re-accumulation.
A decisive move above 940 could trigger a momentum breakout targeting the 1075–1080
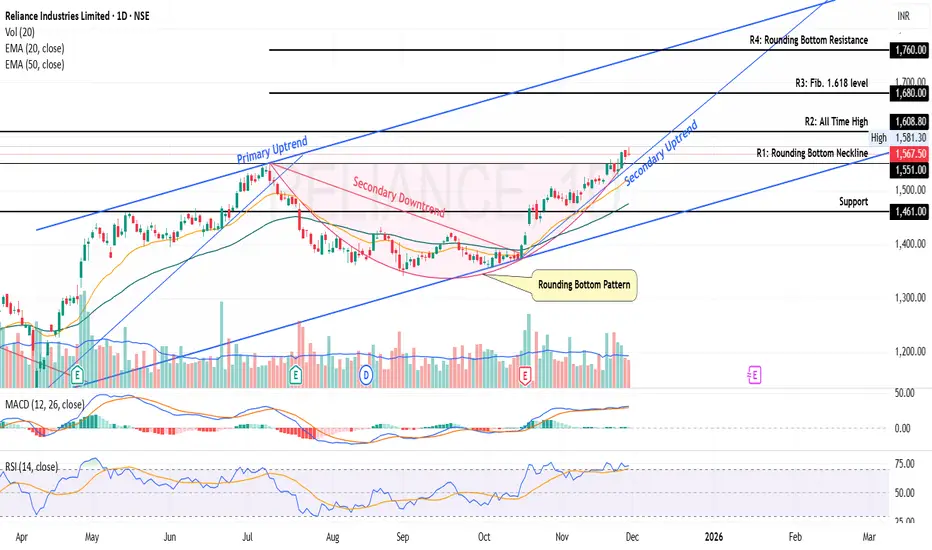
Reliance Industries Ltd. - Stock AnalysisDate : 30-Nov-2025
LTP : Rs. 1,567.50
Technical View:
• NSE:RELIANCE is in primary uptrend since Apr 2025 and currently trading through it's secondary uptrend since 16-Oct-2025.
• After touching the high of 1,551 on 9-Jul-2025, it has retraced 14% to 1,340.60 level.
• NSE:RELIANCE has formed a Rounding Bottom Pattern and has breakout from it's neckline with higher than average volume on 26-Nov-2025. The Rounding Bottom Neckline is marked as 1st Resistance (R1) in chart and is placed at 1
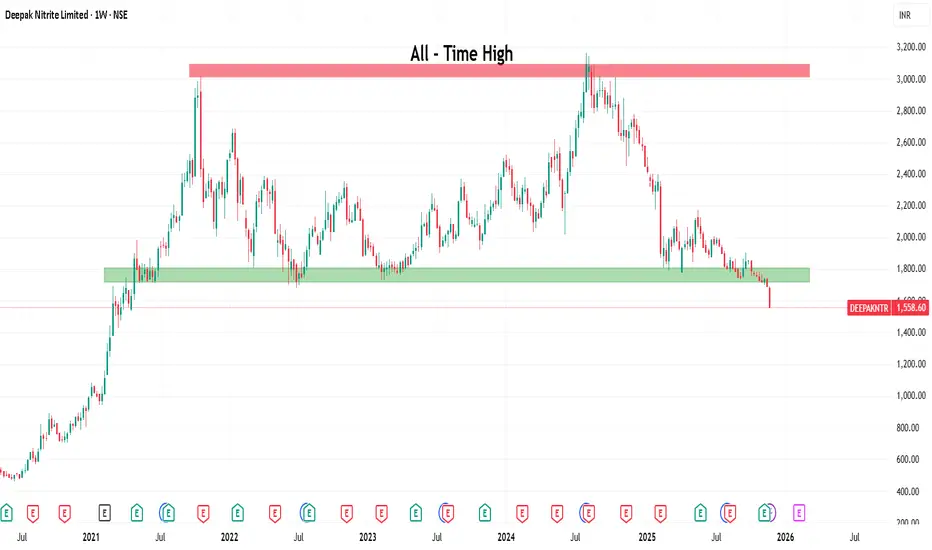
Deepak Nitrite: Support Breakdown Signals Caution🔍 Technical Analysis
Deepak Nitrite Limited has experienced a super bullish rally over the past decade, transforming from below ₹100 to reaching ₹3,000 by October 2021 - representing an impressive 30x growth in just 10 years. However, the stock has since entered a prolonged consolidation and correction phase.
The ₹3,000-₹3,200 zone acted as formidable resistance twice, while the ₹1,700-₹1,800 zone provided strong support multiple times over the past few years. This created a well-defined trad
VARROC 1 Day Time Frame 📈 Where VARROC stands now
Recent quotes put VARROC around ₹ 659 – ₹ 692 per share.
On a 1‑day / very short‑term basis, the stock recently showed a jump of ~4‑5%.
The 52‑week range for the stock has been roughly ₹ 374 – ₹ 674–689 — so current levels are near the upper end of that band.
⚠️ What to keep in mind / Risks in 1‑day frame
The stock remains relatively volatile — intraday swings (highs/lows) have been wide in recent sessions.
Short‑term moves may be driven more by news/event‑driven s
Nifty Intraday Analysis for 01st December 2025NSE:NIFTY
Index has resistance near 26400 – 26450 range and if index crosses and sustains above this level then may reach near 26600 – 26650 range.
Nifty has immediate support near 26000 – 25950 range and if this support is broken then index may tank near 25800 – 25750 range.
The uptrend is intact on expectation of rate cup by RBI in the scheduled MPC meet during 03-05 December 2025.