AUDUSD_DThe AUD/USD pair appears to have completed a five-wave Elliott structure on the Daily timeframe, while a clear bearish divergence is visible on both the Daily and Weekly timeframes.
In addition, a bearish Butterfly harmonic pattern is forming on the Weekly chart, increasing the probability of a medium-term downside correction.
As long as price remains below the invalidation level, the market outlook stays bearish, and we expect a decline toward the following targets:
0.69229
0.68254
0.67055
A confirmed breakdown below 0.70951 could provide a potential trigger for short positions.
However, if price breaks and sustains above 0.72770, this bearish scenario will be invalidated.
Fundamental Analysis (Related to Your Setup)
From a fundamental perspective, several factors could support bearish pressure on AUD/USD in the coming weeks:
* A stronger US Dollar driven by expectations of higher-for-longer interest rates from the Federal Reserve may continue to weigh on the Australian Dollar.
* Weakness in global growth sentiment and slower demand from China — Australia’s largest trading partner — could negatively impact commodity-linked currencies such as AUD.
* Declining risk appetite in global markets typically strengthens the USD while pressuring higher-beta currencies like AUD.
* If commodity prices, especially iron ore and industrial metals, continue to soften, the Australian Dollar may face additional downside momentum.
* Meanwhile, a cautious stance from the Reserve Bank of Australia compared with the Fed could further widen policy divergence in favor of the US Dollar.  Long
Long
 Short
Short
Ajanta Pharma (D): Bullish (Apex Squeeze & Pre-Breakout Setup)Timeframe: Daily | Scale: Linear
Ajanta Pharma is coiled in a massive compression zone, tightly squeezing against key historical resistance levels. Backed by excellent quarterly earnings and strong institutional accumulation, the probability of an upside breakout is highly elevated.
🚀 1. The Fundamental Catalyst (The "Fuel")
The rising volume and persistent upward pressure are directly linked to the recent Q4 performance:
> Earnings Beat: Strong top-line and bottom-line growth confirms the company's operational strength.
> Forward Guidance: Management's confident projection of 16–18% revenue growth for FY27 gives institutional buyers the conviction to accumulate shares right at these resistance levels.
📈 2. The Chart Structure (The Triangle Squeeze)
> The Convergence: The stock is forming a classic Triangle Pattern. The horizontal ceiling from Nov 2024 acts as a rigid supply zone, while the angular line from Sept 2024 is acting as dynamic support, pushing the price higher.
> Today's Action: The 0.9% surge on 237.94K volume indicates that bulls are persistently knocking on the door of the Nov 2024 horizontal resistance. The lack of a violent rejection implies that the sellers at this level are gradually getting exhausted.
📊 3. Volume & Indicators
Indicator analysis paints a picture of absolute trend harmony.
> Trend Alignment: The Positive Crossover (PCO) in the short-term EMAs across the Monthly, Weekly, and Daily timeframes confirms that the broader macro trend remains firmly up.
> Momentum: The rising RSI across all three timeframes indicates that underlying momentum is quietly building up before the actual price breakout occurs.
> Volume Accumulation: The rising volume profile confirms that smart money is actively absorbing the overhead supply.
🎯 4. Future Scenarios & Key Levels
The stock is at a pivotal juncture. The price action in the coming days will dictate the next major swing.
🐂 Bullish Targets (The Breakout):
- Trigger: A decisive Daily Close strictly above the Nov 2024 horizontal resistance zone (clearing the ₹3,110–₹3,150 supply area) backed by sustained heavy volume.
- Target 1: ₹3,450 – ₹3,485.
🛡️ Support (The "Must Hold"):
- Immediate Support: ₹2,950 – ₹3,000. If the breakout fails and momentum cools off, the stock should find immediate support near its short-term moving averages.
- Invalidation: A close below the angular trendline would invalidate the bullish structure and signal a return to a broader consolidation phase.  Long
Long
Nifty at a Crucial Retest Zone: Bounce Back or Bigger Breakdown?Nifty is currently trading at one of the most important technical zones on the weekly timeframe. After facing rejection from the major resistance area near 26,000, the index witnessed a sharp correction and has now returned to its long-term rising support trendline. Interestingly, the previous support area is now behaving like resistance, which makes this region a critical decision point for the market.
The highlighted zone around 23,000–24,000 will likely decide the next major move. If buyers manage to defend this support and Nifty sustains above the trendline, the market could attempt another bullish recovery toward the higher resistance zones. A successful bounce from here may restart the broader uptrend and open the door for a strong bullish continuation in the coming months.
However, if the market fails to hold this support structure, the bearish pressure can increase significantly. In that case, Nifty may decline toward the next major support near 19,000. A deeper breakdown below that level could even trigger a stronger bearish phase toward 15,200 levels, indicating a complete shift in long-term market sentiment.
Right now, this is a pure “reaction zone” for the market. Traders should closely observe how price behaves around support before taking aggressive positions. The next few weekly candles could define whether this is just a temporary correction or the beginning of a larger trend reversal.  Short
Short
BTCUSD Pennant Structure | Waiting For FMFR SetupThe market is currently trapped inside a pennant structure, creating a compressed price range where both sides are active.
My main expectation here is an FMFR setup — First Move Fake Than Reversal. In this type of structure, the first breakout move is often a fake move before the market reverses strongly in the opposite direction.
Because of that, I am not measuring the full move yet. First, I want to see which side the market chooses for the initial fake breakout. Once that fake move appears, I can then calculate the expected reversal move based on the first expansion of the pennant structure.
For now, price is still moving inside the structure without a confirmed breakout.
Inside the pennant, I identified an important reversal area where supply has reacted twice already, creating a 2x supply reaction zone. Along with that, I also marked a reversal zone where I want to see any strong positive candle or bullish confirmation.
If buyers react positively from this area, the market could deliver a short-term upside move while still remaining inside the overall structure.
At the moment, the focus remains on how price reacts around the reversal zone before the market reveals its true direction.  Long
Long
Nifty - Weekly Review May 11 to May 15The price is moving within the range of 23900 to 24480. Wide range movement is hard to break as the price can consolidate in this range for many days, unless there is some news to move the market.
Buy above 24140 with the stop loss of 24080 for the targets 24180, 24240, 24300, 24360, 24440, 24500, 24580 and 24620.
Sell below 23880 with the stop loss of 23940 for the targets of 23840, 23780, 23720, 23660, 23600 and 23520.
As per the daily chart, the price is neutral.
Always do your analysis before taking any trade.  Long
Long
 Long
Long
 Long
Long
 Long
Long
1-hour chart analysis for Bitcoin/TetherUS Perpetual (BTCUSDT.P)Bullish Scenario: If the $79,500 area holds without strong candle closes below it, a retest of the local highs at $82,000 and eventually $84,500 is likely.
Strategy: Look for a "Sweep and Reclaim" or a bullish engulfing candle within the reversal area before entering. Always follow the 1% risk management rule for capital
Structure: After a strong rally from roughly $78,000, Bitcoin encountered heavy resistance near the $82,800 local high. The subsequent "Curve Line" (arch-like pattern) represents a cooling phase into the current support zone.
Resistance: The primary hurdle remains the $82,200 – $85,300 zone. A decisive 1-hour close above $80,850 would signal a reclaim of the stair-step bullish structure.
Support (Reversal Area): The current gray box near $79,500 acts as a "demand zone" where buyers have previously stepped in.  Long
Long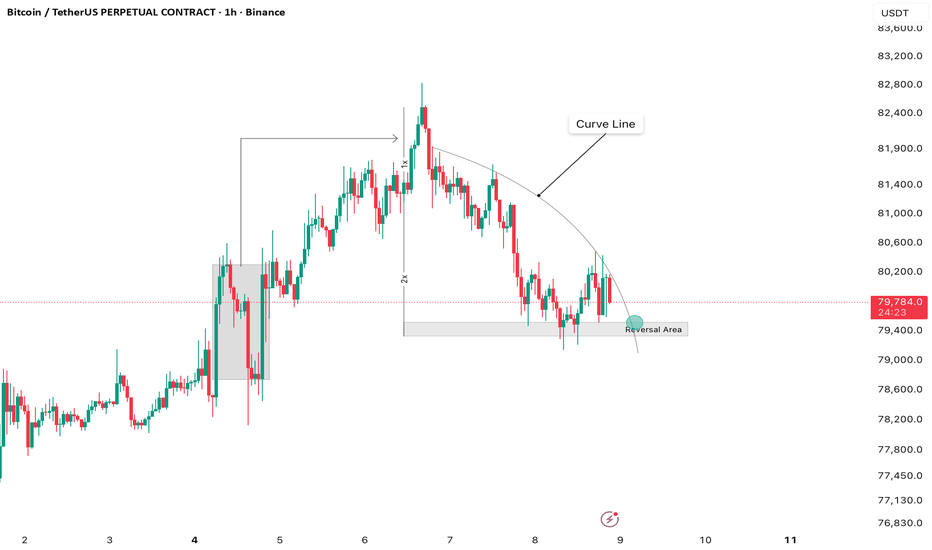
Grasim Industries: A Titan Reclaiming Its PeakGrasim Industries Ltd (NSE: GRASIM) is currently one of the most compelling stories in the Indian large-cap space. As the flagship company of the Aditya Birla Group, it has evolved from a simple textile manufacturer into a diversified powerhouse with dominant positions in Viscose Staple Fibre (VSF), Chemicals, and building materials through its subsidiary, UltraTech Cement.
As of May 8, 2026, the stock is trading near ₹2,968, reflecting a robust recovery and a strategic pivot toward new growth engines like the "Birla Opus" paints division.
Technical Analysis: The Chart Speaks
The provided weekly chart reveals a textbook "Ascending Channel" and a significant breakout attempt:
Long-Term Trend: Since mid-2022, the stock has been respecting a consistent upward-sloping channel (the grey shaded area). Every touch of the lower boundary has historically acted as a "buy-on-dips" opportunity, while the upper boundary has served as a profit-booking zone.
The 2026 Shakeout: In early 2026, the stock experienced a sharp "throwback" toward the ₹2,500 level (the green horizontal support line). This area successfully cushioned the fall, aligning with the 52-week low and providing a launchpad for the current rally.
Current Breakout: The most recent candles show a decisive surge. The price has not only reclaimed the ascending channel but is currently testing a multi-year resistance zone near ₹2,970 – ₹2,980.
Volume & Momentum: The volume bars at the bottom indicate steady participation during the recovery phase, suggesting that institutional interest is returning ahead of the Q4 FY26 earnings scheduled for May 20, 2026.
Fundamental Outlook: Beyond the Fibres
Grasim’s current valuation—trading at a premium P/E of approximately 42.6x—suggests the market is no longer viewing it as a commodity play, but as a high-growth consumer and industrial conglomerate.
Key Metric (May 2026) Value
Market Cap ~₹2,01,475 Cr
52-Week High/Low ₹2,979 / ₹2,502
Dividend Expected ₹10 per share (announced May 20)
Revenue (FY26 Est.) ~₹1.50 Lakh Cr
Growth Catalysts:
Birla Opus (Paints): The aggressive rollout of its paints business is the "X-factor." Early data for 2026 indicates market share gains are triple the industry growth rate, positioning Grasim as a serious challenger to established players.
Chemicals & VSF: As global supply chains stabilize, Grasim’s specialty sales in Cellulosic Fibres have reached a 26% volume share, driven by high export demand.
The UltraTech Factor: As the holding company for UltraTech Cement, Grasim continues to benefit from India's infrastructure boom and the government's housing initiatives.
Conclusion
Grasim is at a technical crossroads. A sustained close above ₹3,000 would mark a psychological and technical breakout into "Blue Sky" territory, potentially ending the years-long consolidation within the channel. For investors, the upcoming board meeting on May 20 will be the ultimate litmus test to see if the fundamentals justify this bullish chart pattern.  Long
Long
BTC Holding Key Demand Zone – Is $82.8K the Next Target?Bitcoin is once again showing strong bullish intent after successfully defending a major demand zone near the previous resistance area. The recent pullback appears healthy rather than bearish, and buyers are slowly regaining control above support.
The chart clearly shows that BTC respected the same resistance zone multiple times in the past before finally breaking above it. Now that area is acting as support, which is a classic bullish retest structure.
Market Structure Analysis
BTC previously faced rejection twice from the highlighted resistance zone around 79.0K–79.2K, making it an important historical level.
After the breakout, price entered a strong impulsive rally and created higher highs with strong bullish momentum.
The recent correction swept weak hands near support and immediately saw buying pressure return, indicating buyers are still active.
Current price action suggests BTC is attempting to build a new higher low above the breakout zone.
Volume & Momentum Insight
Volume increased heavily during the breakout rally, confirming genuine buyer participation.
During the retracement phase, selling pressure remained relatively controlled compared to the breakout move.
The bounce from support came with renewed bullish candles, showing demand is still present in the market.
Short-term moving averages are slowly curling upward again, supporting bullish continuation possibilities.
Bullish Scenario
If BTC continues holding above the 80K psychological zone, momentum could gradually push price toward the marked upside targets.
1st Target: 81,000
2nd Target: 81,400
3rd Target: 82,000
Final Target: 82,850
A sustained move above recent swing highs could accelerate bullish momentum further.
Bearish Scenario
If BTC loses the highlighted support region decisively, short-term bullish momentum may weaken.
A breakdown below 79.1K could trigger deeper profit booking and volatility.
Traders should avoid emotional entries if support fails to hold.
Rahul’s Insight
Most traders panic during healthy pullbacks inside an uptrend. But experienced traders understand that strong markets often revisit breakout zones before continuation.
The key here is not chasing green candles aggressively. The smarter approach is watching whether buyers continue defending the reclaimed support area.
As long as structure remains intact, dips may continue attracting demand.
If you found this analysis helpful, make sure to like, comment, and follow for more high-quality trading setups and educational content.
Disclaimer:
This analysis is shared for educational purposes only and should not be considered financial advice. Always manage risk properly and do your own research before taking any trade.
— @TraderRahulPal
SCA Registered Financial Influencer (Dubai, UAE) Long 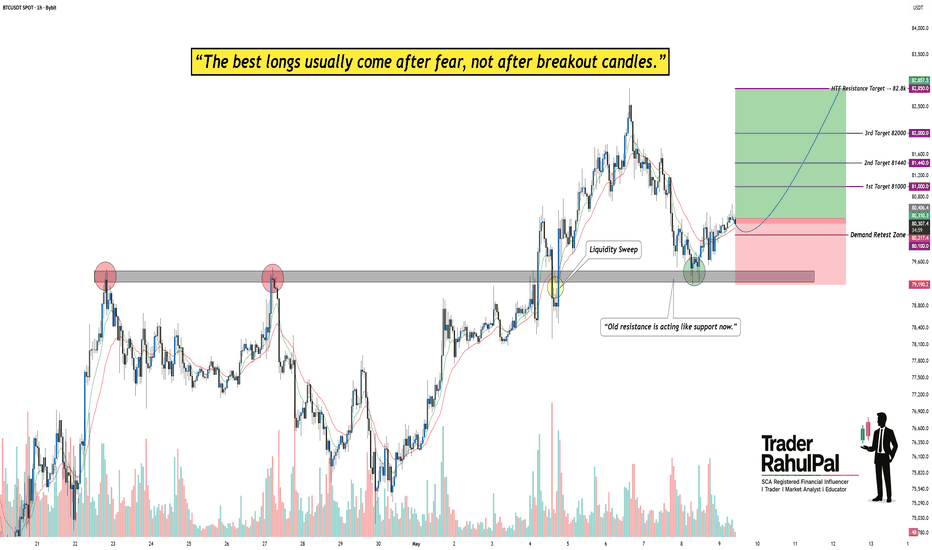
 Long
Long
Short 
 Long
Long


 Short
Short