Bitcoin may fall to 58000 againCOINBASE:BTCUSD
Namaskaram Everyone
Why is very important, why i am giving you a sell here.
so here is my reasons.
# As per neowave Market finished a major bullish trend at the top 1,26,296.
Retraced 61 percent from there.
# Now we are seeing a price jump from this 61 percent which is 60,000 price area.
But market is only given a price wise fall here , still there is some space for consolidation a time wise correction
# Major resistance area is 98,000 , no doubt about it. But if this is going to be an diagonal than price must retrace from current area in form of ((D)) and ((E)) leg.
# if this happen than we have a great risk to reward ration of 10 times and if we do compounding than more.
# Now why price must behave this way, honestly price can behave any number of ways but this way we a good risk reward ratio so we are givng a trade suggestion here.
I dont post regulary updates about instrument, but i have found a new approch to neowave and its easy to code and update. so if you are interested in Neowave Trades , keep following us.
and if you have any query related to anything , you can leave comment here.
Thank You.
Thank You.  Short
Short
XAUUSD — Weekly Wave 5 Lower Toward 4,060
From Kelly’s view, gold enters next week inside a broader bearish corrective structure. Price is currently trading around 4,378, after recovering from the 4,240–4,250 area, but the rebound is still developing beneath a descending channel and an important sell zone around 4,390–4,410.
The key idea is simple: the current recovery may represent a corrective Wave (4), while the main weekly scenario remains a continuation lower into Wave (5) if sellers defend the upper resistance zone.
⟡ Market structure
Gold remains inside a descending structure after the major peak near 4,680. Recent rebounds have continued to form below important resistance, while the descending channel is still controlling the broader direction.
The current recovery from around 4,240 has pushed price back toward the 4,390–4,410 sell zone, where Fibonacci resistance and the projected Wave (4) completion area overlap.
For next week, 4,334 is the first important support. A clean break below this level could confirm renewed bearish momentum and expose the 4,240–4,255 area.
If that support also fails, the larger Wave (5) projection points toward the 4,045–4,075 zone.
➤ Key levels
◌ Current price area: 4,375–4,385
◌ Main sell zone: 4,390–4,410
◌ Strong resistance: 4,410–4,430
◌ Strong support: 4,334
◌ Secondary support: 4,240–4,255
◌ First target: 4,334
◌ Second target: 4,240–4,255
◌ Main target: 4,045–4,075
◌ Invalidation: Above 4,430
⌁ Elliott Wave view
Wave (1): The first bearish leg pushed price lower from the previous recovery high.
Wave (2): Gold produced a corrective rebound before sellers regained control.
Wave (3): The stronger bearish impulse extended toward the 4,240 area.
Wave (4): The current rebound may be completing near 4,390–4,410, where the descending channel and Fibonacci resistance overlap.
Wave (5): If sellers reject this zone, the final bearish leg could develop toward 4,240 first, followed by the larger 4,045–4,075 target area.
▸ Trading scenario
Preferred bearish scenario
Entry: 4,390–4,410 after bearish confirmation
Stop Loss: Above 4,430
Take Profit 1: 4,334
Take Profit 2: 4,240–4,255
Take Profit 3: 4,045–4,075
The cleaner plan is to wait for rejection from the sell zone rather than chase price lower around current levels. A bearish reaction near 4,390–4,410, followed by a break below 4,334, would strengthen the Wave (5) scenario.
Alternative scenario:
If gold breaks above 4,410–4,430 and holds above the descending structure, the bearish Wave (5) setup may be delayed and price could extend toward the next higher resistance before sellers regain control.
◌ Invalidation
The main bearish scenario would weaken if price gains sustained acceptance above 4,410, and a confirmed break above 4,430 would invalidate the preferred Wave (5) structure for next week.
⌁ Kelly’s view
Kelly’s main view remains bearish for next week while gold stays below 4,390–4,430.
The current rebound may still have room to test the sell zone, but the broader structure favors another bearish leg if sellers defend resistance. 4,334 is the first confirmation level, while 4,240–4,255 remains the next major support before the larger 4,045–4,075 Wave (5) target comes into focus.
Do you think gold will reject the 4,390–4,410 sell zone first, or break 4,334 directly next week?  Short
Short
 Long
Long
 Long
Long
XAUUSD — Wave 5 Lower Toward 4,280
From Kelly’s view, gold is still trading inside a broader bearish structure. Price is currently around 4,352, while the recent rebound remains below the previous lower-high area near 4,380–4,395.
The key idea is simple: the current move may be completing a corrective Wave (4) around resistance, while the main structure still favors another bearish leg toward 4,320, 4,305, and potentially the 4,280 Wave (5) target zone.
⟡ Market structure
Gold continues to show a sequence of lower highs after failing around the 4,390 area.
The immediate resistance zone sits around 4,340–4,350, where the chart marks the projected Wave (4) sell zone. Price is currently testing this area, so the next reaction becomes important.
If sellers defend this zone and price breaks back below 4,320, bearish momentum could strengthen.
The 4,305 level is the next structural support. A confirmed breakdown below this level may expose the 4,278–4,288 area, where the projected Wave (5) completion and Fibonacci extension overlap.
➤ Key levels
◌ Current price area: 4,350–4,355
◌ Main sell zone: 4,340–4,350
◌ Strong resistance: 4,380–4,395
◌ First support: 4,318–4,325
◌ Strong support: 4,305
◌ First target: 4,320
◌ Second target: 4,305
◌ Main target: 4,278–4,288
◌ Invalidation: Above 4,395
⌁ Elliott Wave view
Wave (1): The first bearish impulse started from the recent local high and pushed price lower.
Wave (2): Gold produced a corrective rebound before sellers returned.
Wave (3): The next bearish leg extended toward the 4,320 area.
Wave (4): Price is now attempting another corrective recovery toward the 4,340–4,350 resistance zone.
Wave (5): If sellers reject this area, the final bearish leg could extend below 4,305 toward the 4,278–4,288 completion zone.
▸ Trading scenario
Preferred bearish scenario
Entry: 4,340–4,350 after bearish confirmation
Stop Loss: Above 4,395
Take Profit 1: 4,320
Take Profit 2: 4,305
Take Profit 3: 4,278–4,288
The cleaner plan is to wait for rejection around the projected Wave (4) resistance area. A break below 4,320, followed by loss of 4,305, would strengthen the continuation toward the Wave (5) target.
Alternative scenario:
If gold breaks above 4,350 and holds with strong bullish momentum, price could retest 4,380–4,395 before the broader bearish structure is reassessed.
◌ Invalidation
The bearish scenario would weaken if price gains sustained acceptance above 4,380, while a confirmed break above 4,395 would invalidate the preferred Wave (5) continuation setup.
⌁ Kelly’s view
Kelly’s main view remains bearish while gold stays below 4,380–4,395.
The current rebound looks more like a corrective Wave (4) than a confirmed trend reversal. If sellers defend 4,340–4,350, the next downside sequence may target 4,320, then 4,305, before the larger 4,278–4,288 Wave (5) zone comes into focus.
Do you think sellers will defend the Wave (4) zone, or will gold retest 4,390 first? Short 
 Short
Short
 Long
Long
 Long
Long
 Long
Long
 Long
Long
 Long
Long
 Short
Short
 Short
Short
XAUUSD — Bullish Wave Structure Toward 4,490
From Kelly’s view, gold is rebuilding a bullish structure after breaking away from the previous descending trendline. Price is trading around 4,391, and the recent recovery suggests buyers are trying to establish a new impulsive sequence toward the upper Fibonacci resistance zones.
The key idea is simple: the main trend may stay bullish while price continues to form higher lows, with 4,405–4,415 acting as the first important resistance test before a potential expansion toward 4,459 and the 4,488–4,497 area.
⟡ Market structure
Gold has recovered strongly from the 4,240–4,260 swing-low area and is now trading above the former descending trendline.
The short-term structure has shifted toward higher lows, while the projected Elliott Wave path suggests another bullish impulse may be developing.
The first obstacle is the Fibonacci resistance zone around 4,405–4,415. If buyers can absorb selling pressure here, price could continue toward 4,433 and 4,459.
Above that, the major resistance and projected Wave (5) completion zone sits around 4,488–4,497, close to the 2.618 Fibonacci extension.
➤ Key levels
◌ Current price area: 4,390–4,395
◌ Main bullish retest zone: 4,375–4,390
◌ Strong support: 4,335–4,350
◌ First resistance: 4,405–4,415
◌ Key resistance: 4,433
◌ First target: 4,459
◌ Main target: 4,488–4,497
◌ Invalidation: Below 4,335
⌁ Elliott Wave view
Wave (1): The current recovery may extend toward the 4,405–4,415 resistance area.
Wave (2): A controlled pullback toward approximately 4,375–4,390 could follow if buyers take profit near resistance.
Wave (3): If the pullback holds and bullish confirmation appears, the stronger expansion could target 4,459.
Wave (4): Price may then consolidate or retrace toward the 4,430–4,440 area.
Wave (5): The final bullish leg could extend toward 4,488–4,497, where the major Fibonacci resistance and projected Wave (5) target overlap.
▸ Trading scenario
Preferred bullish scenario
Entry: 4,375–4,390 after bullish confirmation
Stop Loss: Below 4,335
Take Profit 1: 4,410–4,415
Take Profit 2: 4,459
Take Profit 3: 4,488–4,497
The cleaner plan is to wait for buyers to defend the projected Wave (2) retracement area rather than chase price directly into Fibonacci resistance.
Alternative scenario:
If gold breaks and holds above 4,415 without a deeper pullback, a confirmed retest of this zone could support continuation toward 4,433–4,459.
◌ Invalidation
The bullish structure would weaken if price loses the 4,335–4,350 support area and begins trading back below the recent higher-low structure. A sustained break below 4,335 would invalidate the preferred bullish wave sequence.
⌁ Kelly’s view
Kelly’s main view remains bullish while gold continues to defend its higher-low structure above 4,335–4,350.
The immediate test is 4,405–4,415. If buyers can break and hold above this Fibonacci resistance, the next wave may open the way toward 4,459, followed by the larger 4,488–4,497 Wave (5) target.
Do you think gold will complete this bullish wave structure toward 4,490, or retest the key support zone first? Long 
YATHARTH — ELLIOTT WAVE IMPULSE SETUPYatharth Hospital and Trauma Care Services Ltd ( NSE:YATHARTH ) — Elliott Wave Impulse Setup
Bias: Bullish
Timeframe: Daily
CMP: ₹1,072.4 (+9.17%)
Wave Structure:
Price is tracing a larger-degree impulse from the origin (O):
Wave (I) topped near ₹680
Wave (II) corrected down to ~₹340, respecting the O–II support trendline
Wave 1 (of III) rallied to ~₹985
Wave 2 pulled back to ~₹540, holding the lower boundary of the rising wedge
Price has now broken above the upper trendline resistance (~₹950–1000), signaling a potential Wave 3 in progress
Key Levels:
Stop Loss: ₹610 (tighter, trailing stop just below recent structure)
Invalidation: ₹538 (below the Wave 2 low — a close below this negates the entire bullish count)
Expected Target Zone: ₹1,600 – ₹2,200 (Wave 3 extension zone)
Thesis:
The breakout above the wedge resistance, backed by strong volume/momentum, supports the idea that Wave 3 — typically the most extended and powerful wave — is now unfolding. The two-tier risk framework (stop loss vs. hard invalidation) lets you manage the trade actively while keeping the broader bullish structure intact unless ₹538 is breached on a closing basis.
Risk Note:
This is a subjective wave count, not a guarantee. If price closes below ₹610, tighten risk management; a close below ₹538 fully invalidates this bullish scenario and the count should be reassessed.
Disclaimer: For educational purposes only, not investment advice. Elliott Wave counts are subjective and can be invalidated. Trade at your own risk — consult a SEBI-registered advisor before investing. S&P 500: Fed Speaks, Chart Hits 0.618The Fed just blinked hawkish — and the market moved almost exactly where the chart said it might.
On September 16, the US Fed raised rates by 25 bps — the first hike in three years. The move itself was already priced in (92% odds going in). What actually shook the market was two words from Fed Chair Kevin Warsh: he said policy needs to support a "timelier return" to the 2% inflation goal. Markets read that as "more hikes are coming, and soon" — and that's what sent the Dow down 630+ points and dragged the S&P 500 lower with it.
Here's where it gets interesting for chart readers: the S&P didn't just fall — it fell and stopped almost exactly at the 0.618 Fibonacci retracement (7,505.98) of the entire rally from the May low. 0.618 is called the "Golden Ratio" for a reason — it shows up everywhere in nature, and in markets it's the most-watched retracement level of all. So many traders have orders sitting near it that it often becomes a self-fulfilling floor or ceiling. That's exactly what played out here.
The wave count on the chart
Zooming out, here's the structure I'm tracking:
Wave (I) → (II) : The May–August move up (I) got corrected by an a-b-c "Running Flat." . Two tells confirm this: wave (b) made a slightly higher high than wave (I), and wave (c) barely dipped below wave (a)'s low before buyers stepped back in. A shallow, reluctant wave (c) is a classic sign the bigger trend is still up — running flats usually show up right before a strong wave 3.
Wave (1) → (2) : After (II) bottomed near 7,313.92, price rallied to 7,816.70 (wave 1), then pulled back — and that pullback is exactly the move the Fed news triggered, landing right on the 0.618 line at 7,505.98.
Why this level matters
7,313.92 (the wave II low) is the line in the sand. As long as price holds above it, this bullish count stays valid. A daily close below it would mean this labeling needs a rethink.
If the count holds
Using the wave (II)-low-to-wave (2)-low as the base of a trend channel, and projecting a simple 1x extension of wave (1) from the wave (2) low, the first target zone lines up around 8,010. Third waves often run further than 1x — so if this move has real strength, a stretch target near 8,300 (1.618x) isn't out of the question either. These are reference zones to watch, not predictions of exact outcomes — wave 3 needs to actually break above 7,816.70 with strong, clean structure before this becomes more than a scenario.
Bottom line
Macro (hawkish Fed) and technicals (Golden Ratio holding, running flat completing) lined up perfectly this week. The structure stays bullish above 7,313.92. Above 7,816.70 with strength would be the next confirmation to watch for.
Disclaimer:
I am not a SEBI registered research analyst. This post is shared only for education and learning purposes, based on my personal reading of the chart. It is not a buy or sell recommendation. Please do your own research or speak to a registered advisor before taking any trading decision.  Long
Long
XAUUSD — Bullish Recovery Toward 4,410Gold is showing a bullish recovery after reacting strongly from the lower liquidity area. From Kelly’s view, the chart suggests that XAUUSD may be forming a new upside Elliott Wave structure after breaking out from the lower side of the previous bearish channel.
The key idea is simple: if gold continues to hold above the Buy zone liquidity, the recovery structure can continue toward the next resistance levels.
⟡ Market structure
Gold is currently trading around 4,310–4,318, after bouncing from the Buy zone liquidity near 4,275–4,290. This reaction shows that buyers are trying to defend the lower support area and build a new bullish base.
The first resistance to watch is around 4,340–4,355, marked as the short-term sell scalping area. If gold breaks above this zone, the next important level is the strong resistance near 4,367.
A clean move above 4,367 would strengthen the bullish structure and open the way toward the 4,405–4,415 Resistance done wave 5 zone. If momentum continues, the larger upside target remains near 4,485–4,500.
➤ Key levels
◌ Current price area: 4,310–4,318
◌ Buy zone liquidity: 4,275–4,290
◌ Short-term resistance: 4,340–4,355
◌ Strong resistance: 4,367
◌ Main wave 5 target: 4,405–4,415
◌ Extended bullish target: 4,485–4,500
◌ Bullish invalidation: below 4,255
⌁ Elliott Wave view
The chart shows a possible bullish Elliott Wave recovery.
Wave (1) may have started from the lower liquidity area and pushed price toward 4,317.
Wave (2) may have completed after the retest near 4,275–4,290.
If this buy zone holds, wave (3) may continue toward 4,340–4,355 and 4,367.
Wave (4) could create a short pullback after testing resistance.
Wave (5) may then extend toward 4,405–4,415.
If buyers remain strong above that area, gold may later attempt the larger resistance zone around 4,485–4,500.
▸ Trading scenario
Preferred bullish scenario
Entry: Buy around 4,275–4,290 if price gives bullish confirmation from the liquidity zone
Stop Loss: Below 4,255
Take Profit 1: 4,340–4,355
Take Profit 2: 4,367
Take Profit 3: 4,405–4,415
Take Profit 4: 4,485–4,500
Alternative entry
If gold breaks above 4,340–4,355 and retests this area as support, buyers may look for continuation toward 4,367 and 4,405–4,415.
◌ Invalidation
The bullish view becomes weaker if gold breaks below 4,255 and fails to reclaim the buy liquidity zone. In that case, the recovery structure may fail and price could return to the lower bearish channel.
⌁ Kelly’s view
Kelly’s main view is bullish while gold holds above 4,275–4,290. The market is showing a strong reaction from the lower liquidity area, and the current pullback may only be preparation for the next upside wave.
If buyers defend the buy zone and price breaks above 4,340–4,355, gold may continue toward 4,367, then 4,405–4,415. The larger bullish target remains near 4,485–4,500 if momentum expands.
Do you think gold will break above 4,367 first, or retest the buy zone once more before the next rally? Long 
Gold Short-Term Elliott Wave Analysis | Outlook for Diwali, 2026Wrap-up:-
As discussed in my previous Gold Analysis, Gold appears to have completed a Major Wave 1 at $5598 . The market is now undergoing Major Wave 2 , which is developing in a A-B-C corrective structure .
Current Elliot Wave Structure
With this correction,
Wave A concluded at $4402.
Wave B is currently unfolding.
Within Wave B :
Wave W concluded at $5419.
Wave X concluded at $3942.
Wave Y is currently unfolding.
The internal structure of the ongoing Wave Y is is currently interpreted as follows:
Internal Wave A: Concluded at $4203.
Internal Wave B is approaching completion and will be considered confirmed only after Gold registers a decisive breakout and sustains above $4411 .
Upon confirmation of Internal Wave B , the market is expected to transition into Internal Wave C , with a projected upside objective in the $4966-$5101 Range.
What I'm Watching | Till Diwali, 2026
The immediate focus remains on the completion and confirmation of Internal Wave B .
If the current Elliott Wave count remains valid and Gold sustains above $4411 , it would increase the probability of Internal Wave C commencing.
Historically, Wave C often develops as the strongest and most directional leg within an ABC corrective sequence , making this an important phase to monitor.
A sustained move above the identified resistance levels would further strengthen the bullish outlook.
Key Levels to Watch
Immediate Support: $4,230–$4,169
Bullish Projection: $4,966–$5,101 (subject to confirmation of the Bullish wave structure)
Primary Trend Bias: Bullish, as long as the current Elliott Wave structure remains valid.
Professional View
The broader structure continues to favor a bullish outlook, provided Gold holds the immediate support zone and the current Elliott Wave count remains intact.
Although short-term volatility may continue during the final stages of Major Wave 2, sustained price action above the key support levels would strengthen the probability of a subsequent impulsive advance toward higher resistance zones.
The key principle remains confirmation over anticipation. Traders should closely monitor price action around the identified Fibonacci and structural levels and reassess the wave count if those levels are decisively violated.
Disclaimer: This analysis reflects my personal interpretation of the market using Elliott Wave Theory and is shared strictly for educational purposes only. It should not be considered financial or investment advice.
"Don't predict the market. Decode it." Long 
Tilaknagar Industries: The Triangle That HeldThis chart shows a textbook five-wave advance from the 199.53 low, developing over more than eighteen months on the weekly timeframe.
Wave (1) and wave (2) established the base — a clean impulse followed by an orderly retracement. Wave (3) followed with the strongest momentum of the move, backed by a clear rise in volume, consistent with genuine participation rather than a low-liquidity push.
Wave (4) then unfolded as a contracting triangle — five overlapping legs, each smaller than the last, holding well above wave (1)'s territory. Volume tapered off through this phase, but there was no accompanying rise in selling pressure. That combination — falling volume, no distribution — is typically read as consolidation, not reversal.
The advance resumed from there. Wave (i) of the new (5) leg matched wave (1) almost point for point, a proportional relationship often seen between non-extended waves within the same structure.
Price is currently working through wave (ii) of (5), retracing into the 0.5–0.618 zone before, if the structure holds, the next leg attempts to develop.
The value of this kind of analysis lies less in forecasting and more in discipline — reading how price and volume behave at each stage, and letting the structure invalidate itself if it's wrong, rather than forcing a narrative onto the chart.
Disclaimer: This analysis is for educational purposes only and does not constitute investment advice or a recommendation to buy or sell.  Long
Long
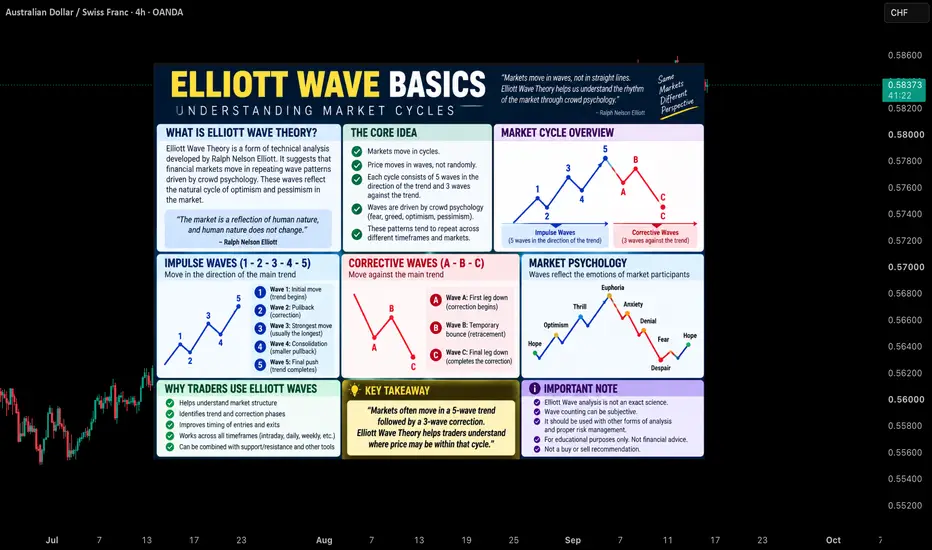
Elliott Wave Basics📌 Overview
Elliott Wave Theory is a method of technical analysis developed by Ralph Nelson Elliott. The theory suggests that financial markets move in repetitive wave patterns driven by crowd psychology and investor sentiment. These recurring patterns help traders understand market cycles, trend development, and corrective phases within price action.
---------------------------------------------------------------
📘 Definition
Elliott Wave Theory states that markets move in recognizable wave structures that reflect the collective emotions of market participants.
A complete market cycle generally consists of:
Impulse Waves (1-2-3-4-5) – Five waves moving in the direction of the primary trend.
Corrective Waves (A-B-C) – Three waves moving against the prevailing trend.
Market Cycle – The complete sequence of an impulse phase followed by a corrective phase.
Crowd Psychology – Market movements influenced by optimism, fear, greed, and uncertainty.
Wave Structure – The recurring pattern that forms trends and corrections across all timeframes.
Fractal Nature – Elliott Wave patterns can appear within larger and smaller wave structures.
---------------------------------------------------------------
📌 Key Points
• Markets move in waves rather than straight lines.
• A complete cycle consists of 5 impulse waves and 3 corrective waves.
• Impulse waves move with the trend.
• Corrective waves move against the trend.
• Wave patterns reflect crowd psychology and market sentiment.
• Elliott Wave structures can be found on all timeframes.
• The theory helps traders understand where price may be within a market cycle.
---------------------------------------------------------------
📊 Chart Explanation
• The chart illustrates a complete Elliott Wave market cycle.
• Waves 1, 3, and 5 represent the primary trend movement and are known as Impulse Waves.
• Waves 2 and 4 represent temporary pullbacks within the larger trend.
• After the completion of Wave 5, the market typically enters a corrective phase labeled A-B-C.
• Wave A begins the correction, Wave B forms a temporary retracement, and Wave C completes the corrective structure.
• The diagram also highlights how market psychology evolves throughout the cycle, from optimism and confidence to fear and uncertainty.
• The example is an educational illustration designed to explain the basic concepts of Elliott Wave Theory.
---------------------------------------------------------------
📉 Summary
Elliott Wave Theory provides a structured framework for understanding market cycles. The theory proposes that markets often progress through a five-wave trend phase followed by a three-wave corrective phase. Recognizing these patterns can help traders better interpret market structure and price behavior.
---------------------------------------------------------------
💡 Why It Matters
• Helps traders understand overall market structure.
• Provides insight into trend and correction phases.
• Improves awareness of crowd psychology.
• Assists in identifying potential stages of a market cycle.
• Can be combined with support, resistance, trendlines, and other technical tools.
• Builds a foundation for more advanced Elliott Wave analysis.
---------------------------------------------------------------
📌 Conclusion
Elliott Wave Theory remains one of the most widely recognized market cycle models in technical analysis. By understanding the relationship between impulse waves, corrective waves, and crowd psychology, traders can develop a deeper understanding of how markets often move through recurring cycles.
---------------------------------------------------------------
⚠️ Disclaimer
📘 For educational purposes only.
🙅 Not SEBI registered.
❌ Not a buy/sell recommendation.
🧠 Purely a learning resource.
📊 Not Financial Advice. XAUUSD — Sell Pressure Below 4,300XAUUSD — Sell Pressure Below 4,300
Gold is still trading with a bearish intraday structure after failing to reclaim the upper liquidity zone. From Kelly’s view, the chart suggests that XAUUSD remains under selling pressure, and the current rebound is likely just a temporary pause before price continues lower.
The key idea is simple: as long as gold stays capped below the 4,290–4,300 sell zone, the market may continue rotating down toward the 4,254 support, then extend lower into the 4,235 area and possibly the final wave target near 4,160–4,170.
⟡ Market structure
Gold is currently trading around 4,290, right below the short-term liquidity sell zone. The recent price action keeps printing lower highs, which tells us that sellers still control the structure.
The area around 4,290–4,300 is important because it acts as immediate resistance. If price continues rejecting from this zone, the market may retest 4,254 first. A break below that support would likely expose the next reaction zone around 4,235–4,245.
From the Elliott Wave view, the chart still supports a bearish continuation. The current movement looks like a corrective wave before another downside leg develops. If sellers stay in control, the market may complete the next push lower toward the 4,160–4,170 target zone.
➤ Key levels
◌ Current price area: 4,290
◌ Sell zone liquidity: 4,288–4,300
◌ Intraday resistance: 4,300–4,310
◌ Strong support: 4,254
◌ Buy scalping wave 4 zone: 4,235–4,245
◌ Main bearish target: 4,160–4,170
◌ Bearish invalidation: above 4,310
⌁ Elliott Wave view
The chart shows a bearish Elliott Wave continuation structure.
Price is struggling below the sell liquidity zone, which may be the ceiling for the current recovery attempt.
If gold cannot break above 4,300, the next move may be a decline toward 4,254.
After that, a short rebound from the 4,235–4,245 wave 4 support zone may appear.
But if the broader bearish structure stays intact, the next selling leg could extend toward 4,160–4,170 to complete the downside wave sequence.
This is why Kelly is still prioritizing the bearish scenario while price remains below resistance.
▸ Trading scenario
Preferred bearish scenario
Entry: Sell around 4,288–4,300 if price shows bearish rejection
Stop Loss: Above 4,310
Take Profit 1: 4,254
Take Profit 2: 4,235–4,245
Take Profit 3: 4,160–4,170
Alternative scenario
If gold breaks above 4,300 and holds above that zone, short-term downside pressure may weaken. In that case, price could recover higher first before sellers return.
◌ Confirmation
Bearish confirmation comes if price continues rejecting below 4,300 and breaks down through 4,254.
◌ Invalidation
The bearish view becomes weaker if gold closes above 4,310 with strong momentum. That would suggest the market is no longer respecting the current sell zone.
⌁ Kelly’s view
Kelly’s main view remains bearish while gold stays below the 4,288–4,300 liquidity zone. The chart still favors selling rallies rather than chasing buys at the current level.
If sellers defend resistance, gold may continue lower toward 4,254, then 4,235–4,245. A deeper extension could later complete near 4,160–4,170.
Do you think gold will reject directly from this sell zone, or make one more small bounce before the next leg down? Short 
TCS: The Flag That Volume Almost RuinedTCS has been moving sideways for weeks now. Slow charts like this often get ignored. But a slow chart can still be telling a story — you just have to read it patiently. Here is what I am seeing.
The Big Move First
Back in July, TCS made a sharp low near 1,977 and then rallied fast, almost in a straight line, up to about 2,495. That rally was clean and steady — no big overlaps, just strong steps up. I am marking this move as wave A (or wave 1, if you prefer the impulsive count).
The Pause After That
Since early August, the stock has been drifting down in a slow, tilted channel. Notice how the candles overlap each other here — that is very different from the sharp, clean climb before it. Overlapping price action like this usually means the market is resting, not reversing the bigger trend. This looks like a flag — a pause after a strong pole, not a breakdown.
What Volume Is Saying
Volume has been shrinking through this pause. That is a good sign — it tells us sellers are not pushing hard, they are just taking profit. But the latest session broke that pattern. It printed the biggest volume of the whole pause, and yet the candle opened high and closed near its low. That is not the kind of volume you want to see just yet. It looks more like a test that got rejected than a breakout. So for now, this is a caution flag, not a green light.
Invalidation Level:
Every idea needs a level where it breaks. For this setup, that level is around 2,088. This is the 0.786 retracement of the July-August rally. As long as TCS holds above this zone, the flag idea stays alive. A close below 2,088 would mean this is no longer a simple pause — it would call for a fresh look at the chart, not a hope-and-hold approach.
What I Am Watching Next
I want to see two things before trusting this setup: price holding above the 2,088 zone, and a strong up move that comes with rising volume, not shrinking volume. Only then does the flag idea get real support. Until that shows up, this remains a wait-and-watch chart, not a chase-it chart.
Disclaimer:
I am not a SEBI registered research analyst. This post is shared only for education and learning purposes, based on my personal reading of the chart. It is not a buy or sell recommendation. Please do your own research or speak to a registered advisor before taking any trading decision.  Long
Long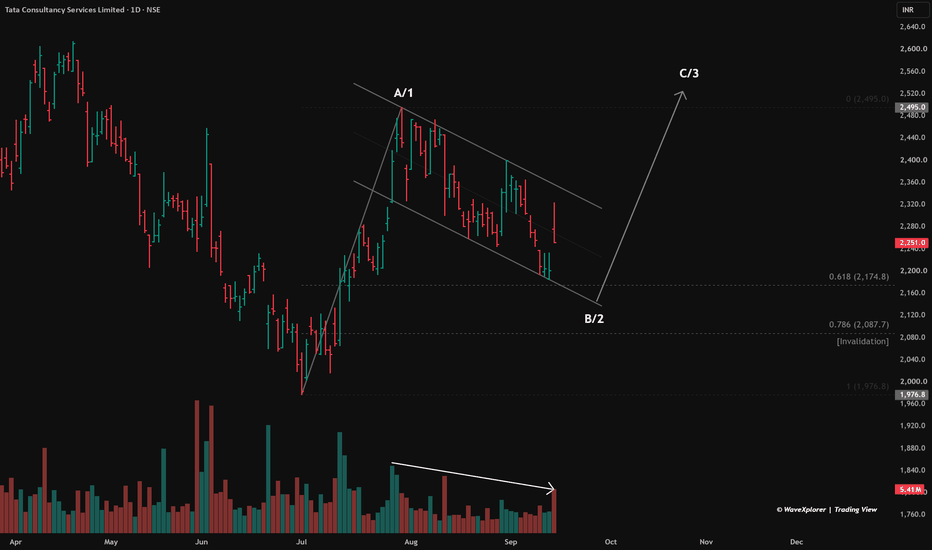
 Long
Long