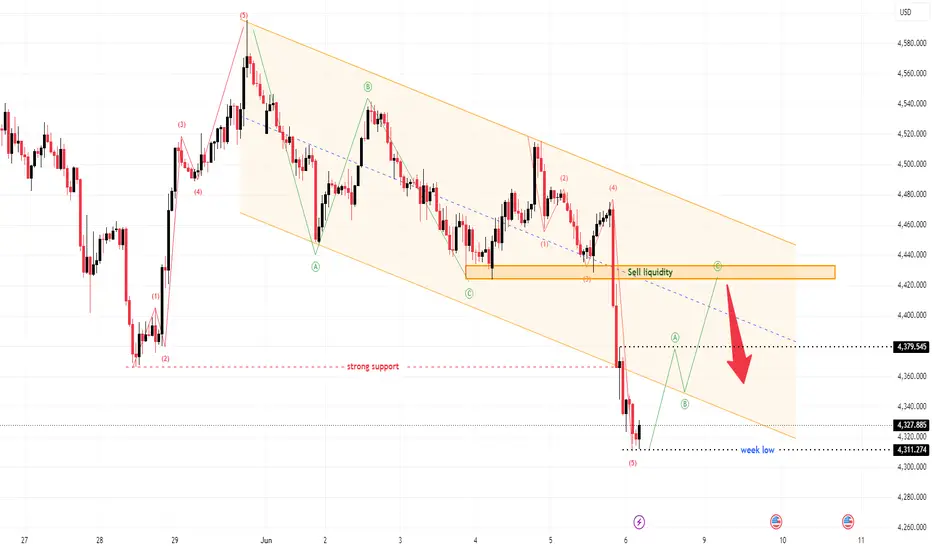
XAUUSD: ABC Recovery May Start From the Weak Low
Gold closed the week under heavy pressure after a sharp decline into the weak low area around 4,311–4,328. From Kelly’s view, the main structure is still bearish, but early next week may bring an ABC corrective recovery if price can hold above the current low zone.
This is not a full bullish reversal yet. It is a potential recovery phase after a strong sell-off.
⟡ Market structure
Gold is still trading inside a descending channel, with the broader trend controlled by lower highs and strong
Elliott Wave
Reliance (1H): Ending Diagonal Pattern At Major Support FloorLooking at Reliance Industries Limited (RELIANCE) on the 1-hour chart, a classic Elliott Wave setup is developing right at a major historical price floor.
Let us break down the wave structure, look at the recent global market development, and plan a risk-managed approach for the week ahead.
The Macro Picture: The 5-3-5 Zigzag
Looking at the broader structure from the 1,473.40 peak, the market has been correcting in a clear 5-3-5 Zigzag pattern:
Wave A: A clean 5-wave impulse down to 1,31
XAUUSD: Weekly Bearish Trend Continues DownwardGold is still trading inside a broad descending channel, and the weekly structure continues to favor the downside. From Kelly’s view, the latest price action does not yet show a strong reversal signal. Instead, the chart suggests that sellers are still controlling the larger trend, with the market now moving towards lower target zones.
The main idea for next week is simple: gold remains under pressure while price stays below the descending structure.
⟡ Market structure
The broader chart shows
National Aluminium - Potential major wave completionMonthly chart
National Aluminium got listed in April 1999
The stock completed its first super cycle degree Wave (I) in May 2008, i.e. after 9-years.
Wave (II) correction of above Wave (I) got completed in Aug 2013, i.e. after 5 years.
Wave (III) has been in progress since Aug 2013 (currently on going for over 13 years).
Wave I/Wave (III) got completed in Oct 2017
Wave II/Wave (III) got completed in March 2020
Wave III/Wave (III) has been in progress for the last 6 years+
It is highly likely
XAUUSD: Wave 5 Bearish Setup After Sell-Zone RetestGold is still trading inside a short-term descending channel, and the current structure remains controlled by sellers. From Kelly’s view, the market has already built a clear bearish sequence, and the next important setup is the potential wave 5 decline after price retests the sell zone.
The key idea is simple: do not chase the low. Wait for price to retest resistance, then observe whether sellers step back in.
⟡ Market structure
Price recently rejected from the upper channel area and started
XAUUSD bullish may trigger next upside wave.Gold is starting to recover after reacting from the 4,446 buy zone, and the intraday structure is shifting more positively. From Kelly’s view, the main trend for today is leaning bullish, but the cleaner setup still needs confirmation before expecting a stronger move into the upper liquidity area.
The key idea is simple: gold is recovering from support, but buyers need to confirm above resistance before the next wave can expand.
Market structure
Price has broken away from the lower part of th
Nifty Case Study: How to Read and Trade a Double ZigzagWe’ve all seen those times when the market needs a correction, but a simple three-wave ABC drop just isn't enough to shake out the weak hands or reset the indicators. When a single zigzag fails to get the job done, the market prints a Double Zigzag , labeled as W-X-Y .
If you want to understand how these complex corrections work, here is a simple breakdown of what they are, where to find them, and how to spot them using our recent Nifty price action.
What is a Double Zigzag?
Think of a dou
XAUUSD: Bearish intraday, waiting to sell retest.Gold is moving inside a short-term descending channel, and the current intraday structure still favors sellers. From Kelly’s view, the market is not in a clean buying setup here. The better structure is to wait for price to react from strong support first, then watch whether the rebound fades around the selling liquidity zone.
The main idea is simple: gold remains bearish intraday, but the cleaner selling setup may come after a corrective bounce.
⟡ Market structure
Price has been rejected fro
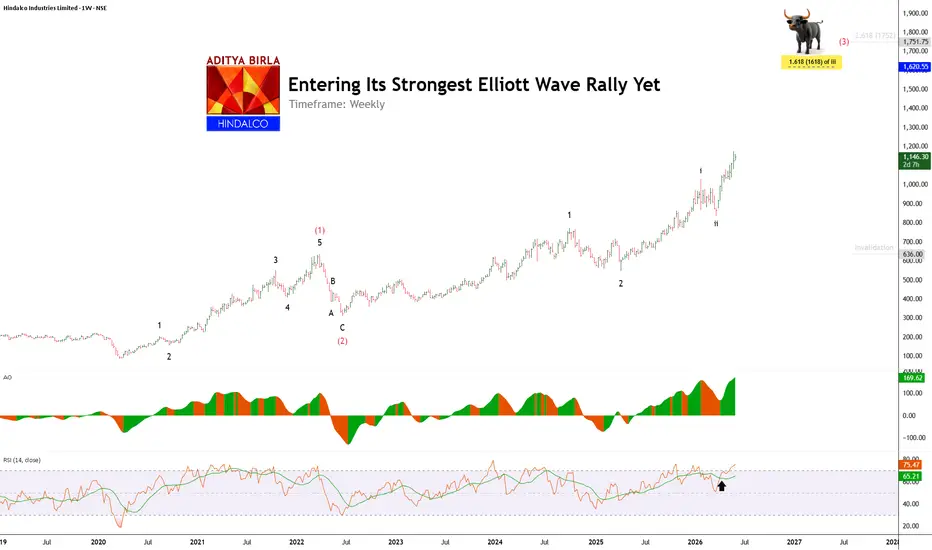
NSE Hindalco Industries – Elliott Wave View (Weekly Chart)Elliott Wave analysis suggests that Primary Wave (1) and Primary Wave (2) have likely been completed. The NSE:HINDALCO is currently trading in Primary Wave (3) , which is generally the strongest and longest phase of an Elliott Wave cycle.
Within Primary Wave (3) , Wave i and Wave ii appear to be complete. The current price action suggests that Wave iii is in progress. Momentum indicators such as RSI and Awesome Oscillator remain strong, supporting the bullish trend.
Key upside
XAUUSD: Intraday trend indicates Wave 5 bullish.Gold is trading inside a short-term rising channel, and the current structure shows buyers are still defending the intraday trend. From Kelly’s view, the market has already built a clean recovery sequence, but price is now approaching a short-term resistance area, so the better structure may come after a controlled pullback.
The key idea is simple: the daily direction remains bullish, but the cleaner buy setup is likely to appear when wave 5 begins from the buy zone.
Market structure
Gold has
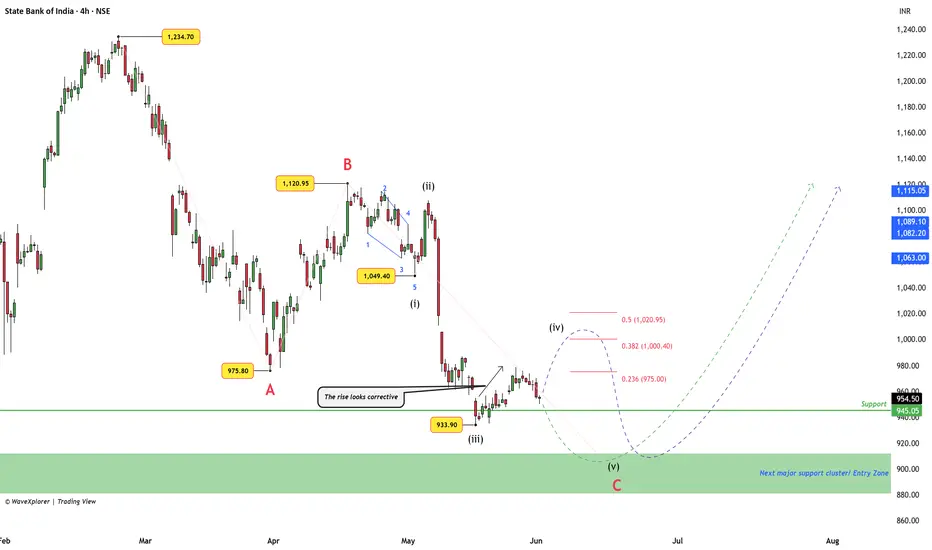
SBIN (4H): Mapping Wave C : 5-Wave Impulse v/s Complex BounceState Bank of India (SBIN) has been in a corrective phase since reaching its peak at 1,234.70 . Looking closely at the 4-hour chart, the price action seems to be carving out a larger three-part correction (an ABC structure).
Right now, we are tracking the final leg of this move, which appears to be unfolding in a five-step downward sequence. Here is a neutral, step-by-step look at the two most likely paths ahead and the exact levels where this current outlook changes.
The Near-Term Paths: Gr
XAUUSD: Wave Recovery Tests Buy ZoneGold is pulling back after a strong short-term recovery, and price is now testing the 4,497–4,400 buying zone. From Kelly’s view, this is the key area that decides whether the recent bullish recovery can continue, or whether the market needs a deeper correction first.
The current structure is important because gold has already broken out of the previous descending channel, then formed a new upside wave sequence. Now price is correcting back into support, which makes this zone a clean decision a
XAUUSD: Wave 4 halts at Sell ZoneGold is trading directly under the 4,560–4,572 sell zone after a strong medium-term decline from the previous high. From Kelly’s view, the current rebound still looks more like a corrective wave 4 than the beginning of a clean bullish reversal.
The important point is simple: price has recovered, but it is still reacting below resistance.
⟡ Market structure
The broader structure remains defensive. Gold has been forming lower highs since the major rejection near the upper range, while each reco
XAUUSD: ABC Structure Indicates Buy-Zone RetestGold is moving inside a medium-term ABC structure, and the latest reaction shows price rejecting slightly from the upper resistance area around 4,730–4,770. From Kelly’s view, this rejection does not fully cancel the recovery outlook. Instead, it suggests the market may need one more corrective pullback before attempting the next upside leg.
⟡ Market structure
The broader chart is still moving inside a rising channel, with price reacting from the lower support area near 4,366 before pushing ba
Gold Approaches Critical Area for Potential ReversalOANDA:XAUUSD Gold remains under pressure below the falling resistance trendline near 4,590 , while the current decline still looks like the final leg of the ongoing correction. Price is now moving toward the important 4,370 - 4,410 support zone, where selling momentum could begin slowing down. As long as Gold stays below resistance, the short-term structure remains weak, but a successful rebound from support could later open the path toward the 4,760+ region.
Visit: XAUUSD Entering Final
What Is a Liquidity Grab?The Truth About How Big Players Move the Market
Have you ever entered a trade…
only to see price hit your stop loss first and then move exactly in your direction?
If yes, you’ve probably experienced a **liquidity grab**.
This is one of the most important concepts in Smart Money trading, yet many beginners don’t understand it.
Most retail traders think the market moves randomly.
But in reality, big players often move price toward areas where liquidity exists.
In this article, we’ll understan
Jyothy lab : Next Multi-bagger from Consumer goods ??1] Jyothy lab stock has completed impulse Elliot wave (1-2-3-4-5) on August 2024 in 54-55 Monthly bars.
2] 54 Months is Major J.M Hurst cycle and number 55 is strong Fibonacci Cycle number.
So it's confirm completion of impulse wave.
2] The corrective wave completed on March 2026 in zigzag corrective pattern exactly at 127% of Wave-A which took approx. 18 months (which is again J.M. Hurst Cycle)
3] You can see after every 18 months stock getting topped or bottom out and recent 18 months cycl
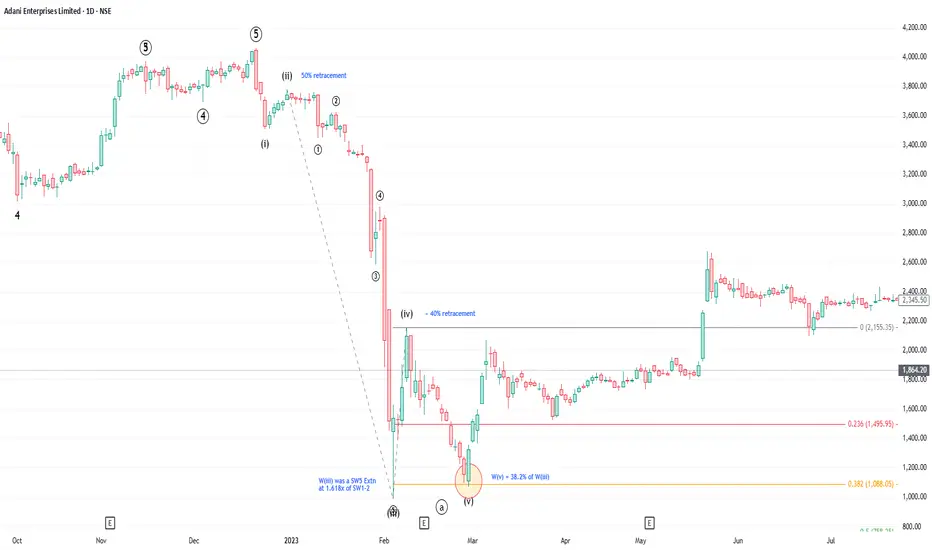
AdaniEnt – When headlines meet structure: Wave C in progress
Adani Enterprises completed an intermediate-degree Wave 5 on 21 Dec 2022 and has since been undergoing a corrective phase, forming a classic zigzag, with Wave A and Wave B already complete. The sharp decline following the Jan 2023 Hindenburg report merely accelerated the Wave A that was already in place.
The corrective pattern since the top is best classified as a zigzag (A-B-C).
Wave A unfolded as a 5-wave impulse, with Wave (iii) showing a clear extension (SW5 extension at 1.618x of SW1-2
NSE KALYANKJIL: Breakout Is Building, But Patience MattersKalyan Jewellers is still trading inside a bigger corrective wave after the strong rally toward the 795 area. Since the top, price has continued forming lower highs and lower lows, which suggests that the ongoing wave 4 correction is still active on the weekly chart.
Right now, the stock is holding near the important 330 – 340 support zone, but the broader wave structure suggests the correction could still extend toward the 250–265 region before fully stabilizing. This area becomes import
Buy Infosys, Trade Wave BInfosys completed larger degree Impulse Wave during Dec 24 and ever since has been undergoing larger degree Corrective Wave. The correction is a Zigzag which is a 5-3-5 pattern. The first five are down moves called as Wave A, followed by 3 way up movement (counter waves) called Wave B and then again followed by 5 wave down movement called Wave C. This can happen over a long period of time, however pattern can be confirmed by lower low formations.
Why buy now?
1) It now appears that Wave A of t
MCX Primary degree W5 completion - Exit
Multi Commodity Exchange of India Limited :
Though the stock got listed in Dec 2012, the stock commenced an impulse wave only during Aug 2013. The stock has seen a spectacular rally.
It completed its first Wave of primary during Dec 2016 and underwent correction until Feb 2019, i.e. Primary degree Wave 2 achieved a 61.8% retracement.
Wave 3 of primary degree was an exceptionally strong wave and same was completed during Dec 2024. W4 was a short zigzag and same got completed in Mar 2025 with
Swiggy Buy Wave 4 (counter wave) / Wave C
Swiggy has been undergoing correction since its listing in the form of a zigzag as per Elliott Wave Principe which is a 5-3-5 structure. Wave A (5 waves down), Wave B (3 waves up), and Wave C (5-waves down). Wave C has to make an equal or lower low than Wave A.
Wave A got completed on 13 May 25 and Wave B got completed on 19 Sep 25.
Wave C of the zigzag is in progress which is a 5-wave structure with one of its wave (Wave 3) being an extended wave. Wave C has already made a lower low.
Stock