XAUUSD: ABC Correction Target 4240XAUUSD: ABC correction may extend toward 4240 while broader pressure still points lower
Hello everyone, here is my view on the current XAUUSD setup.
Market Analysis
Gold is showing signs of entering a deeper corrective phase after failing to hold near the upper part of the recent rising channel. On the chart, price completed a strong push higher, but the rejection from the top zone suggests that upside momentum is fading and the market may now be shifting into an ABC corrective structure.
At the moment, the key area to watch is the 4580–4600 sell zone, where price is currently reacting. This region acts as overhead resistance and may become the origin of the next downside leg if sellers continue to defend it. The structure on the right side of the chart suggests that gold may first develop a short rebound, then form another lower high before extending into the final C leg.
The first important support sits around the 4480–4490 liquidity buy zone. If this area fails to hold on the next bounce sequence, the downside path may open further toward the 4240 target zone, which is clearly marked on the chart as the main objective of the ABC correction.
From a broader perspective, the bigger concern is that this decline may not stop there if bearish pressure continues to build. While 4240 is the main near-term target of the current corrective structure, the longer-term chart still leaves room for a much deeper extension toward the 3901 region if gold remains under pressure and cannot rebuild a stronger bullish base.
So for now, the market appears to be transitioning from an impulsive rise into a corrective downside phase, with the ABC path favoring further weakness unless price can reclaim the key resistance zone above.
Key Price Areas to Watch
Current reaction zone: around 4580–4600
Sell zone / overhead resistance: 4580–4600
Liquidity buy zone: around 4480–4490
Main ABC downside target: 4240
Longer-term bearish extension: 3901
My Scenario & Strategy
My preferred scenario is to treat the current structure as an ABC correction, with gold still vulnerable to another leg lower.
As long as price remains below the 4580–4600 sell zone, I continue to favor a bearish continuation view. A weak rebound into resistance followed by fresh rejection would support the idea of the market moving down toward 4240 as the next major target.
If bearish momentum remains strong even after reaching that zone, then the broader long-term structure may continue pointing toward 3901, which becomes the deeper downside level to watch.
However, if gold reclaims the sell zone and starts holding above it with stronger candles, the current ABC bearish path would weaken and the market could shift into a more stable recovery phase.
That’s the setup I’m watching for now. Thank you for reading, and always manage your risk carefully.  Short
Short
 Long
Long
Long 
 Long
Long
Long 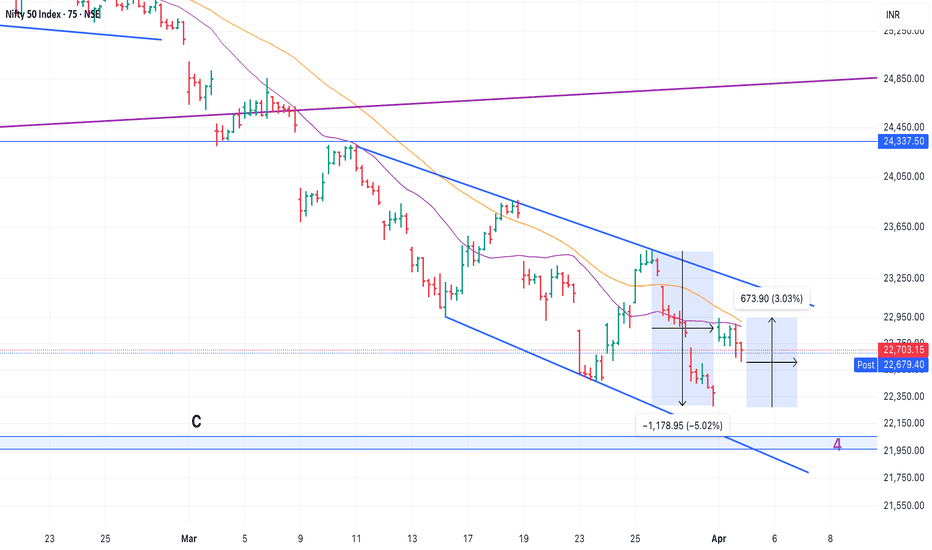
XAUUSD bullish, Wave 5 active, buy above 4483 support.XAUUSD: Wave 5 remains active as gold continues to hold its bullish structure
Hello everyone, here is my view on the current XAUUSD setup.
Market Analysis
Gold continues to maintain a constructive recovery structure, and at this stage, the current Wave 5 advance still appears active rather than completed. After the previous rebound from the lower base, price has been forming a sequence of higher lows while respecting the rising trendline from below, which keeps the bullish structure in place.
What is important here is that gold is not only holding above short-term support, but it is also gradually pressing into higher resistance layers. This behavior suggests that buyers are still active, and the market may be preparing for another extension higher rather than rolling over into a deeper correction.
From the chart, the first key barrier comes in around 4601, which is marked as a strong resistance zone. If price can continue holding above the current structure and break through this level with confirmation, the next area to watch is around 4717, where another strong resistance zone is waiting. Beyond that, the broader upside target remains near the psychological 5000 region, which also aligns with the 1.618 Fibonacci extension around 4968.
So for now, the technical picture still supports the idea that gold is in an active bullish leg, with Wave 5 not yet showing a clear completion signal.
At the same time, the rising trendline remains the most important guide for this setup. As long as price continues to respect this support line, the bullish continuation view remains valid. But if the market breaks below the key support structure, the buy scenario would weaken quickly.
Key Price Areas to Watch
Current price zone: around 4543
Trendline support: still holding
Immediate support / bullish protection zone: 4483
Stronger support below: 4346
First strong resistance: 4601
Next resistance zone: 4630–4717
Main upside objective: 4968–5000
My Scenario & Strategy
My preferred scenario is to continue buying with the trend, because the current structure still suggests that Wave 5 remains in progress.
As long as XAUUSD stays above the 4483 support region and continues respecting the rising trendline, I still favor the upside continuation scenario. A sustained move higher from the current area could send gold toward 4601 first. If that resistance is cleared, the next upside path opens toward 4630–4717, and later toward the broader 4968–5000 target zone.
However, the bullish setup should be invalidated if price breaks below the key support area, especially if gold loses the 4483 zone and fails to recover back above it. In that case, the structure would no longer support immediate buying, and the market could rotate deeper toward 4346 before a new bullish setup can be considered.
For now, the trend remains constructive, Wave 5 is still holding, and the market continues to favor buying while support stays intact.
That’s the setup I’m watching for now. Thank you for reading, and always manage your risk carefully. Long 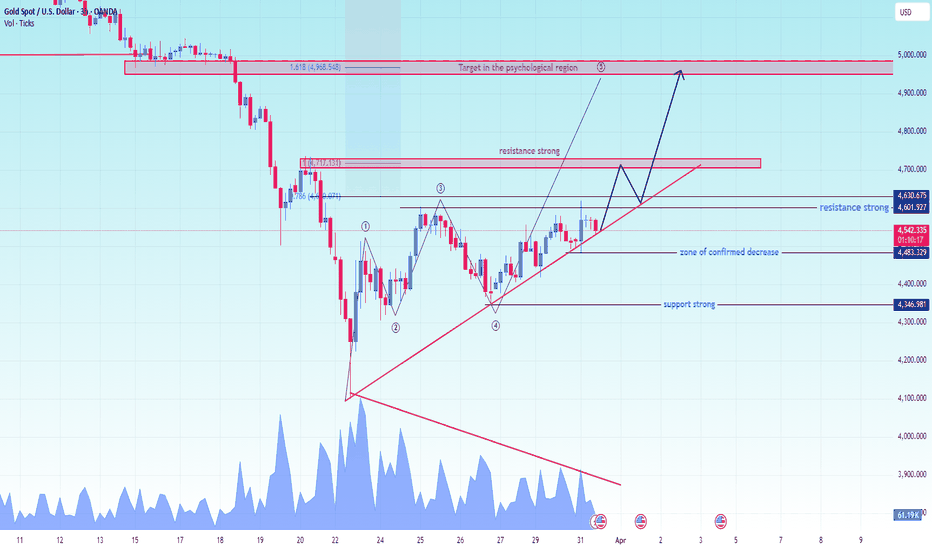
Nifty 50 Long-Term Valuation & Reversal PredictionInvestment Note: Nifty 50 Long-Term Valuation & Technical Outlook
Date: March 31, 2026
Subject: Nifty 50 Strategic Reversal Zone and Multi-Year Valuation Analysis
The Nifty 50 is currently approaching a significant historical value zone. With the Current PE at 19.62,
Historical data from the past decade suggests that the Nifty rarely sustains levels below a PE of 20 for extended periods. This fundamental valuation, combined with a "Flat Correction" technical pattern, suggests a strong probability of a reversal from the current levels 22000-21350.
Valuation Analysis: The PE 20 Floor
Analysis of the last 10 years indicates that the Nifty 50 maintains a healthy LT Average PE ratio between 20x and 22x.
Current Status: At a PE of 19.62, the index is entering the "Cheap" territory (typically defined as <20x).
Historical Precedent: As seen in 2016, 2020, and 2022, major reversals have consistently triggered when the PE drops into the 19.3x – 20.4x range.
Technical Outlook & Key Levels
The price action is currently completing a Flat Correction pattern, which aligns with a major structural support zone.
Expected Reversal Zone: 21,350 – 22,000
This range represents a high-concurrency zone where technical support meets fundamental value.
Immediate Resistance/Target: 26,370
A successful reversal from the 22,000 base sets the stage for a recovery toward previous highs.
Long-Term Upside Projection: 30,750
Based on current projections, this represents an estimated ~40% upside from the expected reversal floor. Long 
Long 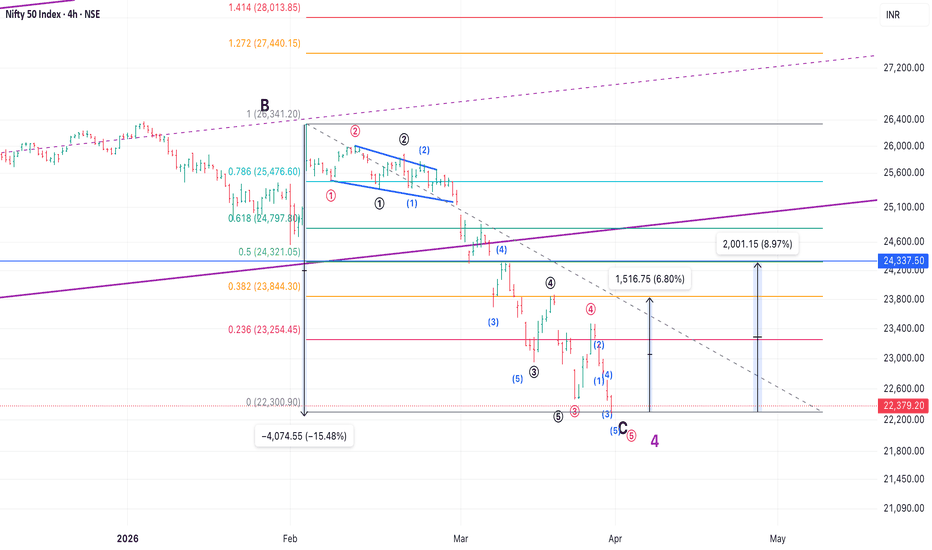
Long 
Long 
Short 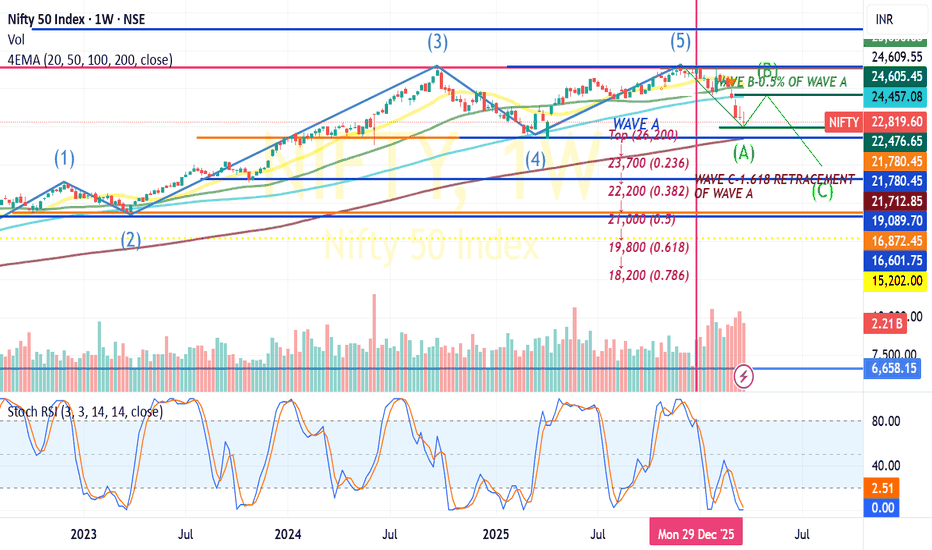
 Short
Short
XAUUSD: Wave 5 targets 1.618 extension.Hello everyone, here is my view on the current XAUUSD setup.
Market Analysis
Gold is showing signs of continuing its Elliott Wave 5 advance after reacting strongly from the recent low. On the chart, the price has already completed a sharp bearish phase, then formed a recovery structure that now looks like a developing impulsive move to the upside.
What stands out here is that the market is holding above the rising short-term support line while building a sequence of higher swings. This suggests that buyers are gradually regaining control, and the current structure may still have room to extend before facing a more meaningful rejection.
From a Fibonacci perspective, the next important upside objective comes in around the 1.618 extension near 4968, which also aligns closely with a strong psychological region around 5000. This creates a very important confluence zone and makes it the main target area to watch if the bullish structure continues to hold.
Before reaching that higher objective, price may still face resistance around 4601, which is marked as a strong resistance level on the chart. A clean break above this area would strengthen the bullish continuation view and open the way toward the upper target zone.
One more interesting detail here is the volume paradox. While the price is recovering and trying to extend higher, volume is not expanding in a fully aggressive way. At the same time, the previous decline was accompanied by stronger selling activity. This creates a divergence-like condition: the price is climbing, but volume is not confirming the move with the same strength. In my view, this does not immediately cancel the bullish setup, but it does suggest that the current upside may be driven more by structural recovery than by full conviction buying. That means the market can still move higher, but traders should stay alert as the price approaches major resistance.
So in this case, the structure still supports an upward move, but the behavior of volume reminds us to be careful not to treat the rally as a completely one-sided bullish breakout just yet.
Key Price Areas to Watch
Current price zone: around 4493
Short-term support trendline: still holding
First strong resistance: 4601
Main upside target: 4968
Psychological resistance zone: around 5000
My Scenario & Strategy
My preferred scenario is to continue following the current structure as an active Wave 5 recovery, as long as the price keeps respecting the rising support trendline.
If gold remains supported above the current structure and breaks through 4601, the upside path may open further toward the 1.618 Fibonacci extension at 4968, which also sits close to the major psychological 5000 region. That area is likely to become the key target zone for this bullish leg.
However, because volume is not fully confirming the recovery with strong expansion, I would also remain careful as the price moves closer to resistance. If momentum starts fading near the target zone, that area could trigger a stronger reaction.
If the price loses the rising support line and fails to maintain the sequence of higher swings, the bullish continuation structure would weaken and the market may fall back into a broader consolidation phase before attempting another directional move.
That’s the setup I’m watching for now. Thank you for reading, and always manage your risk carefully. Long 
 Long
Long
Short 
XAUUSD: Focus on new bearish movement.XAUUSD: Recovery appears complete as gold resumes the next bearish leg
Hello everyone, here is my view on the current XAUUSD setup.
Market Analysis
Gold remains under pressure and the latest price action suggests that the recent recovery phase has already ended. Instead of developing into a broader reversal, the rebound was rejected inside overhead supply, and price is now starting to roll over into a new bearish leg.
From the chart structure, XAUUSD is still trading inside a medium-term descending channel, with the main trendline continuing to cap upside attempts. This keeps the broader market tone negative, even though short-term rebounds may still appear along the way.
The current rebound zone has already been tested, and price is now reacting below the 4440–4500 area. This region is important because it acts as a sell zone, where liquidity and previous resistance are overlapping. As long as gold stays below this supply area, sellers remain in control and the downside continuation scenario stays valid.
Higher up, the next notable resistance comes in around 4600–4620, which is another overhead supply zone and could serve as an additional sell area if price makes a deeper corrective bounce. On the downside, the 4300 area remains the first important liquidity zone to watch, while the broader bearish extension still points toward 4134 if momentum continues to build.
What matters most here is that gold has not broken the descending trend structure. Price is still trading below the major falling trendline, which means rallies should still be treated cautiously and mainly as opportunities for sellers to reposition.
Key Price Areas to Watch
Current price area: around 4442
Primary sell zone: 4440–4500
Secondary resistance / supply zone: 4600–4620
Liquidity support below: around 4300
Main bearish target: around 4134
My Scenario & Strategy
My preferred view is that the recent rebound has already completed, and gold is now starting a new move lower within the broader bearish structure.
As long as XAUUSD remains below the 4440–4500 resistance zone and continues trading under the descending trendline, I still favor selling rallies rather than looking for aggressive long positions. If price continues to weaken from this area, the first downside objective comes in around 4300. If bearish momentum expands further, the market may extend toward 4134.
If a deeper correction happens first, the 4600–4620 zone would become the next area to monitor for bearish rejection. Only a strong recovery above the main resistance structure would weaken the current bearish continuation view.
That’s the setup I’m watching for now. Thank you for reading, and always manage your risk carefully. Short 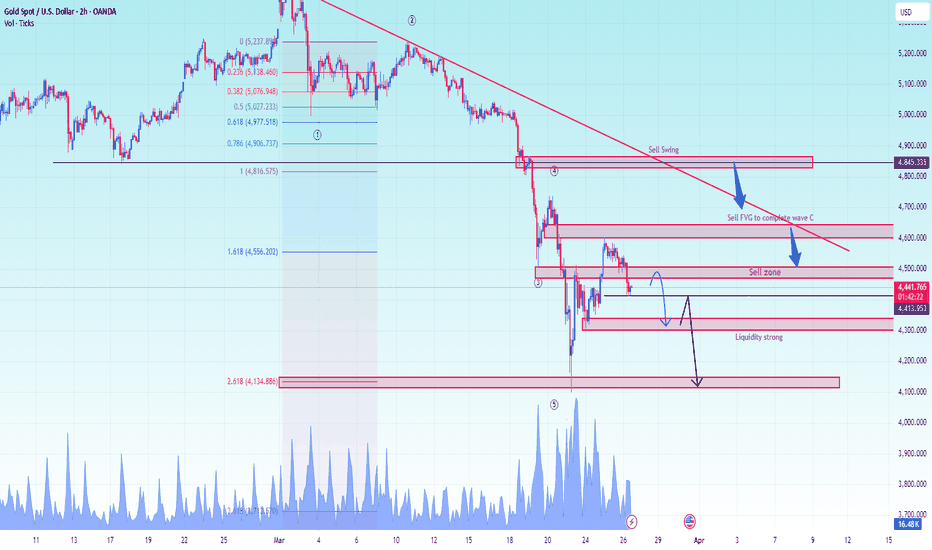
 Short
Short
 Short
Short
XAUUSD — Gold is still in wave 2 recoverywhile the bigger impulsive leg has not started yet
Gold is continuing to recover from the recent low, but the current move is better read as a wave 2 rebound rather than a full bullish expansion.
That distinction matters, because wave 2 usually carries a corrective character: price can recover with decent momentum, but the move is still vulnerable until the next impulsive leg confirms itself.
For Kelly, this is an important stage.
The market is no longer collapsing, but it is not yet in the strongest part of the upside sequence either. What we are seeing now is a recovery structure trying to build a base before the next real decision point.
Technical structure
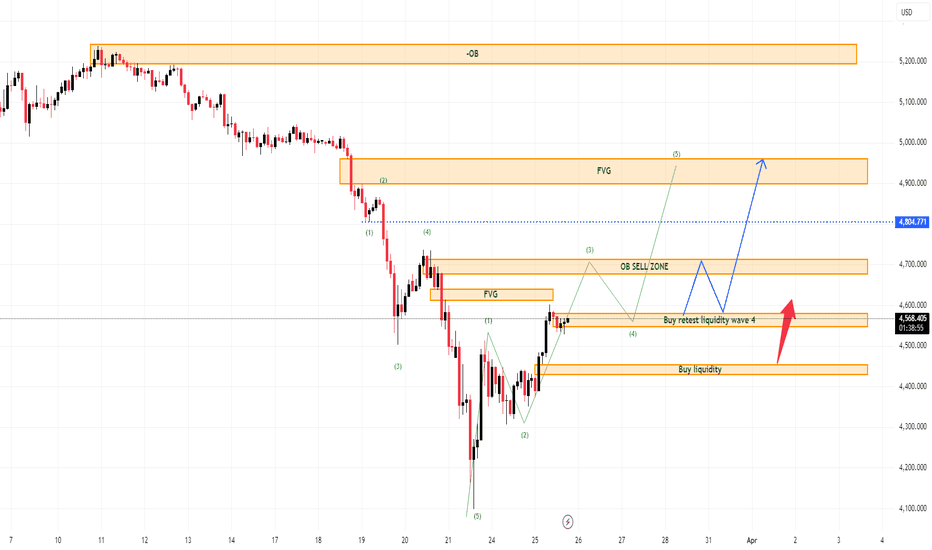
The sharp reaction from the lower buy liquidity zone around 4400–4420 created the first shift in short-term tone.
From there, gold established a recovery path with higher lows and started rotating back into the 4550–4560 retest liquidity area, which is now acting as the immediate support base for the current rebound.
This zone is important because it sits right under current price and represents the area buyers need to defend if the recovery is going to stay valid.
As long as gold continues to hold above this base, the corrective rebound in wave 2 remains intact.
Above the market, the next technical layers are clearly visible:
4690–4710 OB sell zone as the first major resistance
4900–4950 FVG as the next upside inefficiency area
5200 higher-timeframe OB as the larger medium-term reference if the recovery expands further
So structurally, price has room to continue higher in the short to medium term, but the market is still traveling through resistance overhead, which is why the current move should not yet be treated as a completed bullish reversal.
Wave count and market logic
From an Elliott-style view, the current recovery is more consistent with wave 2.
The reason is that the rebound is happening after a deep selloff and is now retracing back into prior imbalance and supply. That is typical wave 2 behavior:
price recovers from exhaustion, corrects part of the decline, and tests whether the market is ready to transition into a stronger leg later.
At this point, wave 2 can still continue stretching higher as long as price keeps respecting the recovery base.
That opens the way for a push toward the 4690–4710 OB zone, where the chart is more likely to face a meaningful decision.
Only after price proves it can move cleanly through those upper resistance layers would the case for a broader impulsive leg become stronger.
Until then, the current rebound should still be treated as a corrective build-up phase rather than a confirmed breakout sequence.
Why gold is still supported fundamentally
Gold is also not cooling off easily in the current environment.
War-related uncertainty and persistent inflation risk are both helping to keep the metal supported on dips.
That does not mean price can only move in one direction, but it does explain why the market is able to recover from liquidity zones instead of staying under heavy pressure for long.
In other words, the macro backdrop is helping the technical recovery stay alive while the chart builds through wave 2.
For Kelly, this combination matters.
When technical recovery aligns with a market environment that still favors defensive demand, the path of least resistance in the near term can remain to the upside — at least until the chart reaches stronger supply.
What matters next
The immediate focus is still on how gold behaves around the current 4550–4560 support-retest zone.
If price continues to hold there and prints another constructive push higher, then the next likely destination remains the 4690–4710 OB sell zone.
That is the first area where wave 2 may begin to slow down or meet heavier resistance.
If buyers manage to break above that zone with stronger follow-through, then the larger 4900–4950 FVG becomes the next technical magnet.
That would still fit the idea of wave 2 extending further before the market decides whether it is ready for the next major rotation.
On the downside, a loss of the current retest base would weaken the quality of the rebound and suggest that wave 2 is failing to mature properly.
But right now, the chart still favors continuation of the recovery phase rather than immediate rejection.
Kelly’s read
For Kelly, this is not a sell structure anymore, but it is also not yet the strongest bullish phase.
The better interpretation is that gold is in a corrective recovery wave, with price still trying to climb toward overhead inefficiencies and supply.
That means the chart deserves patience.
There is enough structure to respect the upside, but not enough yet to call it a full impulsive breakout.
As long as price holds above the current base, the market can continue working higher through wave 2.
The real test will come later, when gold reaches the OB sell zone and the upper FVG. That is where the next higher-timeframe decision will likely be made.
Conclusion
Gold is still in wave 2 recovery, and the current structure supports further upside as long as the 4550–4560 retest zone continues to hold.
The first major target remains the 4690–4710 OB zone, with room toward 4900–4950 if the rebound extends further.
For now, the market is not yet in wave 3 acceleration.
It is still building through the corrective phase — and that means the recovery can continue, but the strongest bullish leg has not started yet.
Gold is recovering with structure, but the real expansion still needs to be earned. Long