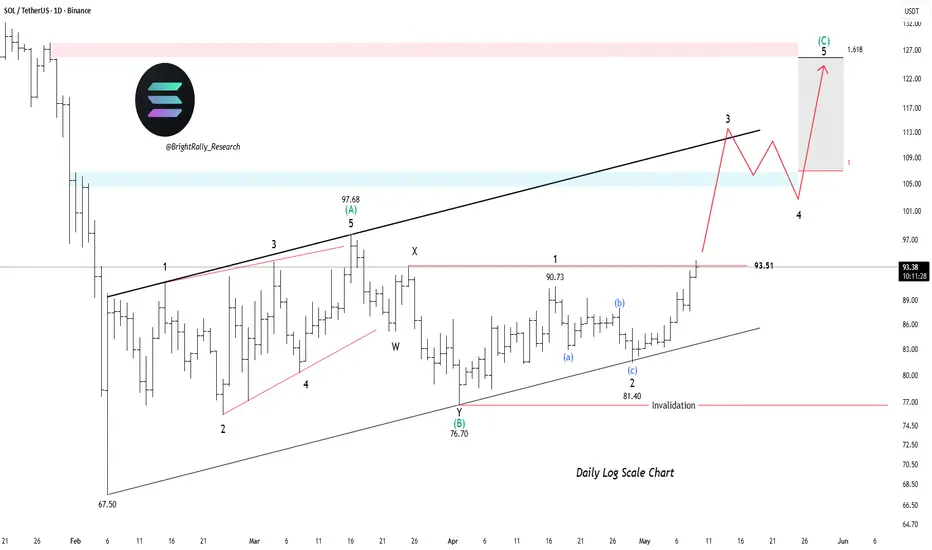
SOLUSDT: Slowly Building Pressure for the Next Wave C RallySOLUSDT on the daily chart is starting to regain strength after holding the broader ascending structure from the 76 low. Price spent the last few weeks consolidating above the trendline instead of breaking below it, which shows buyers are still defending the higher timeframe trend. The recent push back above the 90.73 resistance area is an early sign that momentum may be shifting back toward the upside.
The corrective move also looks relatively controlled compared to the earlier rally. Instea
Elliott Wave
Nifty Analysis for the week 11 May to 15 May, 2026Wrap up:-
As mentioned earlier, we are in wave y of x of 4 of major wave 3.
In wave y, a lower degree impulse (i.e. wave a) is forming in which wave 1 was completed at 22782, wave 2 at 22719, wave 3 is completed at 24400, wave 4 is completed at 23796 and wave 5 is in progress and is expected to be completed in the range 24772-25116 (which is fresh next resistance level).
In wave 5, internal wave 1 is completed at 24087 and wave 2 is in progress and is making a wxy pattern. Wave w is complete
GBPCHF: Trend Shift UnderwayGBP/CHF appears to be forming a major bottom after completing a long corrective decline near 1.0290 . The chart suggests the pair may have finished a five-wave bearish structure, signaling a possible shift toward a new bullish cycle. Price is now attempting to stabilize above 1.0500, while recent buying pressure shows momentum is gradually improving. The first bullish confirmation level stands at 1.0800 , and a sustained breakout above it could trigger a stronger recovery phase. This is only a
XAUUSD - Bullish trend - Elliot Wave 5Welcome Traders! Based on the current market structure, we are standing on the brink of a massive downward collapse. The Bears are preparing to take full control.
Below is the detailed Elliott Wave roadmap and the optimal positioning strategy to catch this entire bearish wave.
1. 🧠 CURRENT STRUCTURE: Confirming the Wave 3 Decline
The market is operating under a clear bearish structure, completely breaking the previous recovery phase:
Wave (1) Completed: The initial impulsive move to the downs
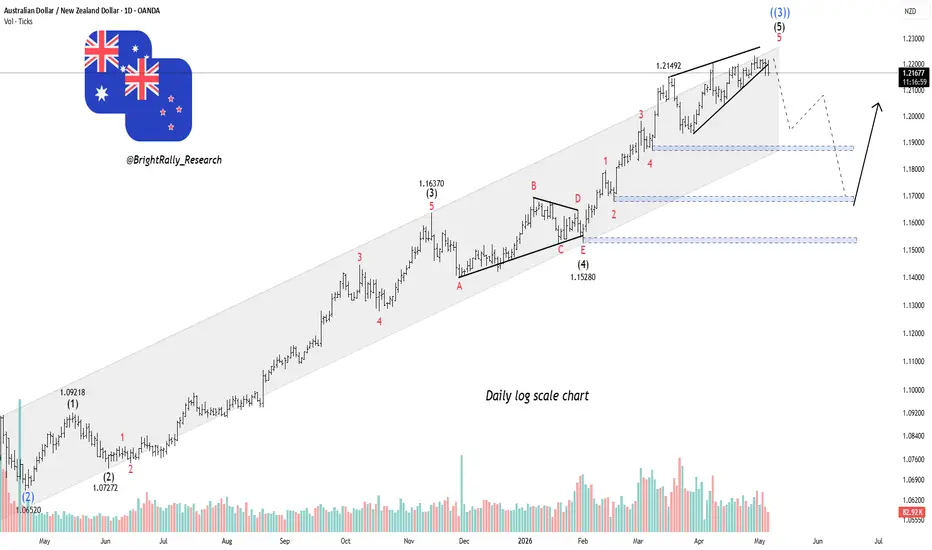
AUDNZD: Breakout or Bull Trap?AUD/NZD remains in a strong long-term uptrend, but the chart suggests the pair is likely completing the final stage of its bullish Elliott Wave structure near 1.2200 . Price is still holding inside the rising channel, showing buyers remain active, yet the recent slowing momentum and wedge formation indicate the rally may be running out of strength. If buyers manage to break above 1.2200 , the next upside target stands near 1.2300 , where the current bullish cycle could fully mature.
The proj
ETHUSD - Bulls Loading Up Just Below BreakoutETH on the 4H chart is forming a cup and handle pattern. The rounded bottom came after the drop into the 1,937 area, and from there, the Crypto has been slowly climbing back up. That kind of recovery usually shows steady buying rather than a quick bounce. Now, ETH is pulling back slightly, which is the handle part. This pullback looks controlled, not aggressive, so it feels more like a pause than any real weakness.
At the moment, price is just moving in a tight range and drifting a bit lower.
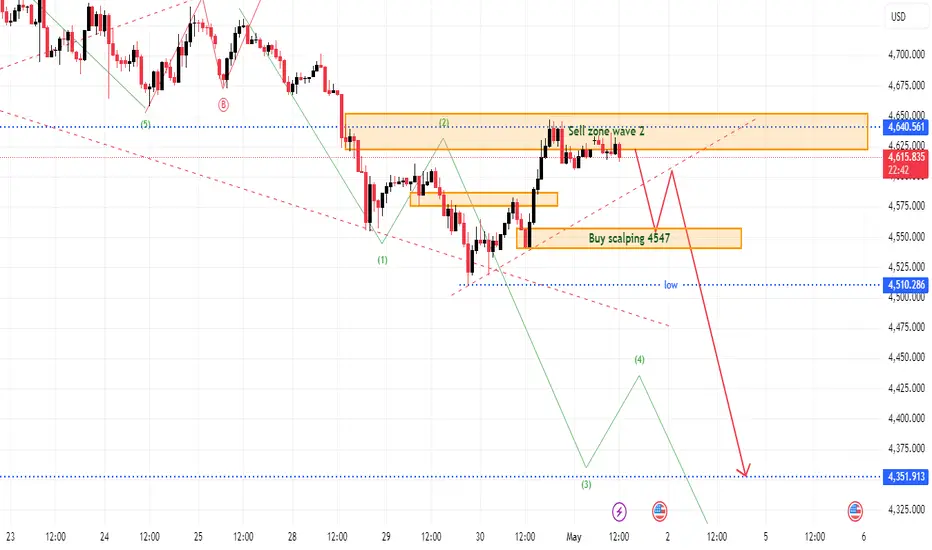
XAUUSD Elliott Wave SetupPOSITIONING FOR THE WAVE 3 CRASH TO 4,350
Market Structure & Wave Count
Wave (1) Completion: The initial impulsive move to the downside has concluded at the "Strong Support" area (4,500 – 4,520), establishing a structural low and breaking the prior bullish A-B-C correction.
Wave (2) Retracement: Price is currently completing a technical correction, pushing up to retest the "Sell zone wave 2" between 4,560 and 4,580.
Wave (3) Confirmation: Strong price rejection at the current Sell Zon
Buy Hindunilvr (Wave C of zigzag completion).
Hindunilvr has been undergoing larger degree correction since Sep 24 following a major wave completion.
The stock completed Wave A (of Zigzag) as a 5-wave sequence on 4 Mar 25 and completed Wave B, i.e. counter wave on 4 Sep 25, as an impulse wave.
As per EWP, Wave C has to make a lower low or an equal low than Wave A.
Wave C has been unfolding as a 5-wave sequence.
It is highly likely that stock will be completing Wave C at similar levels of Wave A, i.e. Equal Low at about 2102 levels wi
HDFC Bank - ultra Short term buying opportunity (5 -10%)
All views expressed are based only on Elliott Wave Principle.
HDFC Bank completed W4 of primary Degree of Wave III of cycle degree during covid and ever since has been forming Wave 5 for the last 5 years.
Primary degree Wave 5 of the said Cycle degree Wave appears to have been completed as a truncated wave as per Elliott Wave Theory. (Check additional notes on why it is?).
The stock has been undergoing larger degree correction since 1 Dec 2025. The assumed structure is a zigzag which is a 5
BajFinance, Trade W(IV), buy at ~ 840 levels
All views expressed here are based on Elliott Wave Principle.
Bajaj Finance is undergoing a larger correction following completion of a Primary Degree Wave.
Stock is forming a Wave A of zigzag.
Wave A is unfolding as follows : -
Wave (I) got completed on 26 Nov, Wave (II) which is a counter wave got completed on 5 Dec. Following this a 5-wave sequence got completed on 2 Feb, however the retracement entered into the Wave (I) area due to which became an invalid wave as Wave (III) cannot enter
Buy Airtel - Trade W4 (counter wave ) for a 8 – 10% return
The views expressed are based on Elliott Wave Principle.
Following the lows of 30 Aug 2012 where the stock concluded a cycle degree Wave II, it has been forming a very strong impulse for over 13+ years.
The stock has completed its next impulse wave of cycle degree on 21 Nov 25. On monthly scale, the stock concluded W5 at 38.2% of W1-3 and has been undergoing correction for the last 4 months. (Please check comment below for the monthly chart wave conclusion).
Following the impulse conclusion
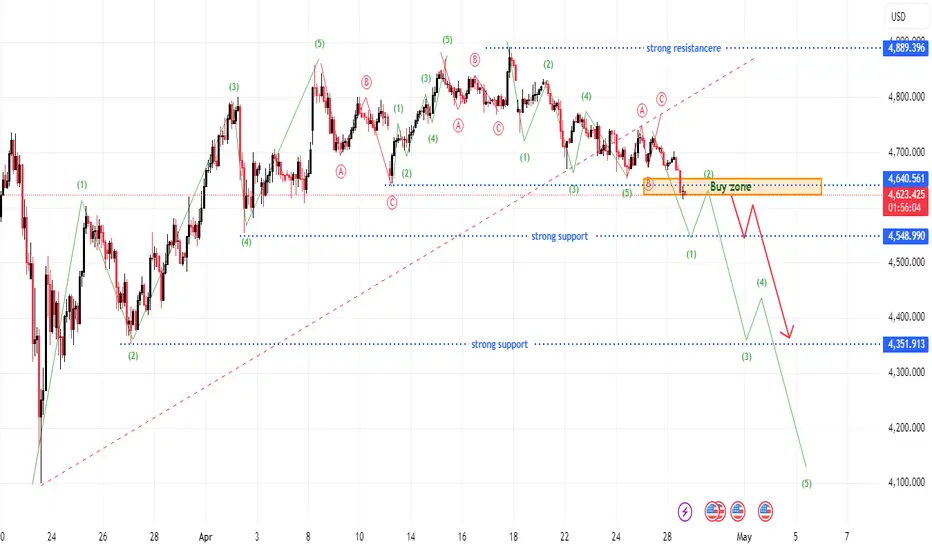
XAUUSD Elliott Wave: Wave 3 Buy SignalMarket Structure & Wave Count
Wave (1) Completion: The initial impulsive move to the downside has concluded, establishing a structural low.
Wave (2) Retracement: Price has completed a technical correction, successfully retesting the Sell Zone Wave 2 at the 4,640.561 level.
Wave (3) Confirmation: Strong price rejection at the current resistance confirms the end of the corrective phase and the start of Impulsive Wave (3)—typically the most powerful move in an Elliott Wave sequence.
Key Technic
XAUUSD - Bearish Pressure ContinuesIn our previous analysis, we anticipated a decline toward key support levels, and XAUUSD has now successfully reached the S2 zone.
Click here:
We are still expecting the bearish scenario until the price confirms its movement. A failure to reclaim 4,730 is the first signal that bulls are losing control. If price continues to reject from this level, the probability shifts toward a deeper move, potentially breaking S2 and heading toward the S3 region near 4,330 . In short, above 4,730 , bu
NIFTY 50 heading for 23800 level again ??On 1 hour timeframe, we can see nifty completed Bearish Elliot wave impulse wave (1-2-3-4-5) and corrective flat pattern (A-B-C) looks to be over and we are probably heading for Bearish 3rd wave in nifty and we can see Nifty reaching 23800 levels again may be in a week or two weeks.
Note : This view is only for learning and educational purpose and it's not option buying or selling recommendation.
XAUUSD: Wave 3 Bullish – Target 4351XAUUSD Analysis: Elliott Wave Structure Confirms Bearish Momentum – Target 4351
Gold is weakening clearly in the short term as selling pressure returns and pushes price below the 4630 area. From a technical perspective, this no longer looks like a minor pullback. It is starting to resemble a continuation structure, with the near-term support zone beginning to lose its effect.
Technical structure
On the chart, price has slipped below the recent reaction zone and is now testing the Sell Z
Nifty 50 Neowave ForecastNamskaram Everyone
I know with all the uncertainty war, crude prices how can we predict the long term market. But market is actually a mathematic equation with psychological events. So we read this with neowave.
So I will try to explain my logic with different neowave charts, kindly pay atttention.
The current chart>>>>The Daily Chart
This price action is simple price has fall 2 tmes with wave-1 and wave 3.
Currently we in wave-4 and we should expect another fall as wave 5.
Let zoom in like
Nifty 50 Levels for 29th April 2026If there is no gap-down opening on 29th April in market (must be flat opening to positive opening), we could see nifty reaching 24160 to 24200 levels.
Flat wave-A and Wave-B looks to be completed and tomorrow we could see nifty heading for wave-C.
Note : This view is only for learning and educational purpose and this is not option buying or selling recommendation.
XAUUSD - Bearish Structure Points to Further DownsideIn XAUUSD, Selling targets are 4650 - 4560 - 4465 . Before taking any action, read the analysis below for context and confirmation. Take it as a channel breakdown setup in the initial phase.
XAUUSD is moving inside a rising structure but is starting to lose momentum near the upper boundary. The recent highs are weakening, and the gold is struggling to hold above the mid-range. Immediate focus is on the support zones marked as S1 and S2, as a break below these can trigger a sharper downside mov
IGIL : Strong Consolidation Breakout and re-testIGIL stock was consolidating in the same range from NOV-2025 and it has given strong breakout and break-out level also got tested.
Stock fundamentals are very strong and stock could reach 440 levels in shorter period of time.
Note : This idea is purely for educational and learning purpose.
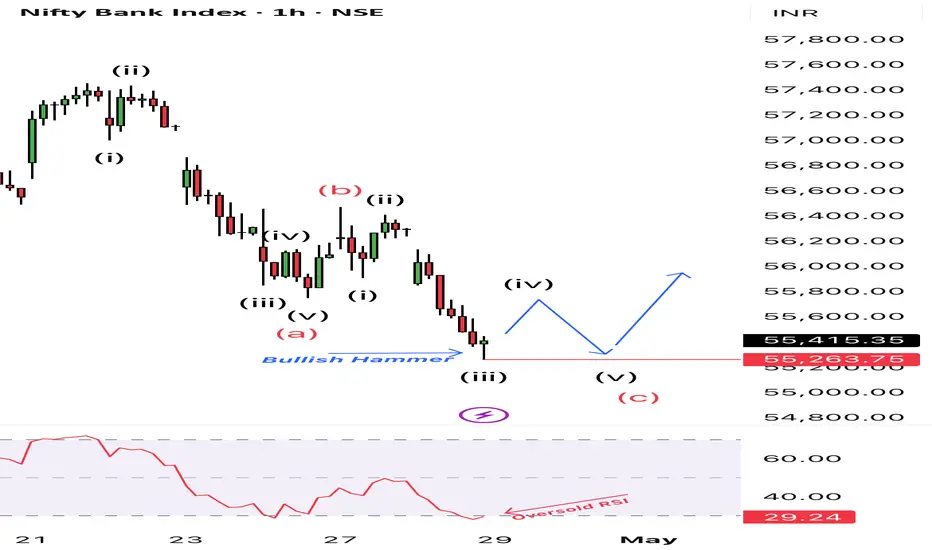
Nifty Bank: Relief Rally SetupNifty Bank Index (1H) Technical Update:
Price action indicates sub-wave (iii) exhaustion within a broader wave (c) correction. A bullish hammer has formed at 55,263.75 support, confluencing with an oversold RSI (29.24).
Anticipating a tactical wave (iv) counter-trend retracement before a final wave (v) decline.
Invalidation for this immediate relief bounce is strictly defined below the hammer wick.
Disclaimer: Not a buy/sell recommendation.
XAUUSD: Buy Zone FailingGold is clearly weakening in the short term as selling pressure returns and pushes price below the 4630 area. From Kelly’s perspective, this no longer looks like a minor pullback. It is starting to resemble a continuation structure, with the near-term support zone beginning to lose its effect.
Technical structure
On the chart, price has slipped below the recent reaction zone and is now testing the 4640 buying zone from a weaker position. What stands out is that the market has not been able to
XAUUSD: Selling Wave C Near Sell ZoneGold is pushing into a sensitive area, but from Kelly’s perspective, the current recovery is more likely the final short wave C of a corrective structure rather than the start of a sustainable bullish trend. What makes this zone especially important is that price is approaching the 4742–4748 sell zone, where the short-term structure may complete before the market begins a new cycle on the higher timeframe. Technical structure The current structure shows gold still reacting below near-term resist