XAUUSD: Bearish Pressure Prevails◈ XAUUSD: Bearish Pressure Still Controls the Structure
Gold is facing renewed selling pressure as the market reacts to stronger USD demand and rising concerns around inflation expectations. From Kelly’s view, the chart also supports this bearish tone, with price still trading below the key sell zone and showing signs that another Elliott wave decline may continue.
The key idea is simple: gold is not yet showing a clean bullish recovery, and the structure still favours downside continuation while price remains below resistance.
⟡ Market structure
The chart shows gold has been moving in a repeated bearish rhythm, with several recovery attempts failing near resistance. After the latest rebound, price could not hold above the 4,060–4,080 area and quickly rotated lower again.
The current price is around 4,036, while the nearest sell zone is sitting near 4,020–4,035. This area is important because price is trying to stabilise here, but the recovery is still weak. If sellers continue to defend this zone, gold may drop back towards the lower Fibonacci support.
The main downside target remains the 3,940–3,955 area, where the chart marks the support zone, Fibonacci 1.618 extension, and potential end of wave 5.
➤ Key levels
◌ 4,020–4,035: current sell zone and short-term resistance
◌ 3,985–4,000: buy scalping wave 4 reaction area
◌ 3,940–3,955: support / Fibonacci 1.618 / wave 5 target
◌ 4,060–4,080: resistance area if price rebounds
◌ Above 4,080: area where the bearish setup starts to weaken
⌁ Elliott Wave view
From an Elliott Wave perspective, gold appears to be forming a bearish 5-wave continuation after the previous corrective rebound failed.
Wave 1 started the decline from the upper resistance area.
Wave 2 created a short recovery but failed to change the structure.
Wave 3 pushed price lower with stronger bearish pressure.
Wave 4 may be developing around the 3,985–4,000 reaction area.
If the sell zone continues to hold, wave 5 may extend towards 3,940–3,955.
This is why Kelly would still treat the current market as bearish unless gold can reclaim the higher resistance zone with strength.
▸ Fundamental backdrop
Gold is under pressure as energy-driven inflation concerns keep the market cautious about the Fed’s policy path. If traders continue pricing in a more hawkish Fed outlook, the US Dollar may stay supported and limit gold’s recovery.
At the same time, rising US-Iran tension is also supporting USD demand as a safe-haven currency. This creates a difficult environment for gold in the short term, especially when the technical structure is already leaning bearish.
▸ Trading scenario
Preferred scenario: wait for price to reject from the 4,020–4,035 sell zone before expecting bearish continuation.
Sell zone: 4,020–4,035 if bearish confirmation appears
Stop loss: above 4,080 or above the confirmed rejection high
Take profit 1: 3,985–4,000
Take profit 2: 3,960
Take profit 3: 3,940–3,955
Alternative scenario: if gold breaks above 4,080 and holds with strong acceptance, the bearish wave 5 setup weakens. In that case, price may move into a corrective recovery before the next structure becomes clear.
⌁ Kelly’s view
For Kelly, gold is still trading under bearish pressure. The macro backdrop supports USD strength, while the technical chart shows price failing to reclaim key resistance.
The cleaner plan is not to chase price at the low, but to wait for a reaction around the sell zone. If sellers defend that area, wave 5 may continue towards the Fibonacci support below.
Gold remains vulnerable.
As long as resistance holds, the downside structure still has priority.
Share your view below.  Short
Short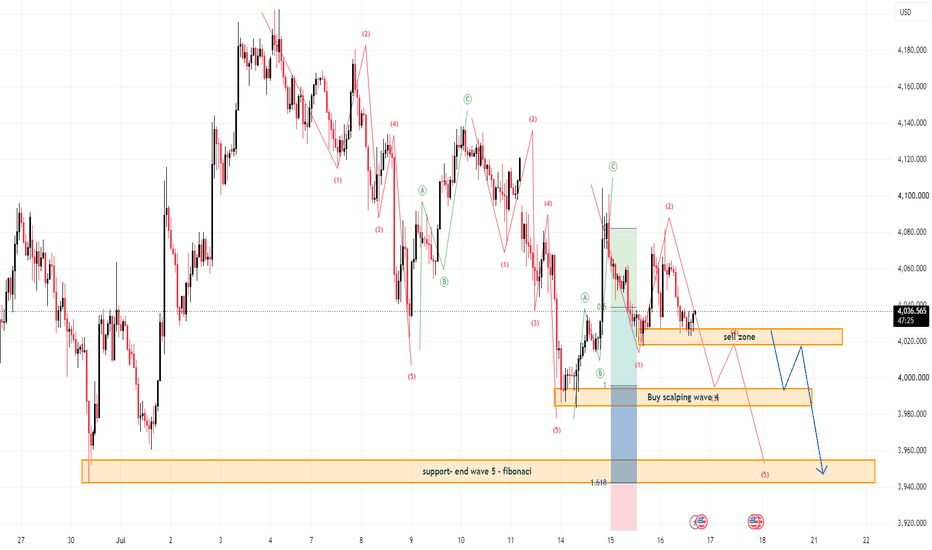
 Long
Long
XAUUSD: Bearish Wave 5 May Persist TodayGold is showing weakness again after failing to hold the recovery structure above the short-term resistance area. From Kelly’s view, the current chart suggests that price may be developing a bearish wave 5 move, with sellers still active below the 4,035–4,040 sell zone.
The key idea is simple: gold is trying to rebound, but the structure still favors downside continuation while price remains below resistance.
⟡ Market structure
The chart shows gold completed a short recovery after reacting from the lower area, but buyers failed to sustain momentum above the 4,062 resistance level. Price then started forming lower highs again and is now trading near 4,026.
The support zone around 4,015–4,025 is currently being tested. If this area breaks with clear bearish pressure, gold may continue lower towards the Fibonacci 1.618 target zone around 3,960–3,970.
The sell zone around 4,035–4,040 is important. As long as price remains below this area, the bearish intraday structure remains active.
➤ Key levels
◌ 4,035–4,040: sell zone wave 4 and short-term resistance
◌ 4,026: current reaction area
◌ 4,015–4,025: support area under pressure
◌ 4,062: key resistance and bullish invalidation zone
◌ 3,960–3,970: Fibonacci 1.618 target and wave 5 downside area
◌ Above 4,062: area where the bearish wave setup weakens
⌁ Elliott Wave view
From an Elliott Wave perspective, gold appears to be forming a bearish 5-wave structure after the recovery failed near resistance.
Wave 1 created the first downside reaction from the recent high.
Wave 2 corrected higher but failed below resistance.
Wave 3 pushed price back into the support zone.
Wave 4 may now be forming around the 4,035–4,040 sell area.
If this zone holds, wave 5 may continue lower towards the 3,960–3,970 target.
This is why Kelly would not treat the current support reaction as a reversal yet. Price still needs to reclaim resistance before the bullish view becomes stronger.
▸ Trading scenario
Preferred scenario: wait for price to reject from the 4,035–4,040 sell zone before expecting wave 5 continuation.
Sell zone: 4,035–4,040 if bearish confirmation appears
Stop loss: above 4,062 or above the confirmed rejection high
Take profit 1: 4,015
Take profit 2: 3,990
Take profit 3: 3,960–3,970
Alternative scenario: if gold breaks above 4,062 and holds with strong acceptance, the bearish wave 5 setup weakens. In that case, the market may shift back into a corrective recovery structure.
⌁ Kelly’s view
For Kelly, this is a bearish intraday setup. Gold is still trading below the sell zone, and the Elliott structure suggests one more downside leg may develop if sellers defend resistance.
The cleaner plan is to avoid chasing price at support and wait for a retest reaction around 4,035–4,040.
Gold is still under short-term pressure.
If the sell zone holds, wave 5 may continue towards the Fibonacci target below.
Share your view below. Long 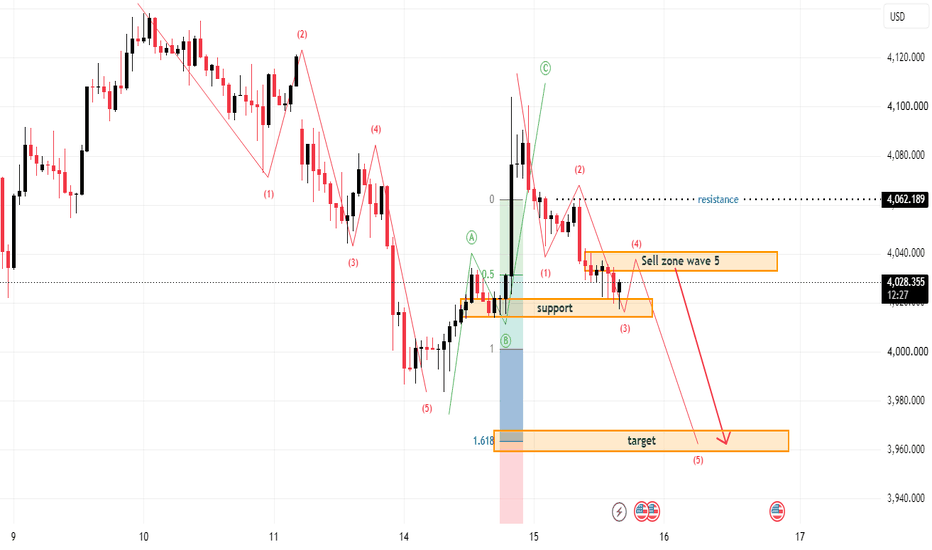
 Long
Long
 Long
Long
 Long
Long
XAUUSD: ABC Recovery Forming After Elliott DropGold is trying to recover after completing a sharp bearish Elliott wave sequence near the lower price area. From Kelly’s view, the market has already reacted from the recent low, but the current move still looks more like an ABC corrective recovery rather than a confirmed bullish reversal.
The key idea is simple: gold may continue to rebound in the short term, but the reaction around each resistance zone will decide whether buyers can keep control.
⟡ Market structure
The chart shows gold previously moved in a strong bearish sequence, creating lower highs and lower lows before reaching the final wave 5 area near the lower base. After that, price started to recover and is now forming a short-term ABC structure.
Price is currently trading around 4,027, close to the small sell zone near 4,038. If gold can hold above the buy wave C area around 4,011, the recovery may continue towards the higher reaction zones.
The important resistance above is the Elliott wave completed sell zone around 4,060–4,070. This is where buyers need to prove strength, because rejection from this area may bring another pullback.
➤ Key levels
◌ 4,011: buy wave C zone and short-term support
◌ 4,027: current reaction area
◌ 4,038: nearest sell zone
◌ 4,060–4,070: Elliott completed zone and main resistance
◌ 3,985–3,990: lower support if wave C fails
◌ Above 4,070: area where recovery gains stronger quality
⌁ Elliott Wave view
From an Elliott Wave perspective, gold appears to have completed a bearish 5-wave move near the lower low. After that, the market is now building an ABC correction.
Wave A created the first rebound from the low.
Wave B pulled back into the current structure.
Wave C may develop from the 4,011 area if buyers defend support.
If wave C holds and price breaks above 4,038, gold may continue towards 4,060–4,070. However, if price fails to hold 4,011, the ABC recovery weakens and gold may retest the lower base again.
▸ Trading scenario
Preferred scenario: wait for price to hold the buy wave C zone and show bullish confirmation.
Entry zone: 4,011–4,020 if bullish confirmation appears
Stop loss: below the confirmed wave C low
Take profit 1: 4,038
Take profit 2: 4,060–4,070
Take profit 3: 4,090 if momentum expands
Alternative scenario: if gold breaks below 4,011 and fails to reclaim this area, the ABC structure loses quality. In that case, price may return towards 3,985–3,990 before forming a new base.
⌁ Kelly’s view
For Kelly, this is a short-term ABC recovery setup after a completed bearish Elliott wave. The market is no longer in clean sell momentum at the low, but buyers still need to confirm strength through resistance.
The cleaner plan is to watch the reaction around 4,011 first. If buyers defend this zone, gold may continue recovering towards the sell zones above.
Gold is forming an ABC rebound.
If wave C holds, the next move may continue towards 4,038 and 4,060.
Share your view below. Long 
 Long
Long
 Long
Long
 Long
Long
XAUUSD: Bearish Elliott Wave Indicates Fibonacci TargetsGold is moving under renewed downside pressure after failing to hold the recovery structure above the 4,100 area. From Kelly’s view, the current chart suggests that a bearish Elliott wave sequence is developing, and price may continue lower if the sell zone remains defended.
The key idea is simple: gold is still weak below resistance, and the next downside targets are now guided by the Fibonacci structure.
⟡ Market structure
The chart shows gold rejected from the upper recovery area and started forming lower highs again. Price is now trading near 4,055, directly under the sell wave 5 zone, which makes this area very important for the next reaction.
The nearest resistance sits around 4,055–4,060. If gold cannot reclaim this zone with strength, sellers may continue to control the short-term structure.
Below current price, the chart highlights the 4,015–4,025 area as the next wave 4 reaction zone. If that support fails, the larger Elliott Wave End area around 3,950–3,960 becomes the main downside target.
➤ Key levels
◌ 4,055–4,060: sell wave 5 zone and current resistance
◌ 4,015–4,025: buy zone wave 4 / first downside reaction area
◌ 3,950–3,960: Elliott Wave End and Fibonacci 2.618 target zone
◌ 4,090–4,105: upper resistance if price rebounds
◌ Above 4,105: area where the bearish wave count weakens
⌁ Elliott Wave view
From an Elliott Wave perspective, gold appears to be building a bearish 5-wave structure after completing the previous corrective rebound.
Wave 1 created the first downside move from the recent high.
Wave 2 corrected upward but failed to continue higher.
Wave 3 pushed price lower with stronger momentum.
Wave 4 may form around 4,015–4,025 as a temporary reaction.
If the sell wave 5 zone continues to hold, wave 5 may extend towards the Fibonacci 2.618 target near 3,950–3,960.
This is why Kelly would treat the current rebound carefully. As long as price remains below resistance, the structure still favours a continuation lower.
▸ Trading scenario
Preferred scenario: wait for price to reject from the 4,055–4,060 sell zone before expecting downside continuation.
Sell zone: 4,055–4,060 if bearish confirmation appears
Stop loss: above 4,105 or above the confirmed rejection high
Take profit 1: 4,015–4,025
Take profit 2: 3,980
Take profit 3: 3,950–3,960
Alternative scenario: if gold breaks above 4,105 and holds with strong acceptance, the bearish Elliott setup weakens. In that case, price may need to rebuild a new structure before the next direction becomes clearer.
⌁ Kelly’s view
For Kelly, this is still a bearish Elliott structure. Gold has not shown enough strength to confirm a bullish reversal, and the market is now reacting under an important sell zone.
The cleanest plan is to follow the Fibonacci roadmap and wait for confirmation from resistance.
Gold remains under pressure.
If the sell zone holds, the next bearish wave may continue towards the Fibonacci targets below.
Share your view below. Short 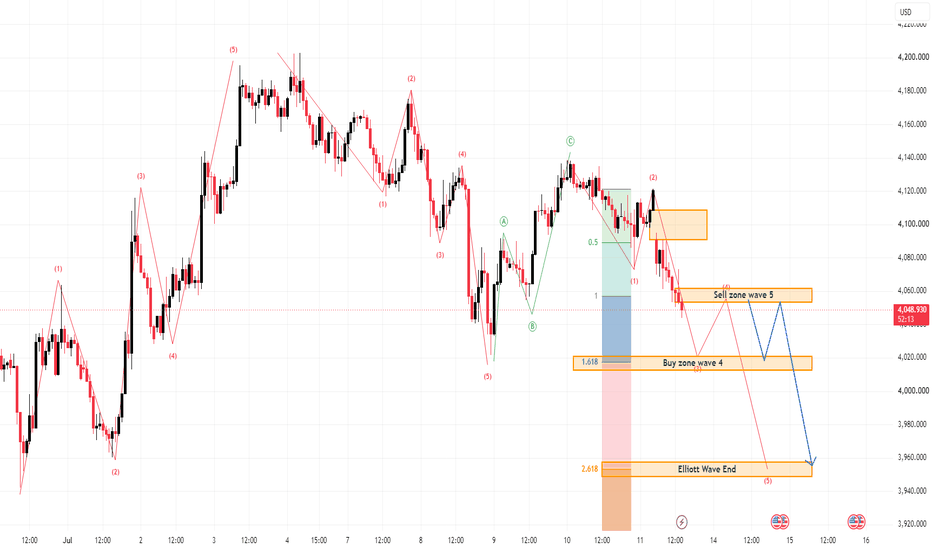
 Long
Long
 Long
Long
 Long
Long
 Long
Long
Elliott Wave Principle: Understanding One Complete Market CycleThe Elliott Wave Principle is often considered one of the most complex forms of technical analysis, but it is also one of the most powerful, highly accurate frameworks for understanding market structure across stocks, indices, commodities, forex, and cryptocurrencies.
This chart presents one complete Elliott Wave cycle to help beginners visualize how waves develop in real market conditions.
Two Modes of Wave Development
1. Motive Waves
Move in the direction of the larger trend
Consist of five waves (1–2–3–4–5)
Usually appear as an Impulse structure
Diagonals are also motive waves, but they are relatively rare
2. Corrective Waves
Move against the larger trend
Consist of three waves (A–B–C)
Can form as Zigzags, Flats, Triangles, or combinations
What Does a Complete Cycle Look Like?
A complete Elliott Wave cycle contains 8 waves:
Motive phase - 5 waves
Corrective phase -3 waves
Total - 8 waves
5 motive waves (1, 2, 3, 4, 5) followed by 3 corrective waves (A, B, C).
Key Rules
Wave 2 cannot retrace more than 100% of Wave 1.
Wave 4 cannot retrace more than 100% of Wave 3.
Wave 4 should not overlap the price territory of Wave 1 in a standard impulse.
Wave 3 is often the longest and strongest motive wave and can never be the shortest among Waves 1, 3, and 5.
What This Chart Shows
The beginning of Wave 1 after a completed correction.
The ABC correction of Wave 2.
An extended Wave 3 with its internal subdivisions.
The ABC correction of Wave 4.
The final Wave 5 completing the impulse phase.
A subsequent A–B–C zigzag correction retracing part of the entire advance.
Educational purpose only — not a buy or sell recommendation.
 Education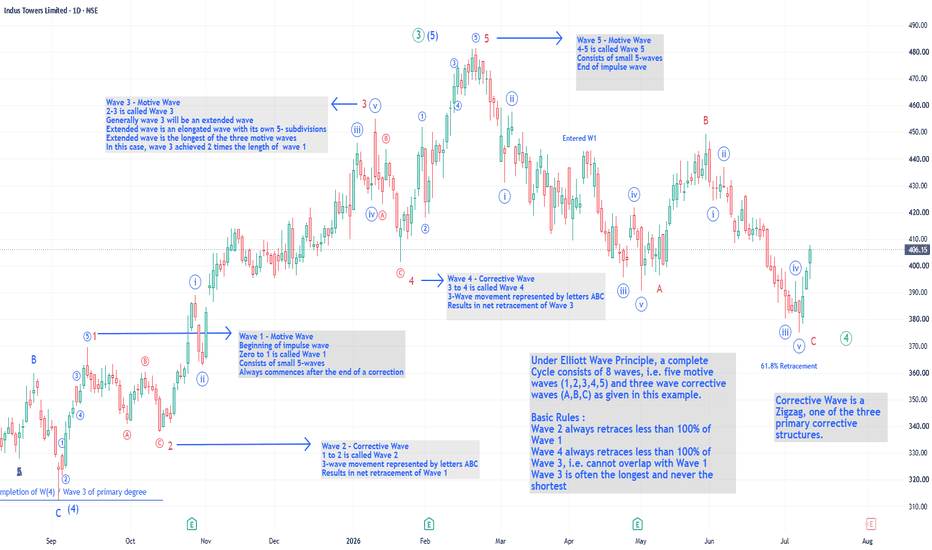
Short 
 Long
Long
Long 
 Long
Long
 Long
Long